- display data from the trace
- select which parts of test case inputs and test case outputs to display
- modify the layout the annotation UI
annotation_config_type: by default this is “flexible”. The other types are “summarization” and “multiturn” which make it easier to work with specific use casescomponents: this is a 2D list of annotation items. Each annotation item points to somewhere in the test case data, test case output, or trace. When the annotator grades the test case output, they will see data pulled from each location- Each annotation item has a “data_loc” field and an optional “label” field. The “data_loc” is an array that points to where annotation data should be pulled from. The “label” is a name to be displayed to a user for the “data_loc”.
⚠️ if a “data_loc” points somewhere that doesn’t exist for one or more test cases, you will not be able to create the evaluation.
- Each annotation item has a “data_loc” field and an optional “label” field. The “data_loc” is an array that points to where annotation data should be pulled from. The “label” is a name to be displayed to a user for the “data_loc”.
direction: by default “row”. Decides whether components are laid out as rows or as columns

data_locs can take any of these shapes:
It is highly recommended that you use the
data_locator helper instead of manually creating the data_loc array.
Customizing the Annotation UI per question
Sometimes, you have certain questions in an evaluation rubric that are relevant only to a specific part of the test case, test case output or trace. For instance, you might ask a question specifically about the “completion” or “reranking” step in the trace. In that case you can create aquestion_id_to_annotation_config mapping that lets you override the annotation config for a specific question ID:
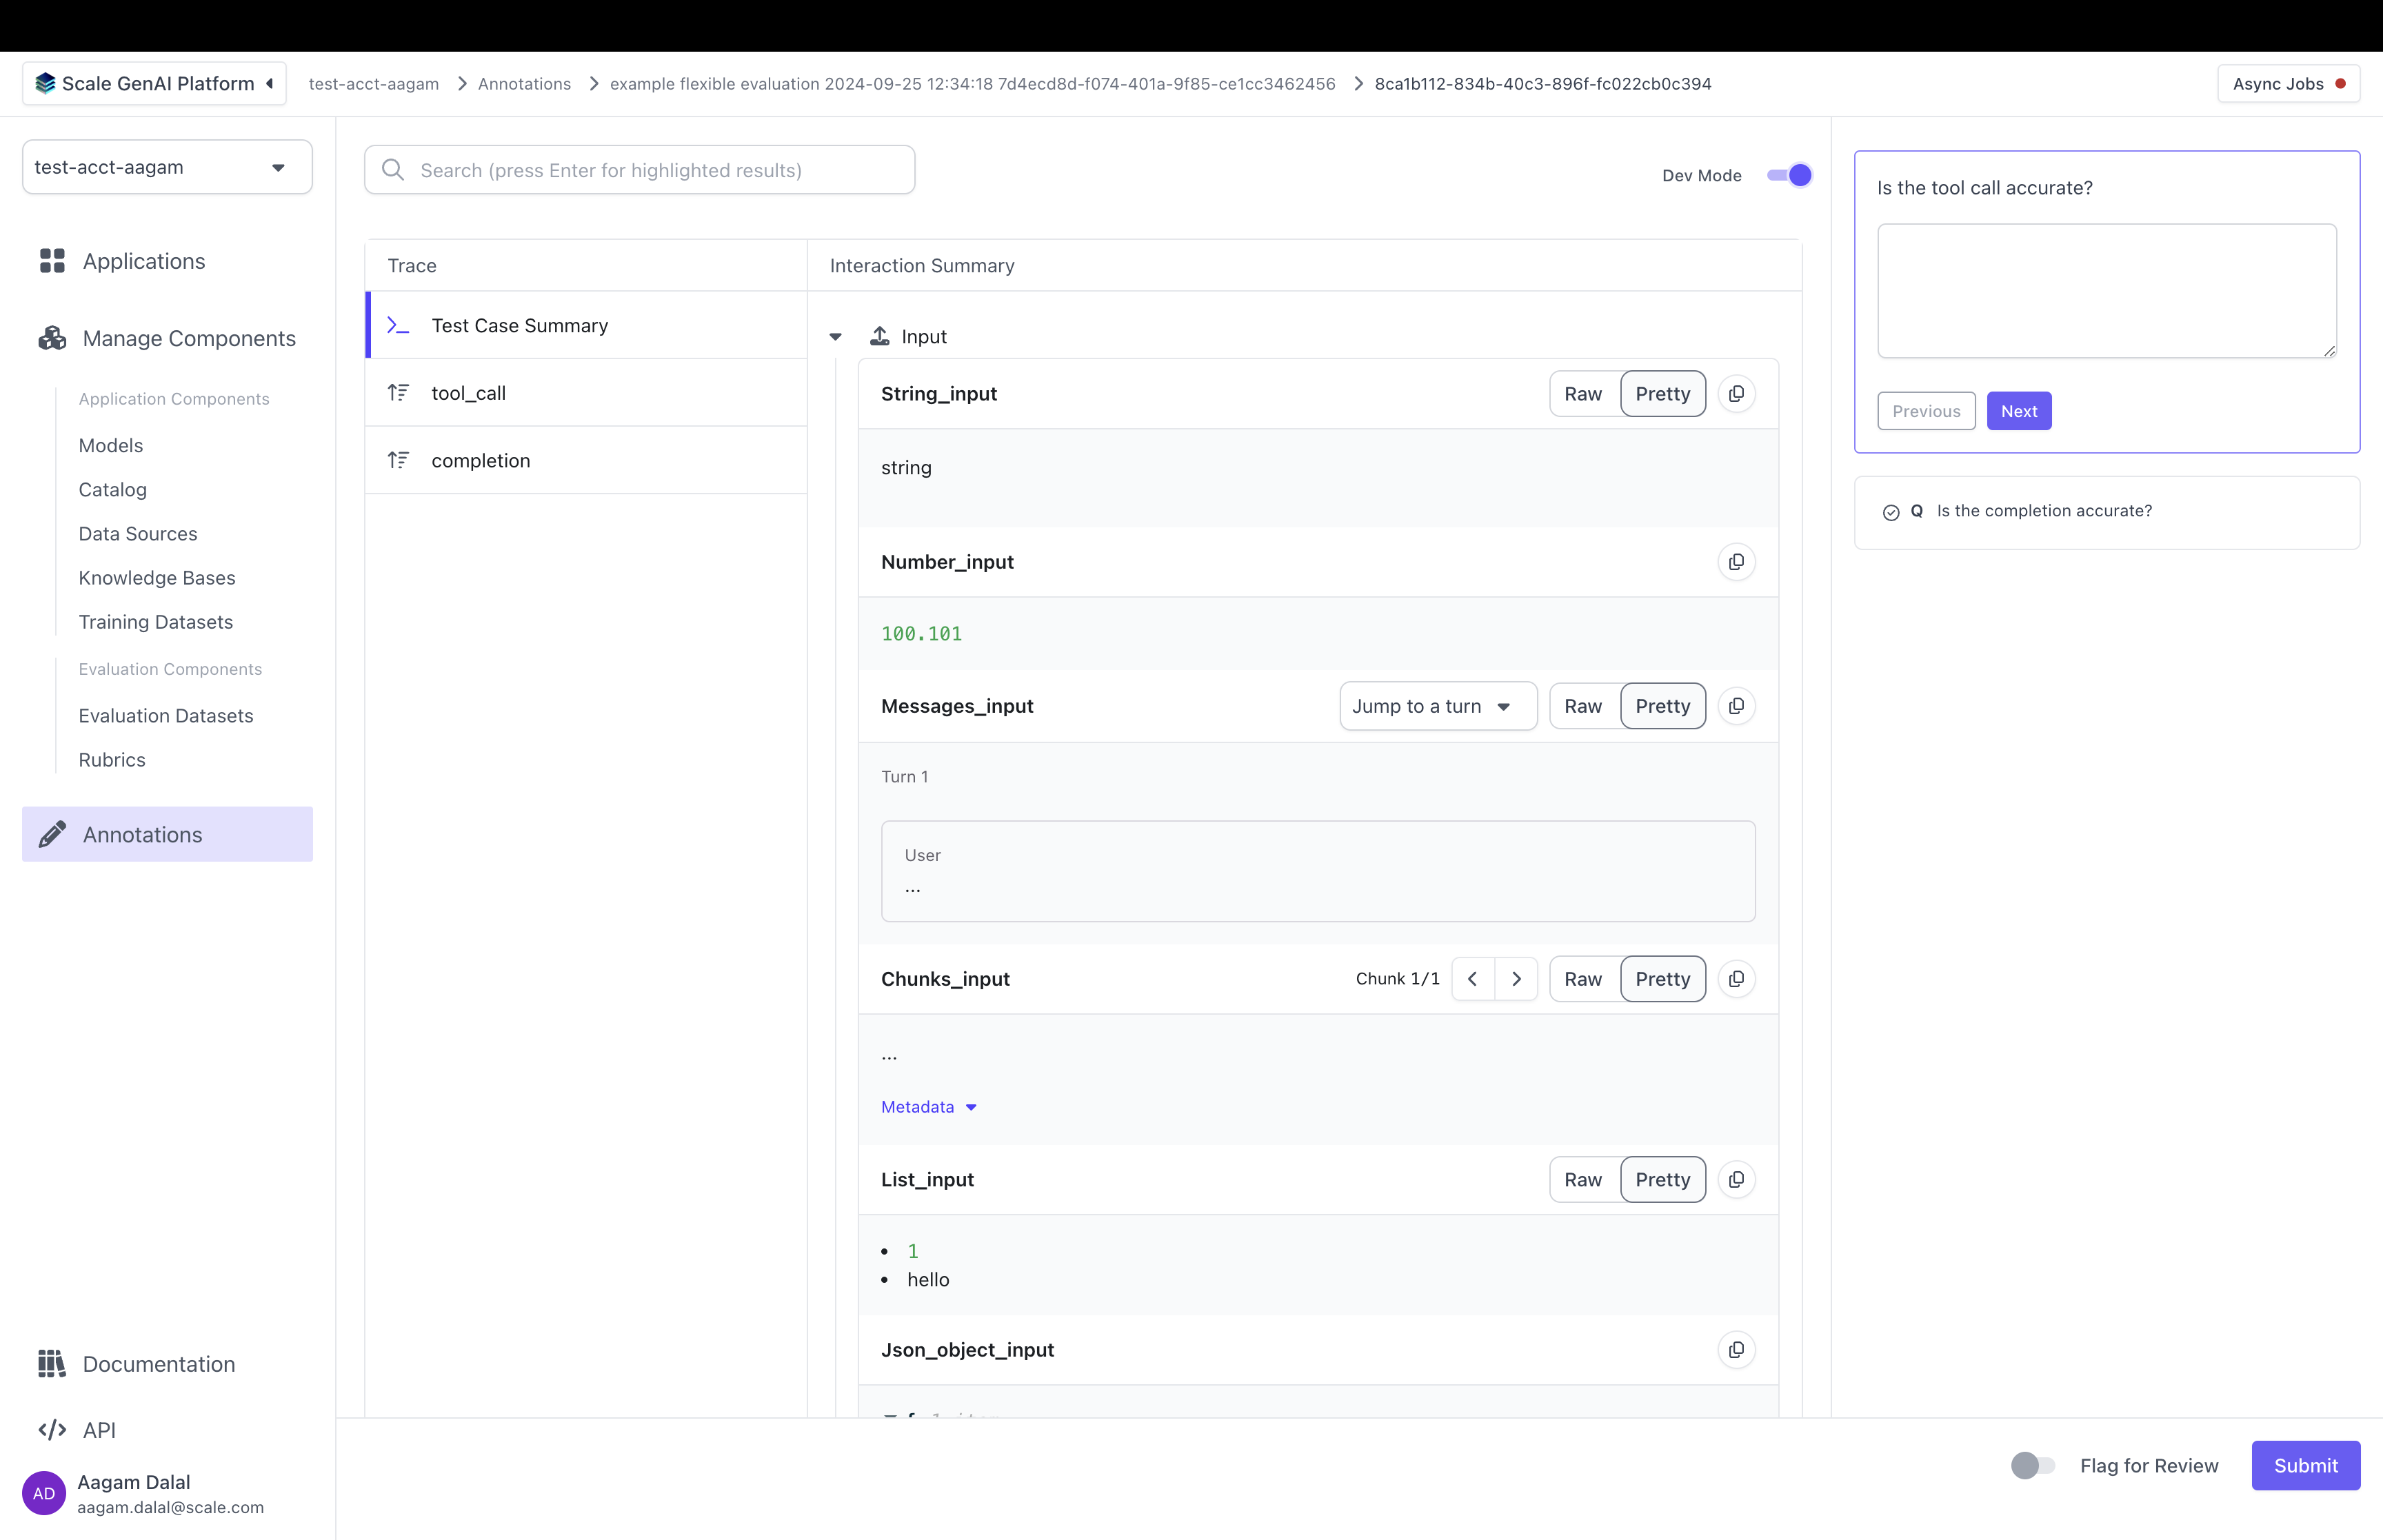
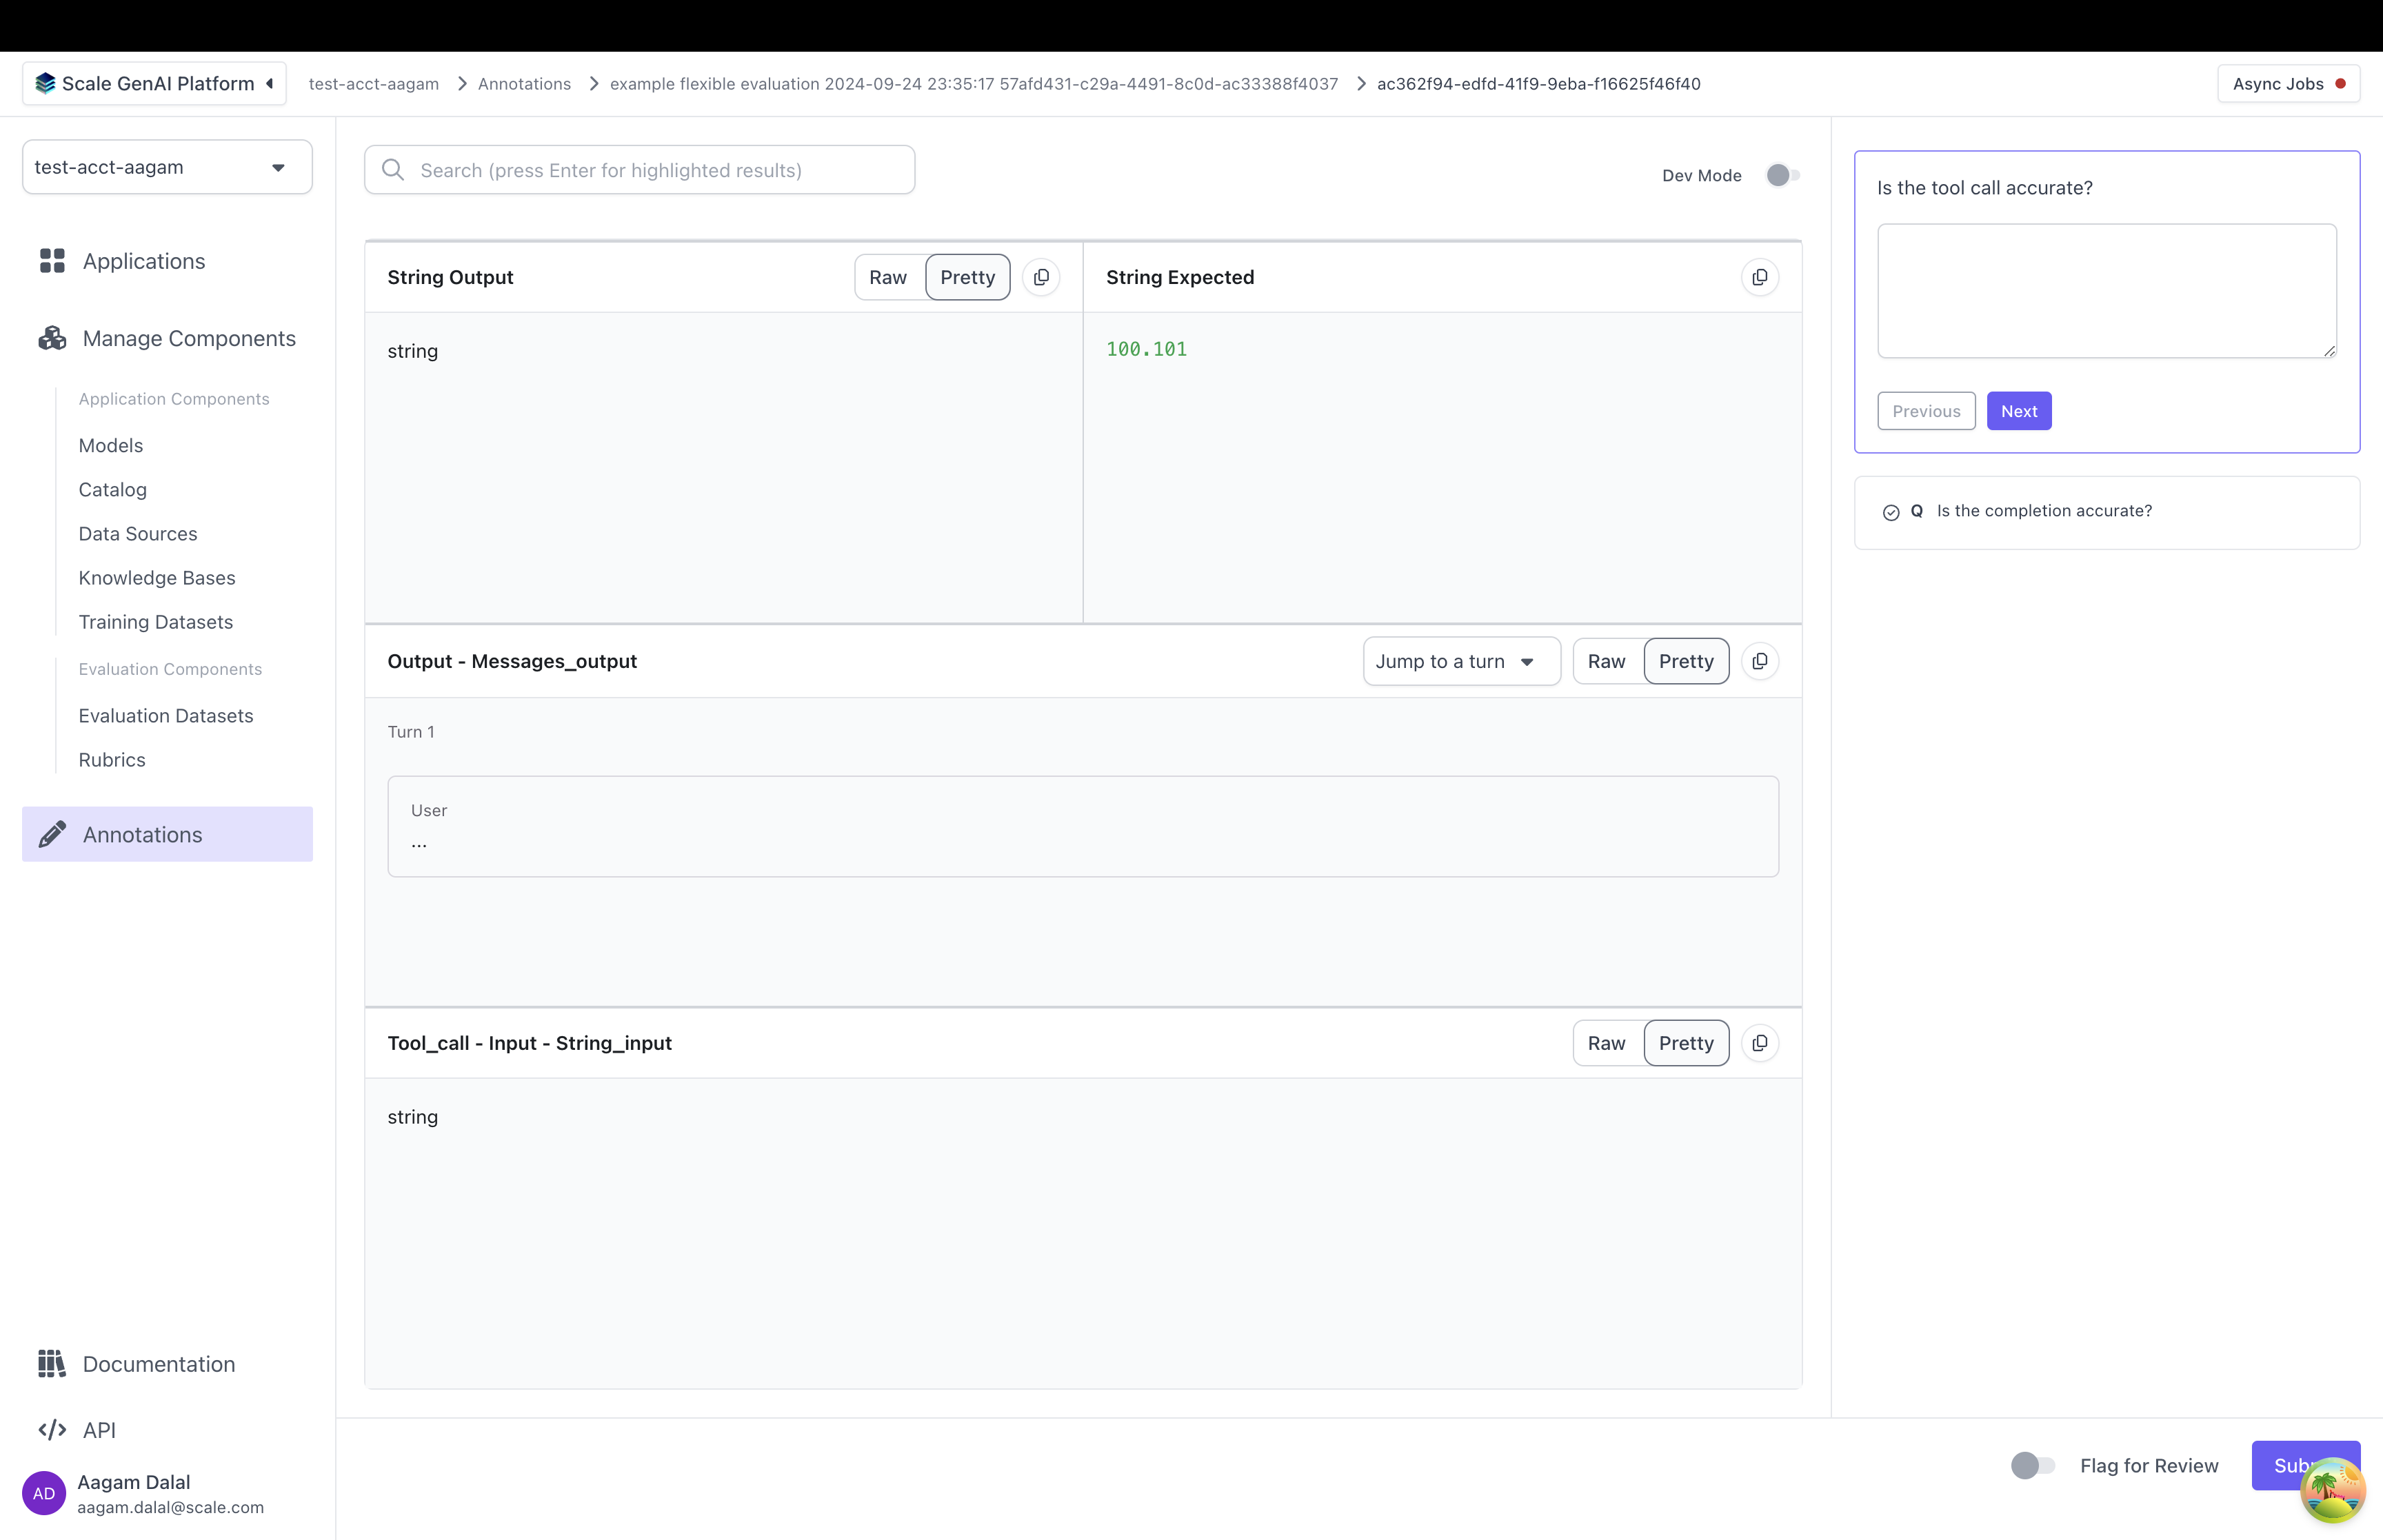
Dev Mode
SGP also supports “Dev Mode” which allows an annotator to view all the inputs, outputs and the full trace all at once. You can toggle Dev Mode by clicking on the top right in the annotation UI: