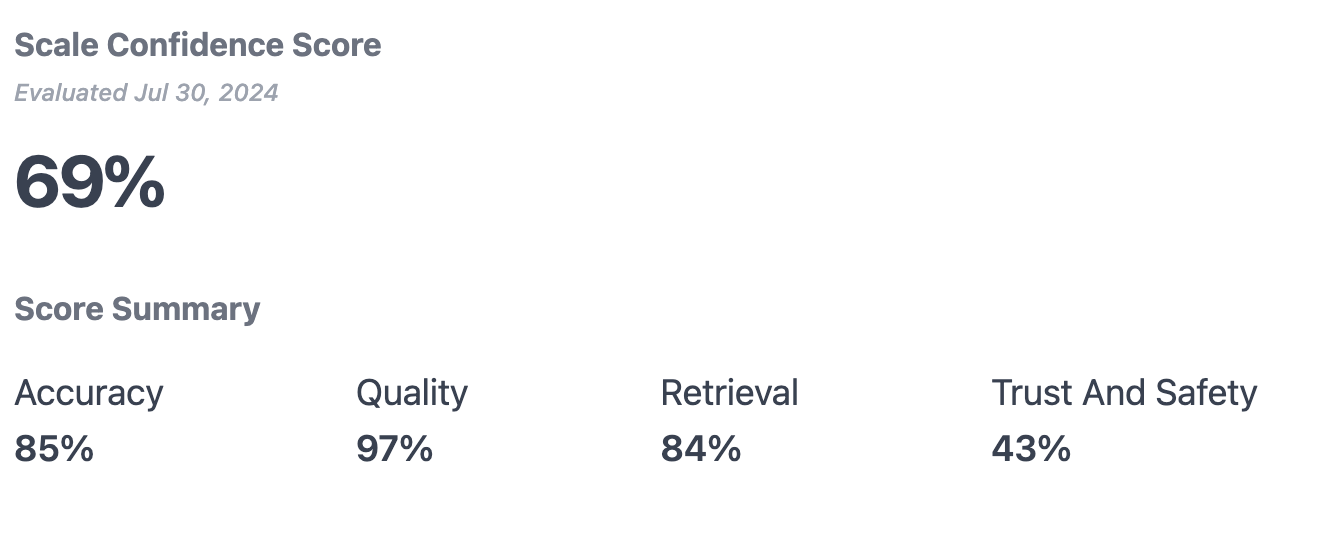
- Accuracy - How close your application gets to a correct answer that addresses the user’s prompt
- Retrieval (only for applications using RAG) - How well does your retrieval system produce content that is relevant, and how well does your application use that content to deliver a response?
- Quality - Does your application produce outputs that are professional?
- Safety - Is your application liable to producing harmful or offensive content on standard or adversarial inputs?
- Answer correctness: How close outputs are to ground truths
- Answer relevance: How well outputs address the user’s query
- Faithfulness: How much output content is attributed to the context
- Context recall: How much of the ground truth is in the retrieved context
- Grammar: How grammatically correct the output is
- Coherence: How well the statements flow together
- Safety: Whether outputs are harmful on adversarial inputs
- Moderation: Whether outputs are harmful on the evaluation dataset
- An application that received a 10 on one category, but 100s for all others would receive a confidence score of 52
- An application that received 80s for all categories, would receive a scale of 87
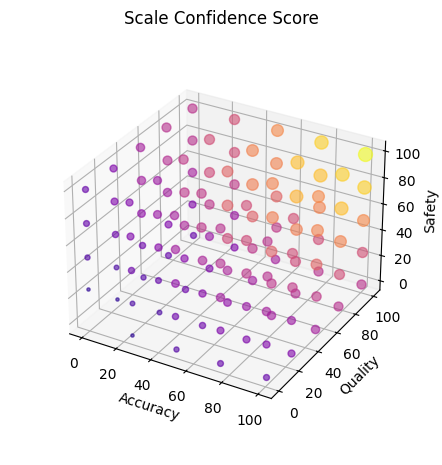
Overall scale confidence score plotted against different category score combinations (3 out of 4 category scores were chosen for visualization purposes)