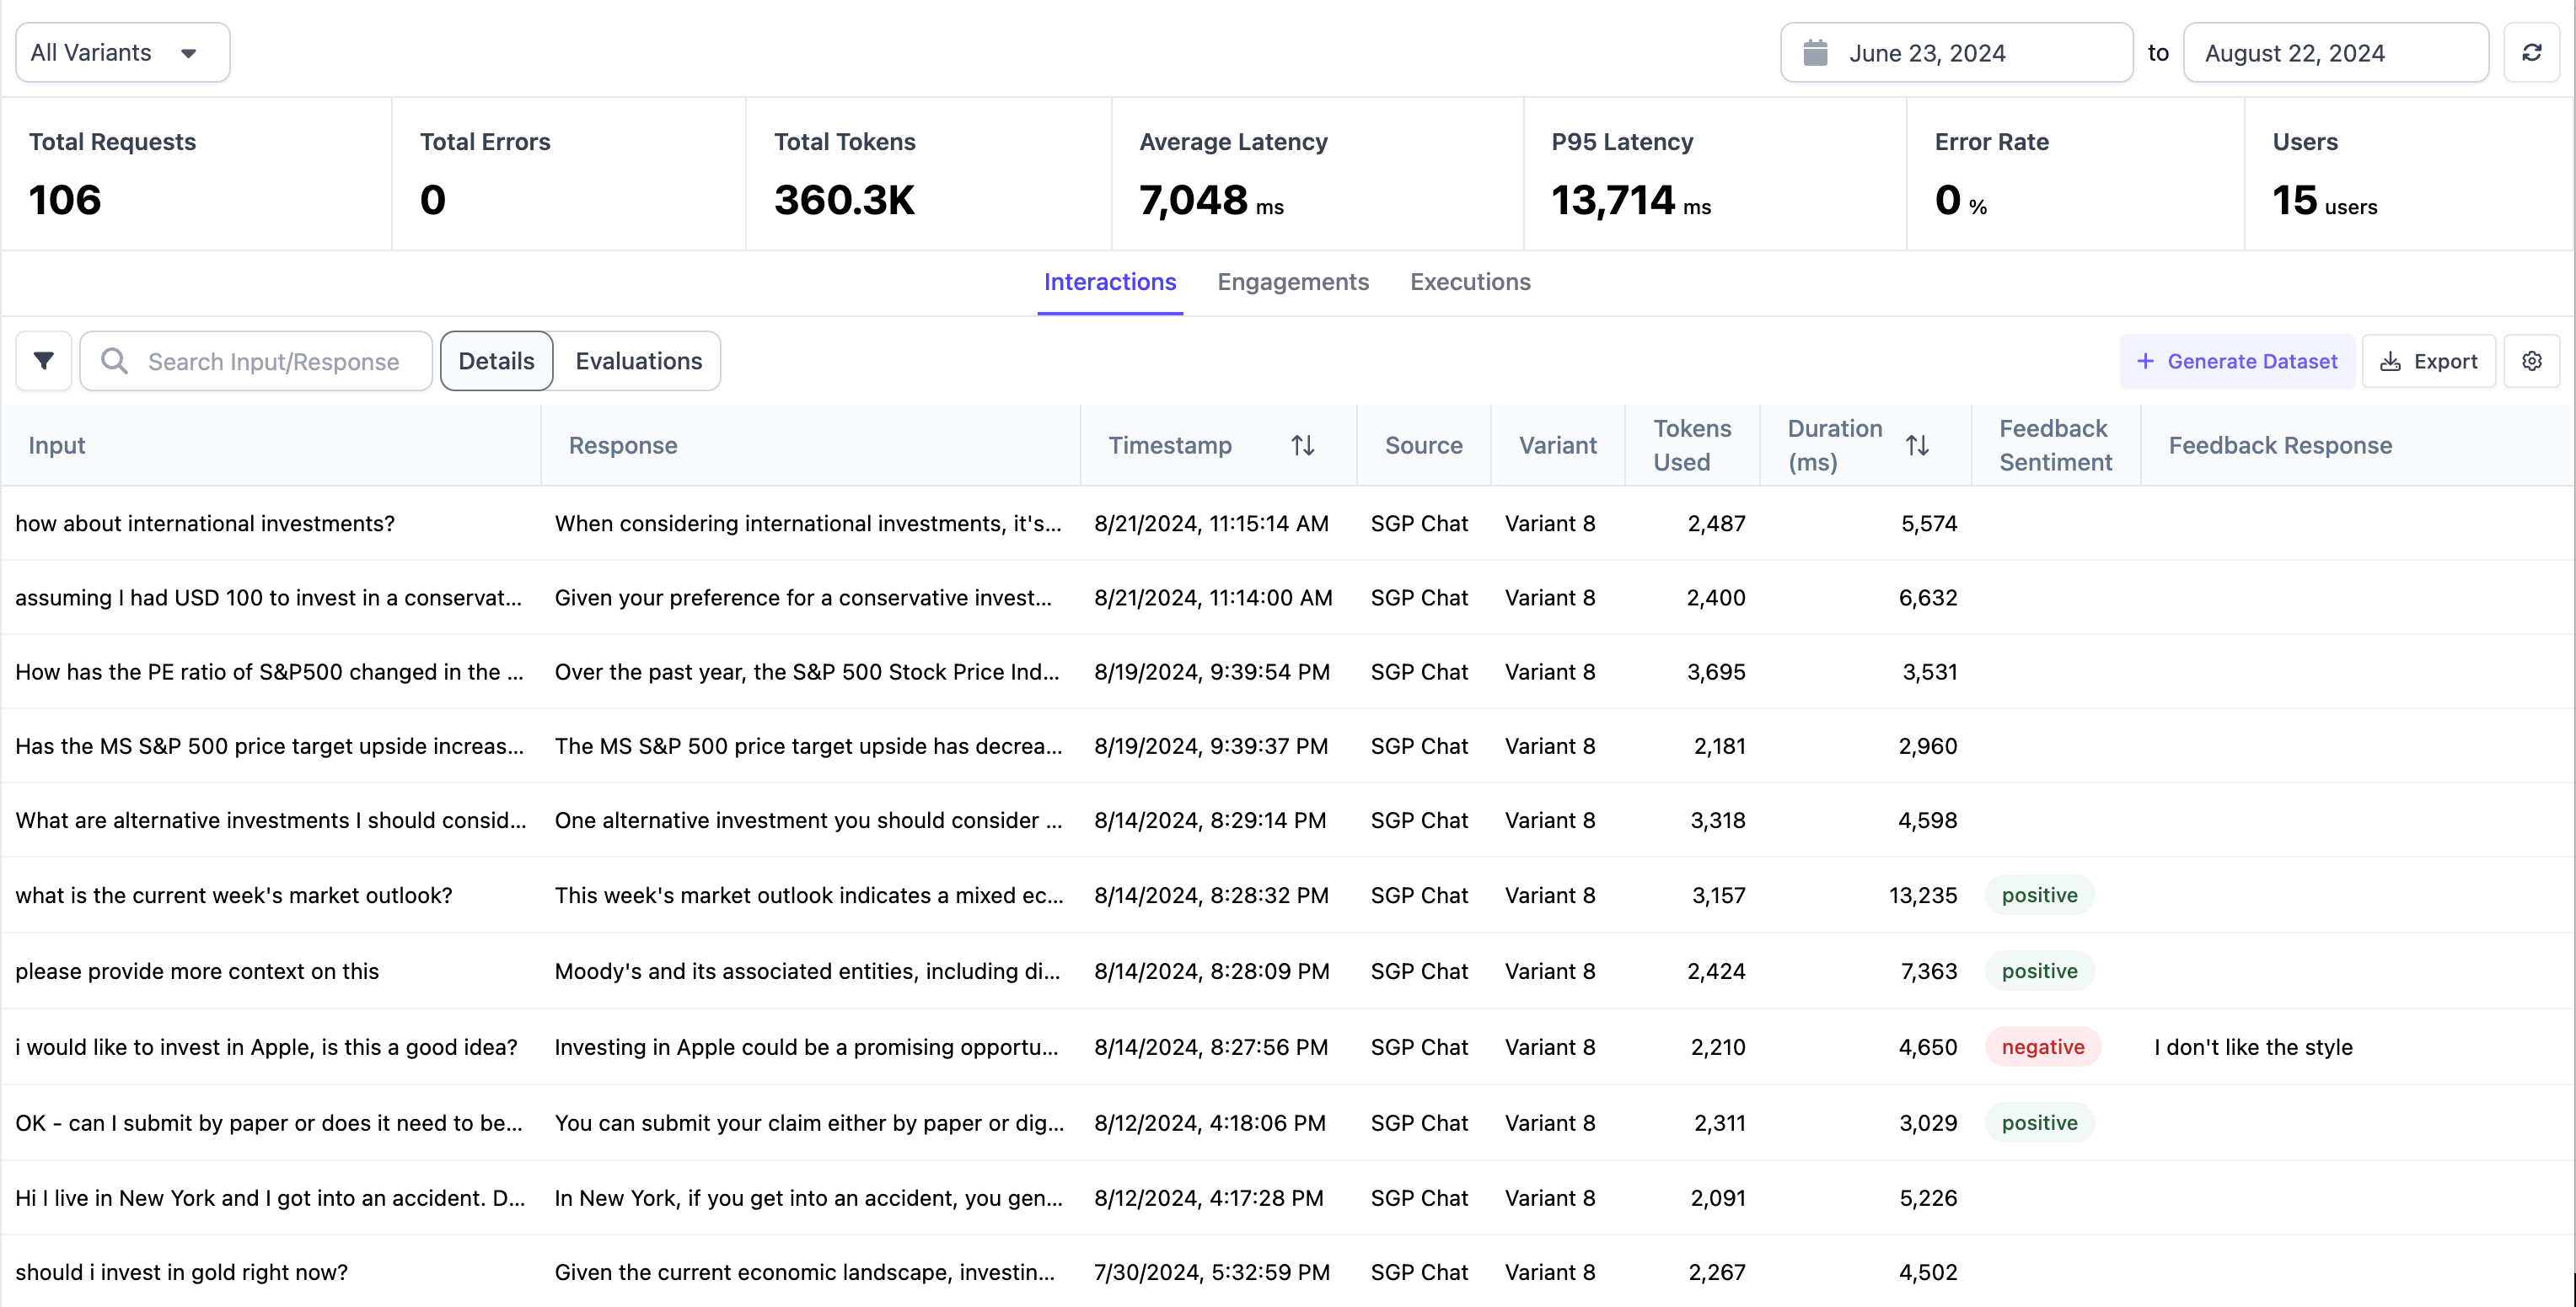
Interactions
Engagements
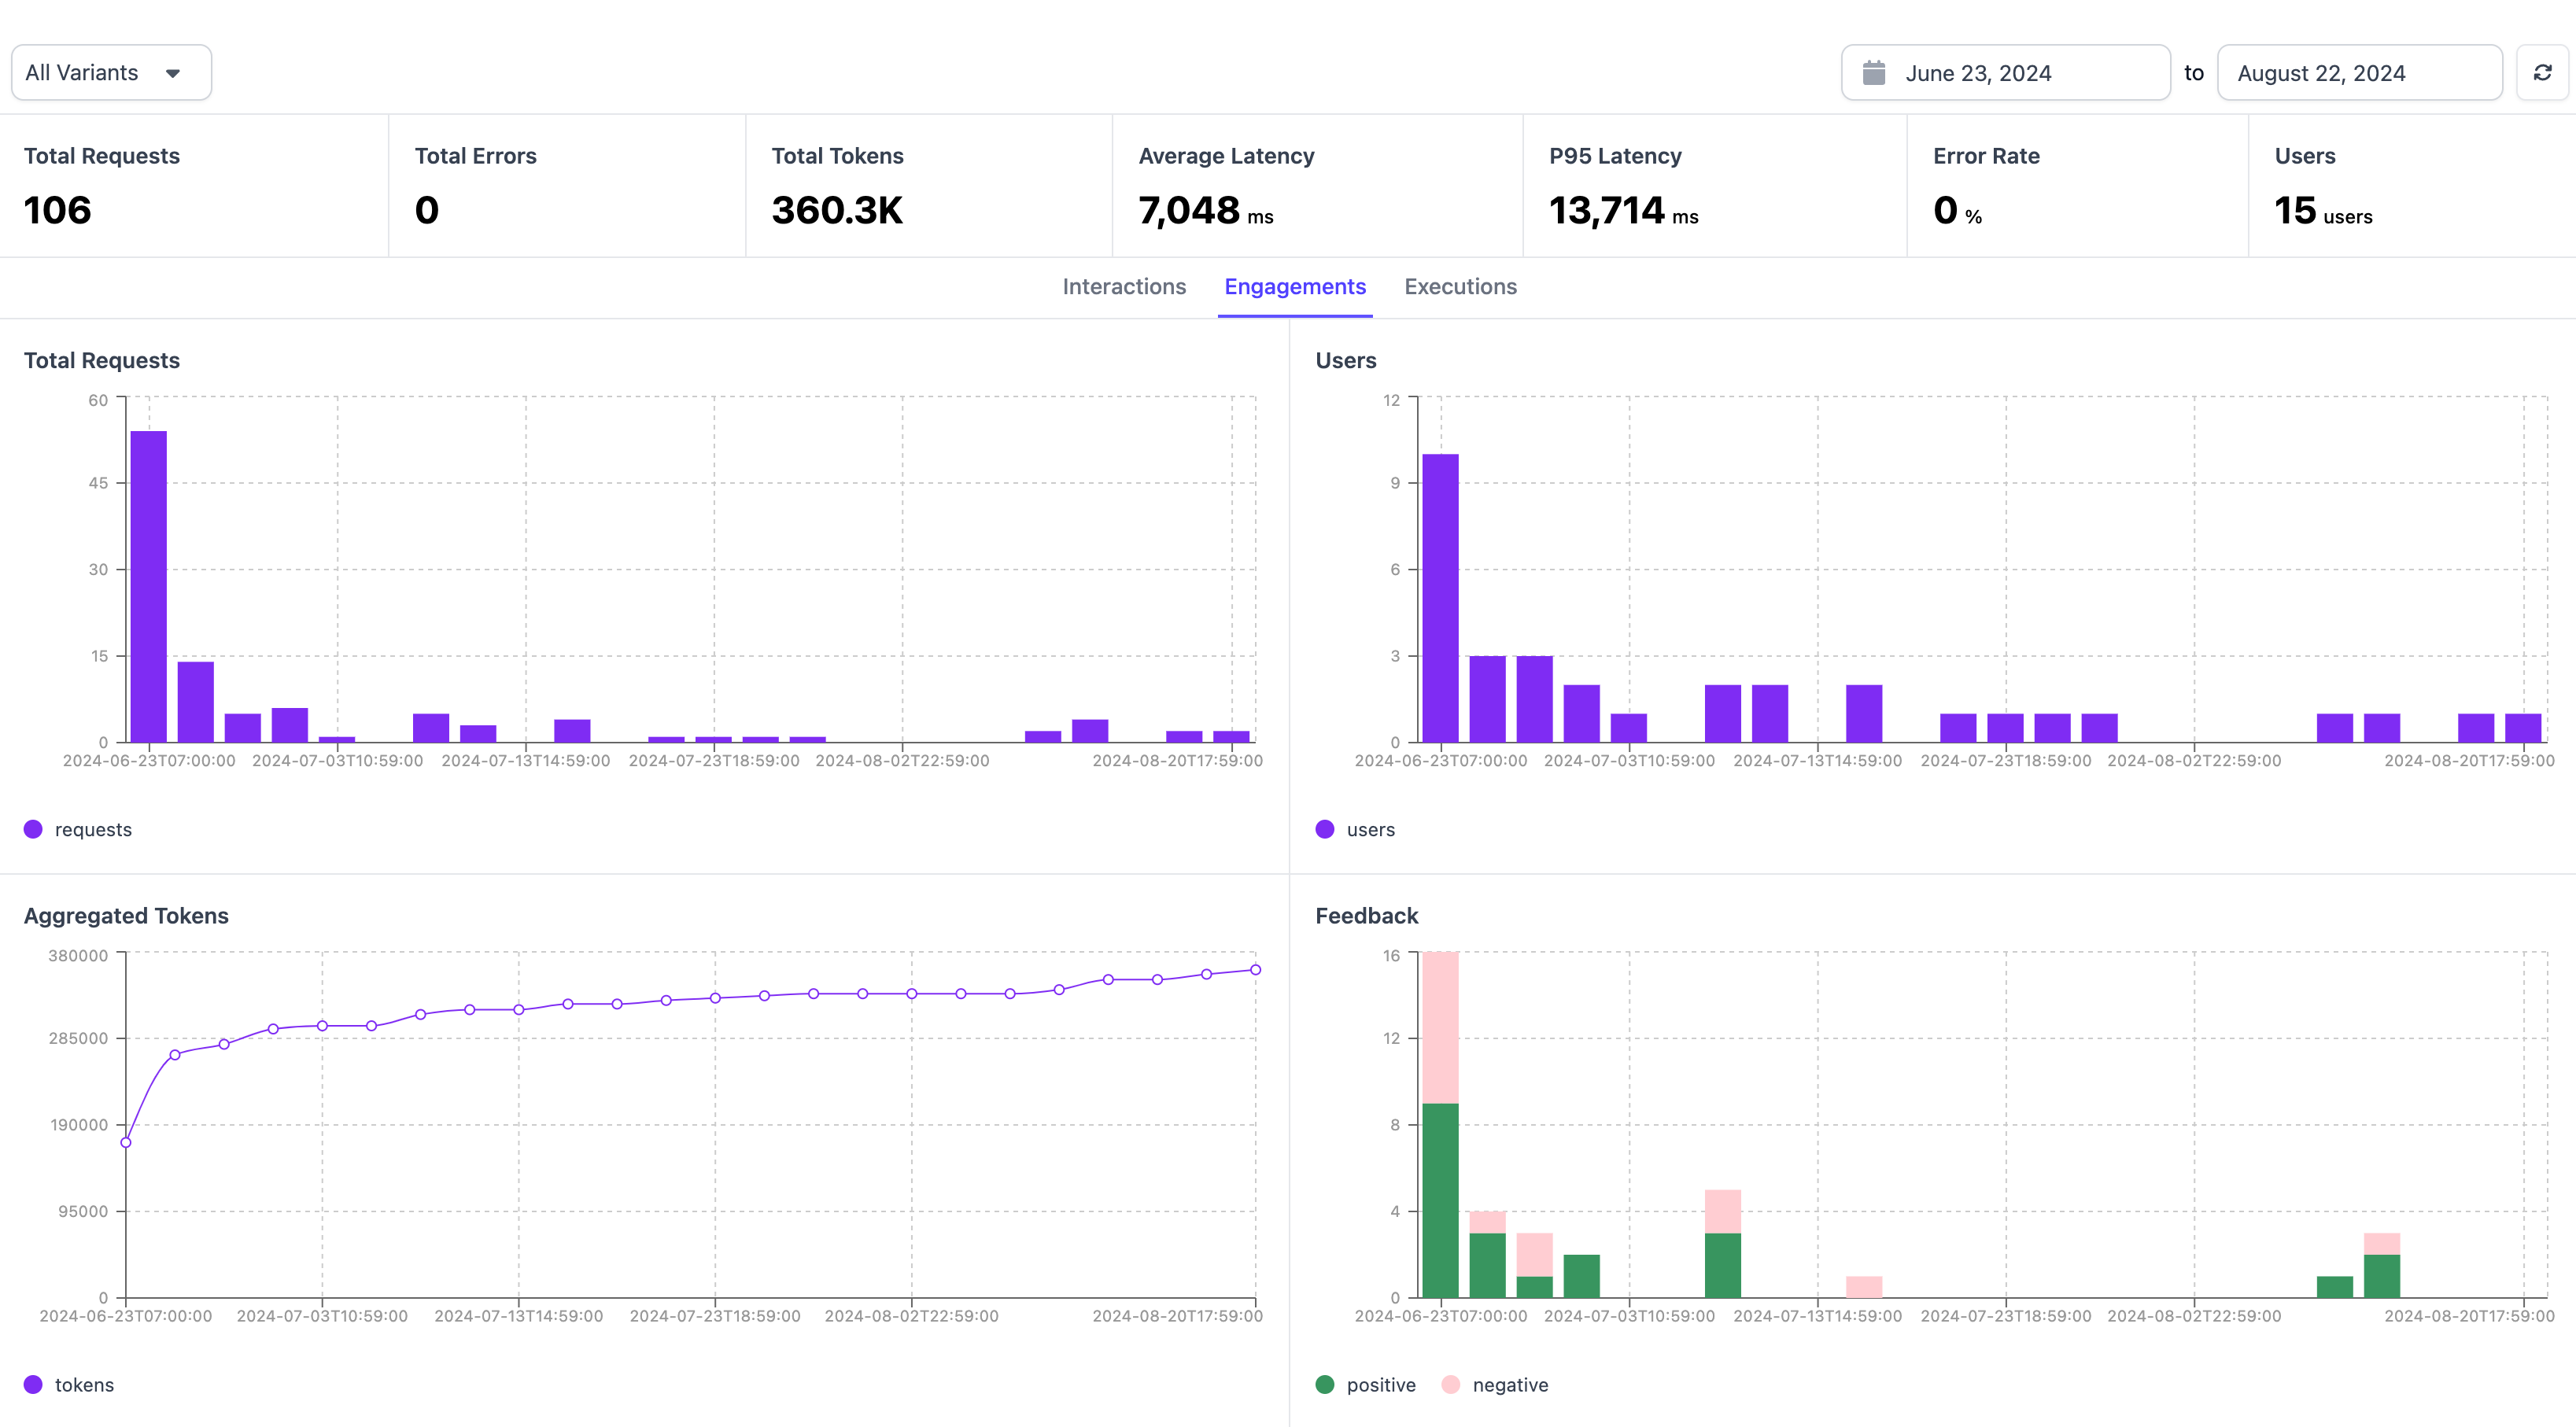
- Total Requests: These are the total number of messages sent by users of your chatbot in the given timeframe
- Users: These are the total number of unique users in the given timeframe
- Aggregated Tokens: This is the total number of tokens (both input and output) utilized by your application in the given timeframe
- Feedback: This summarizes the positive and negative feedback from users using the chatbot (Thumbs up vs Thumbs down)
Executions
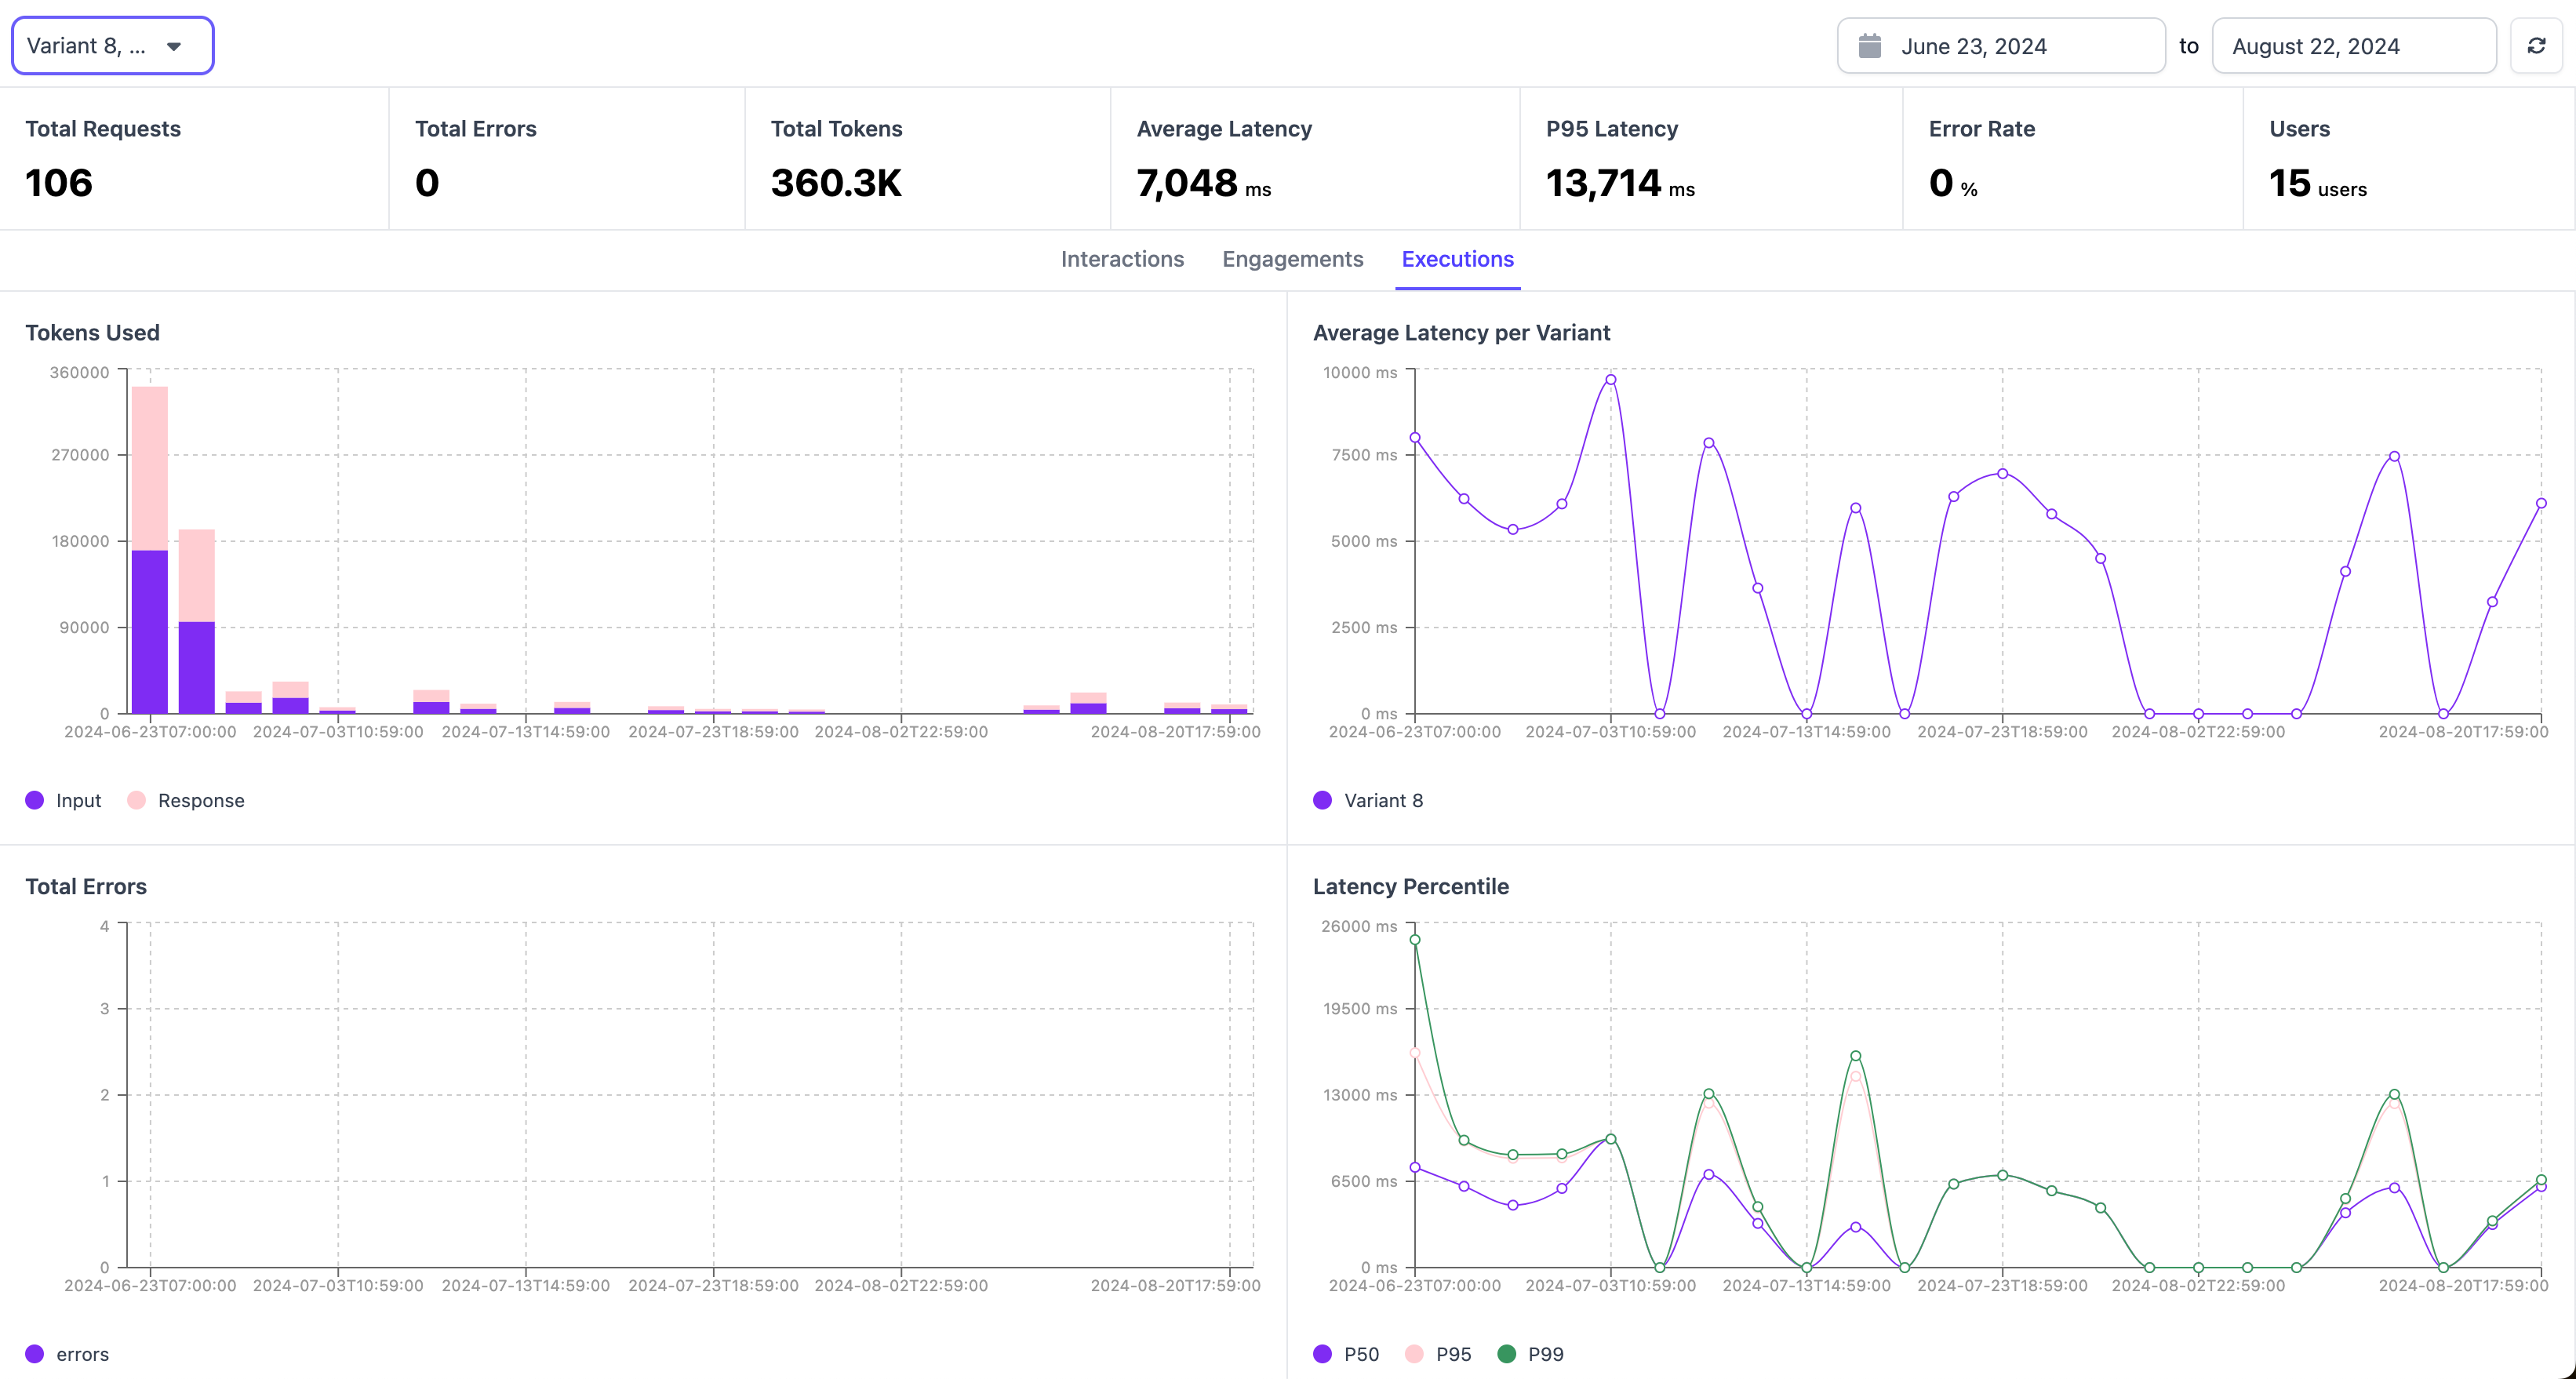
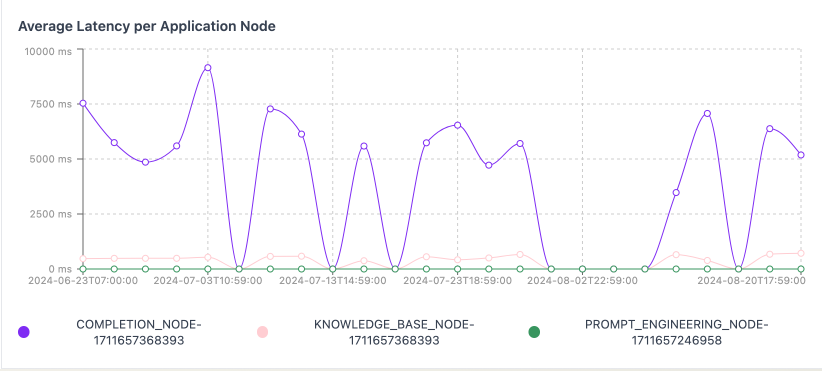
Latency Per Node
For a specific variant, you can also see the average latency for each node in that application.