Applications (Home)
Applications are the central data structure in SGP. Users can create applications and application variants (a specific configuration) which can be either native to SGP or built entirely outside the platform. The applications home page lists all applications that are currently available in the given account. From here, users can also create new applications.Application Overview Page Functions
The application page provides an overview of the contents of a given application and helps the user navigate all the key functions available for an app. An application can best be defined as a namespace for the GenAI use case you are currently working on.List Variants
The primary content of the application page is a list of available application variants. A variant can be understood as a named, specific configuration of an application. If one of your application variants is deployed, this variant will be highlighted in a big box above the other variants, featuring Report Card and Monitoring details. All other variants are listed below.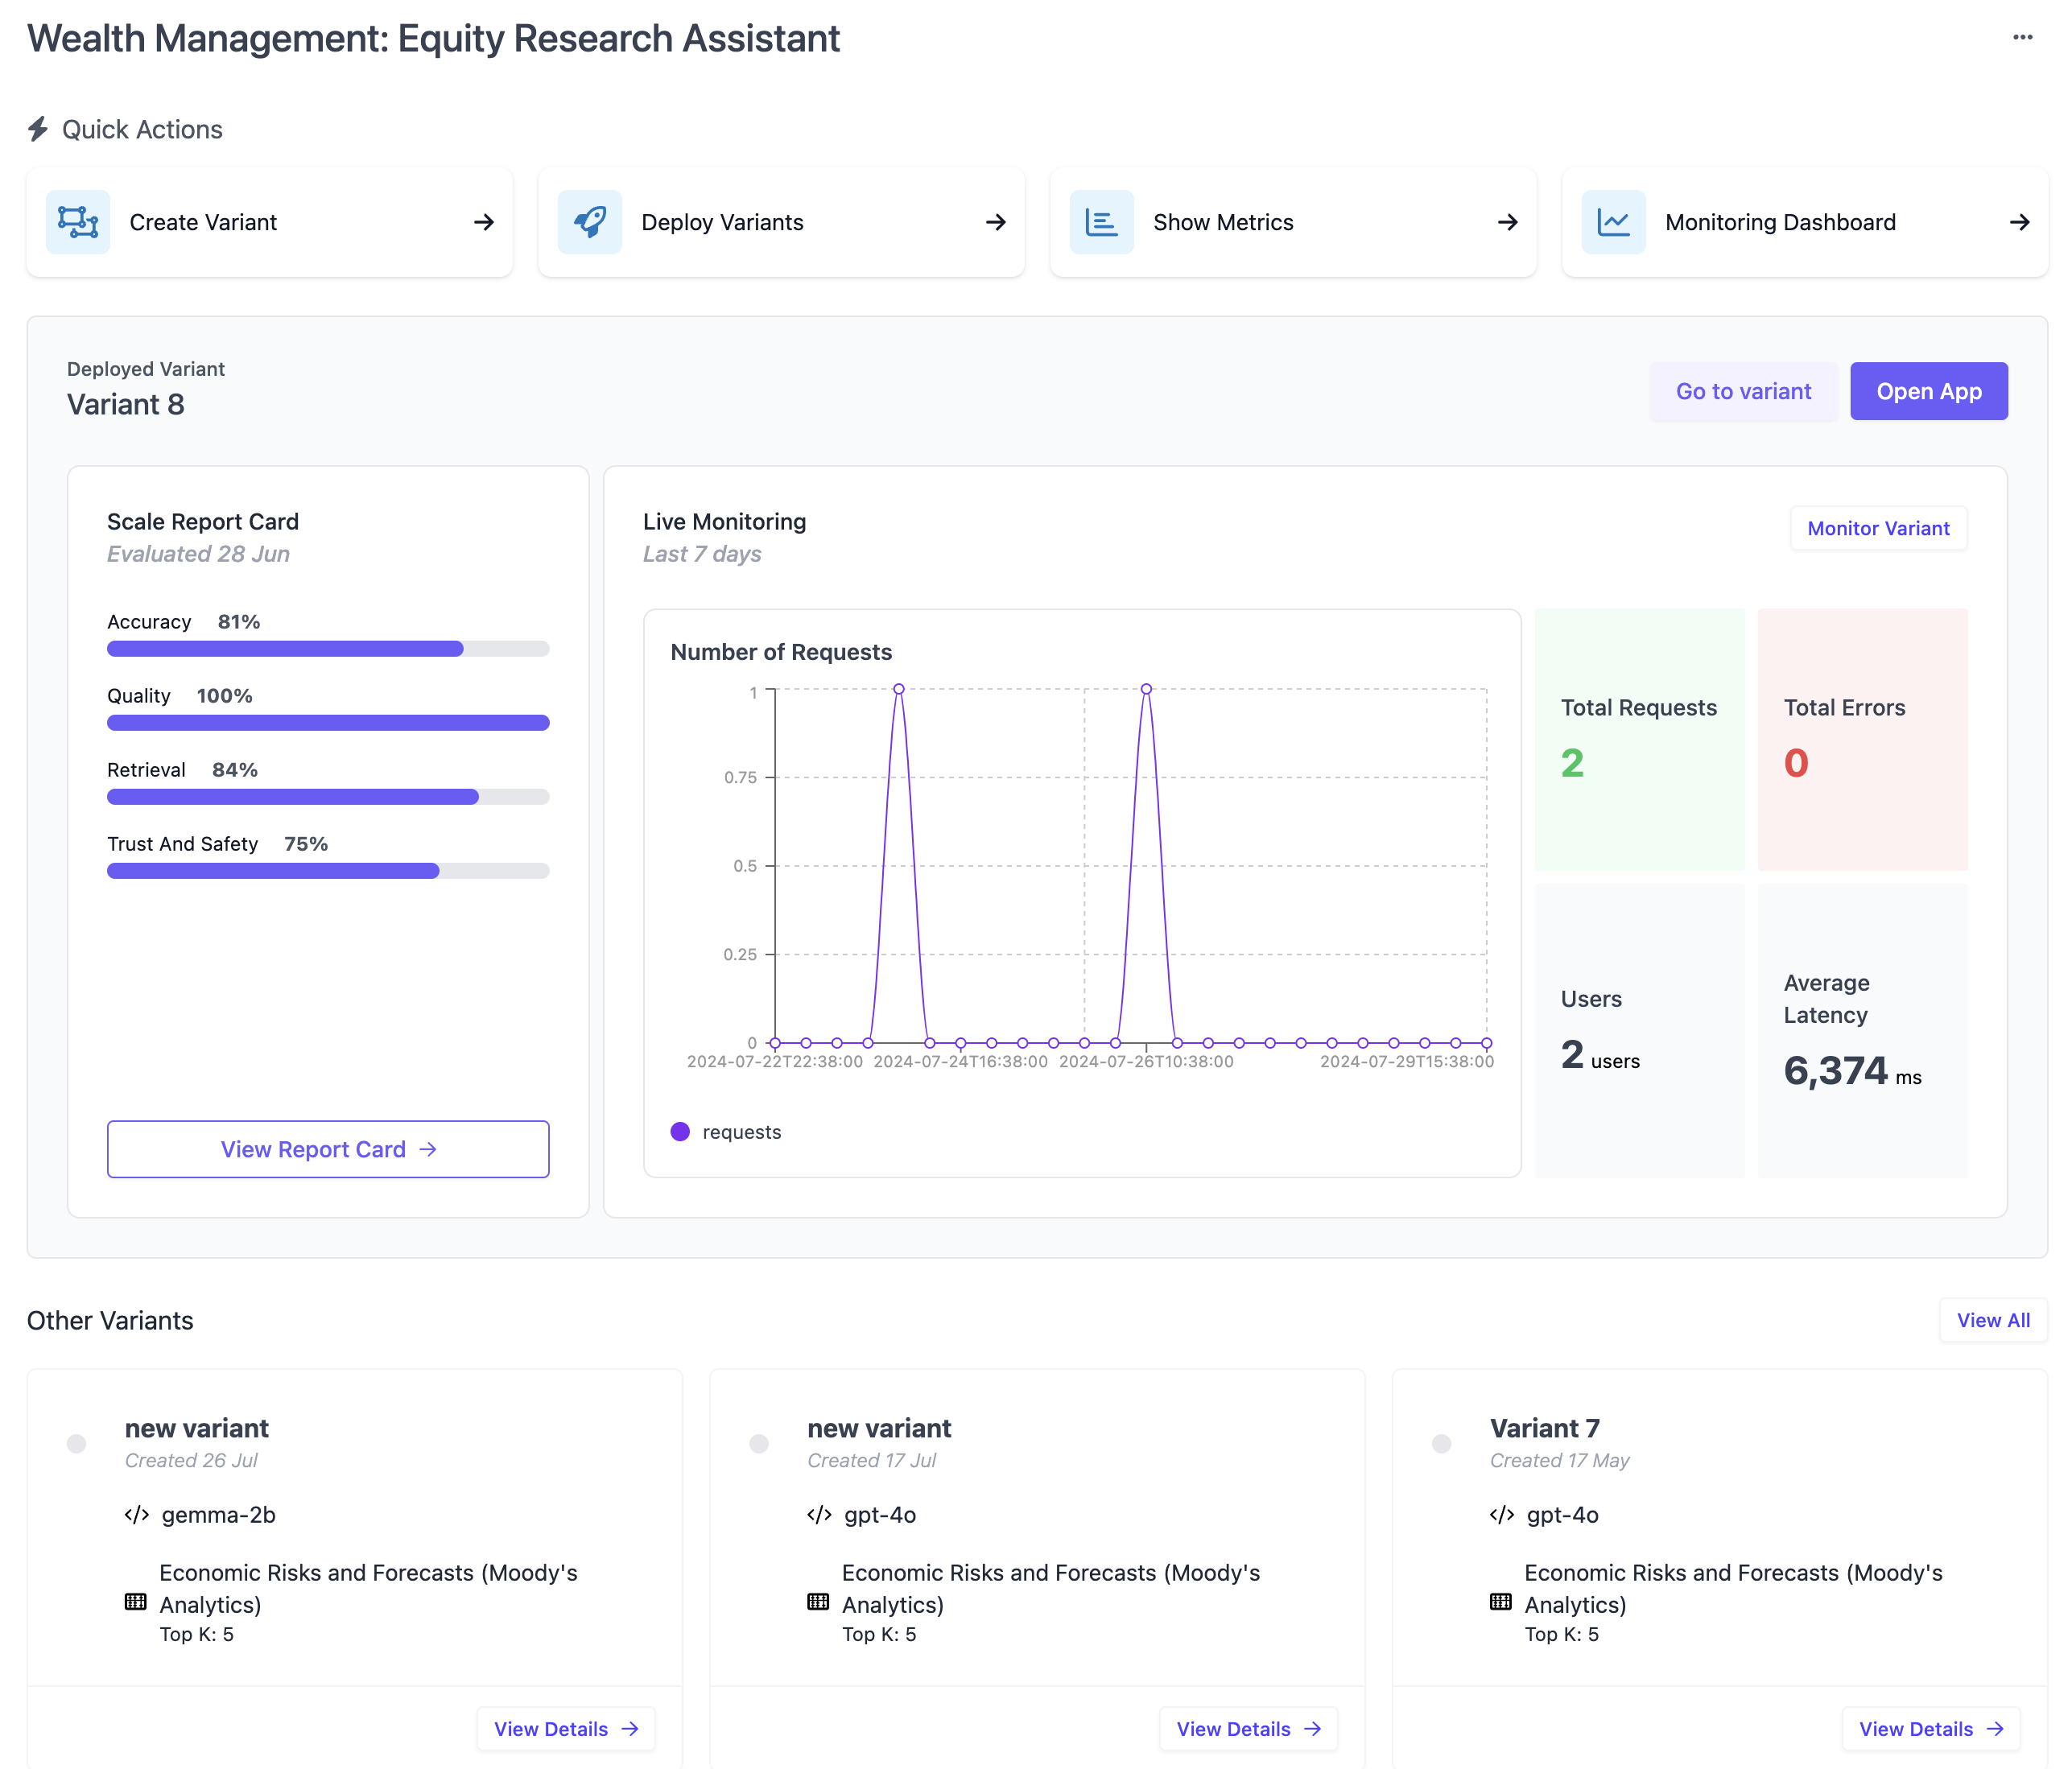
Evaluation Runs
Below the list of variants is a list of evaluation runs that have been created for this application. While each evaluation run is tied to a variant, this table will list all runs across all variants.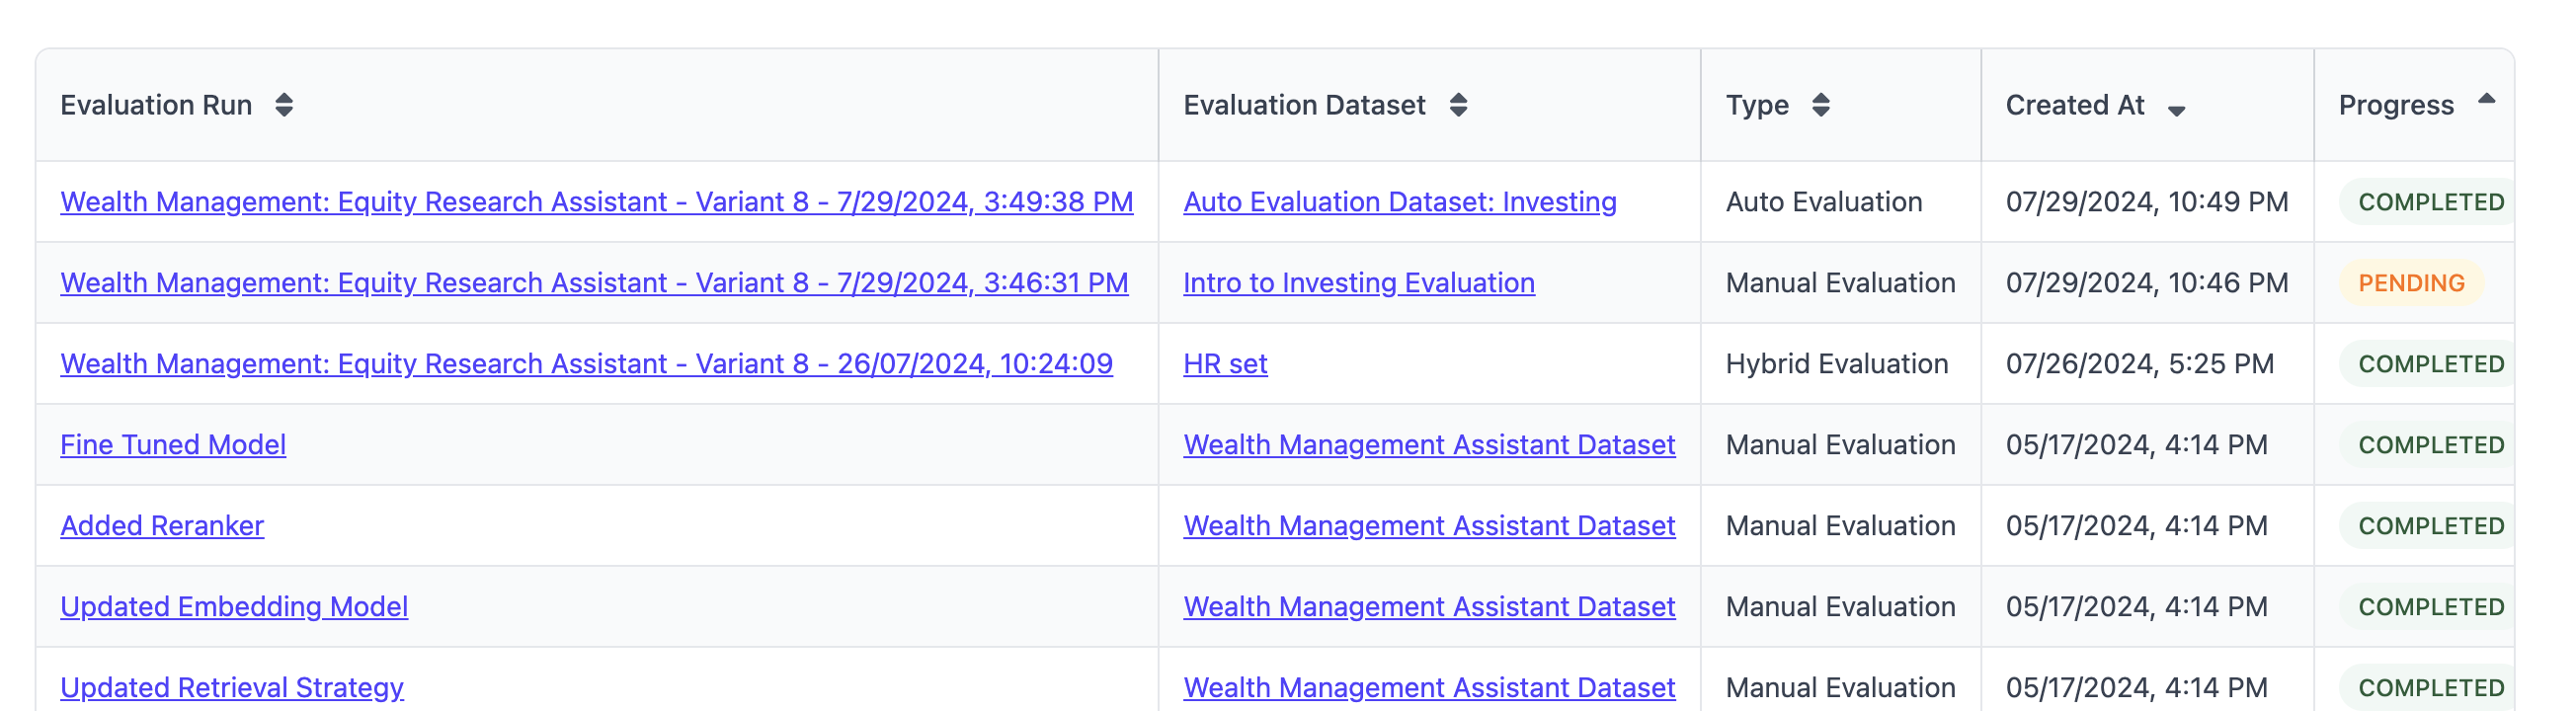
Manage Deployments
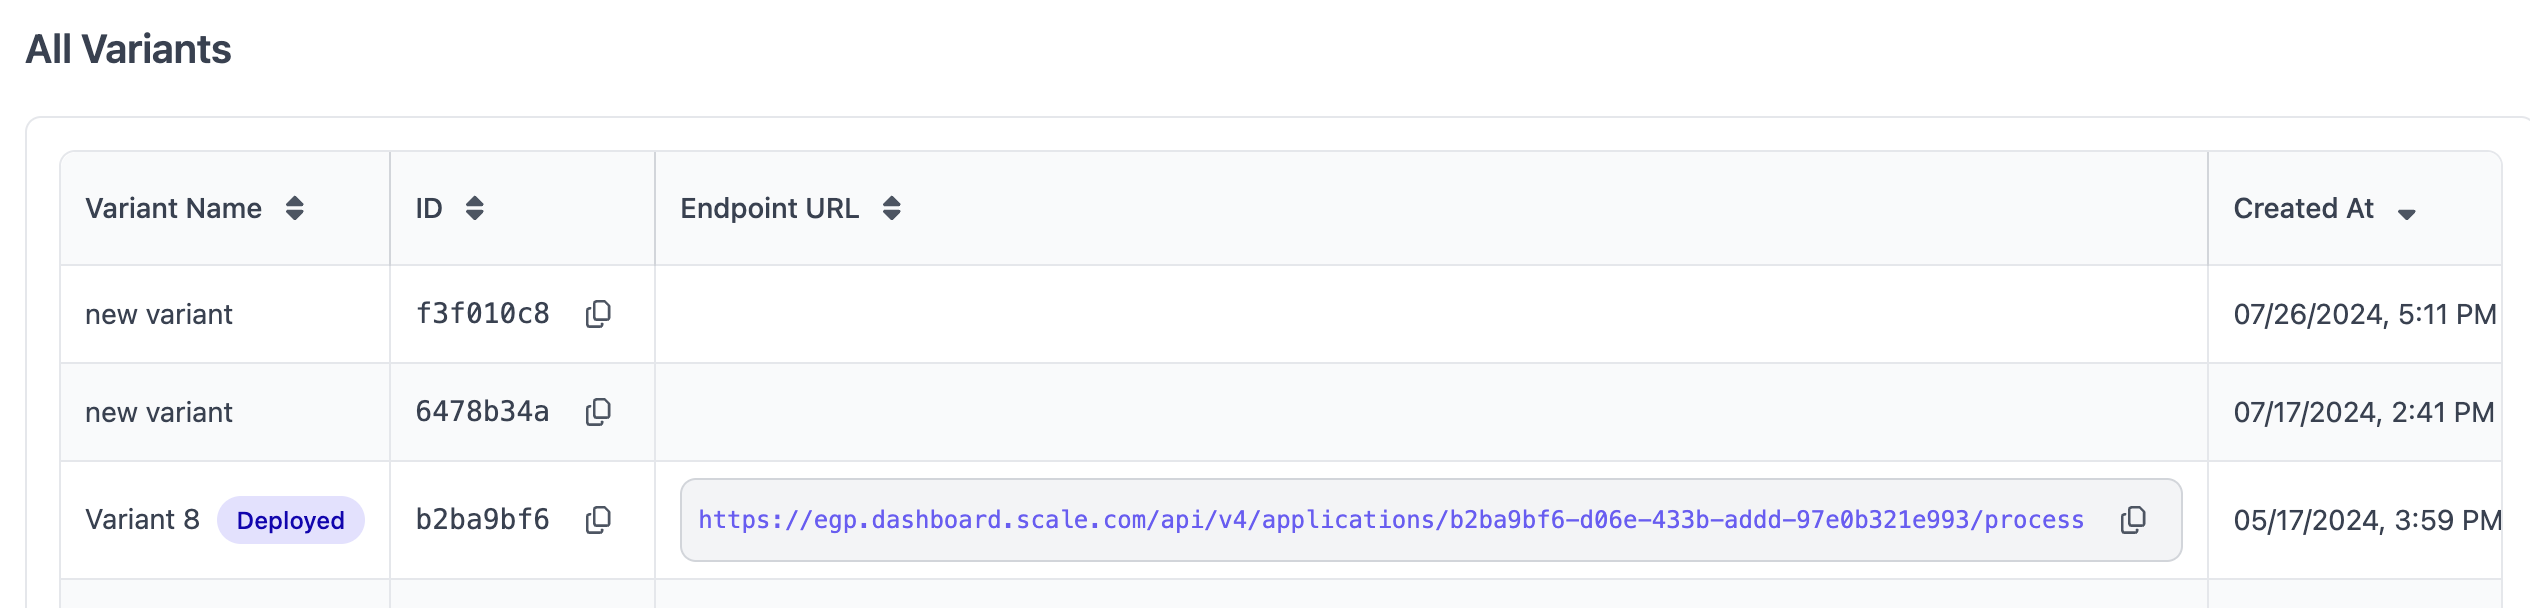
Clicking onto “Deploy Variants” in the quick actions opens a page enabling you to manage which variant(s) should be deployed. In the box at the top, you can pick a variant and deploy it, including a simple web UI to interact with the endpoint. If you have not yet deployed a variant, you will need to pick a unique slug (URL) for your application, which users can use to access the web app. You can reach the chat application by clicking on “View App.”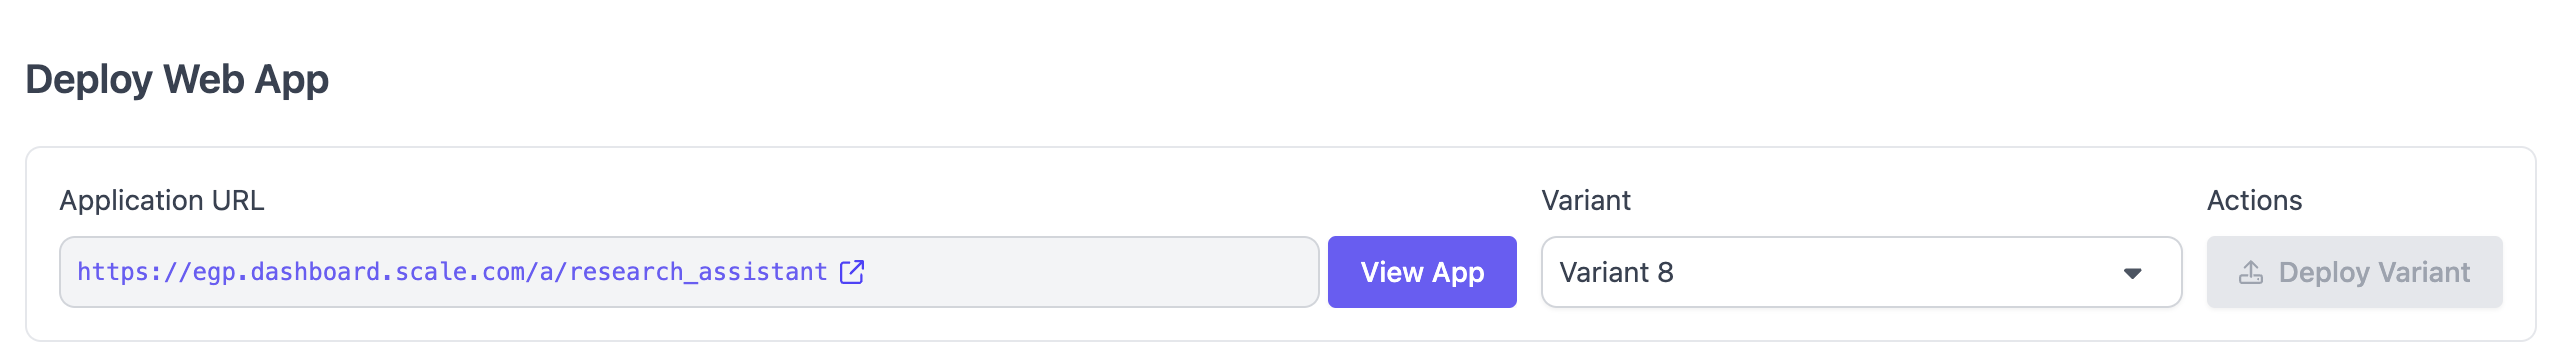
Show Metrics
Clicking “Show Metrics” from the quick actions leads to a page showing a graphical aggregation of all evaluation runs that have been completed for this application. This view can be used to easily understand how an application’s performance is improving over time with each iteration/variant. The view is broken down by evaluation rubric and allows for flexible filtering and sorting.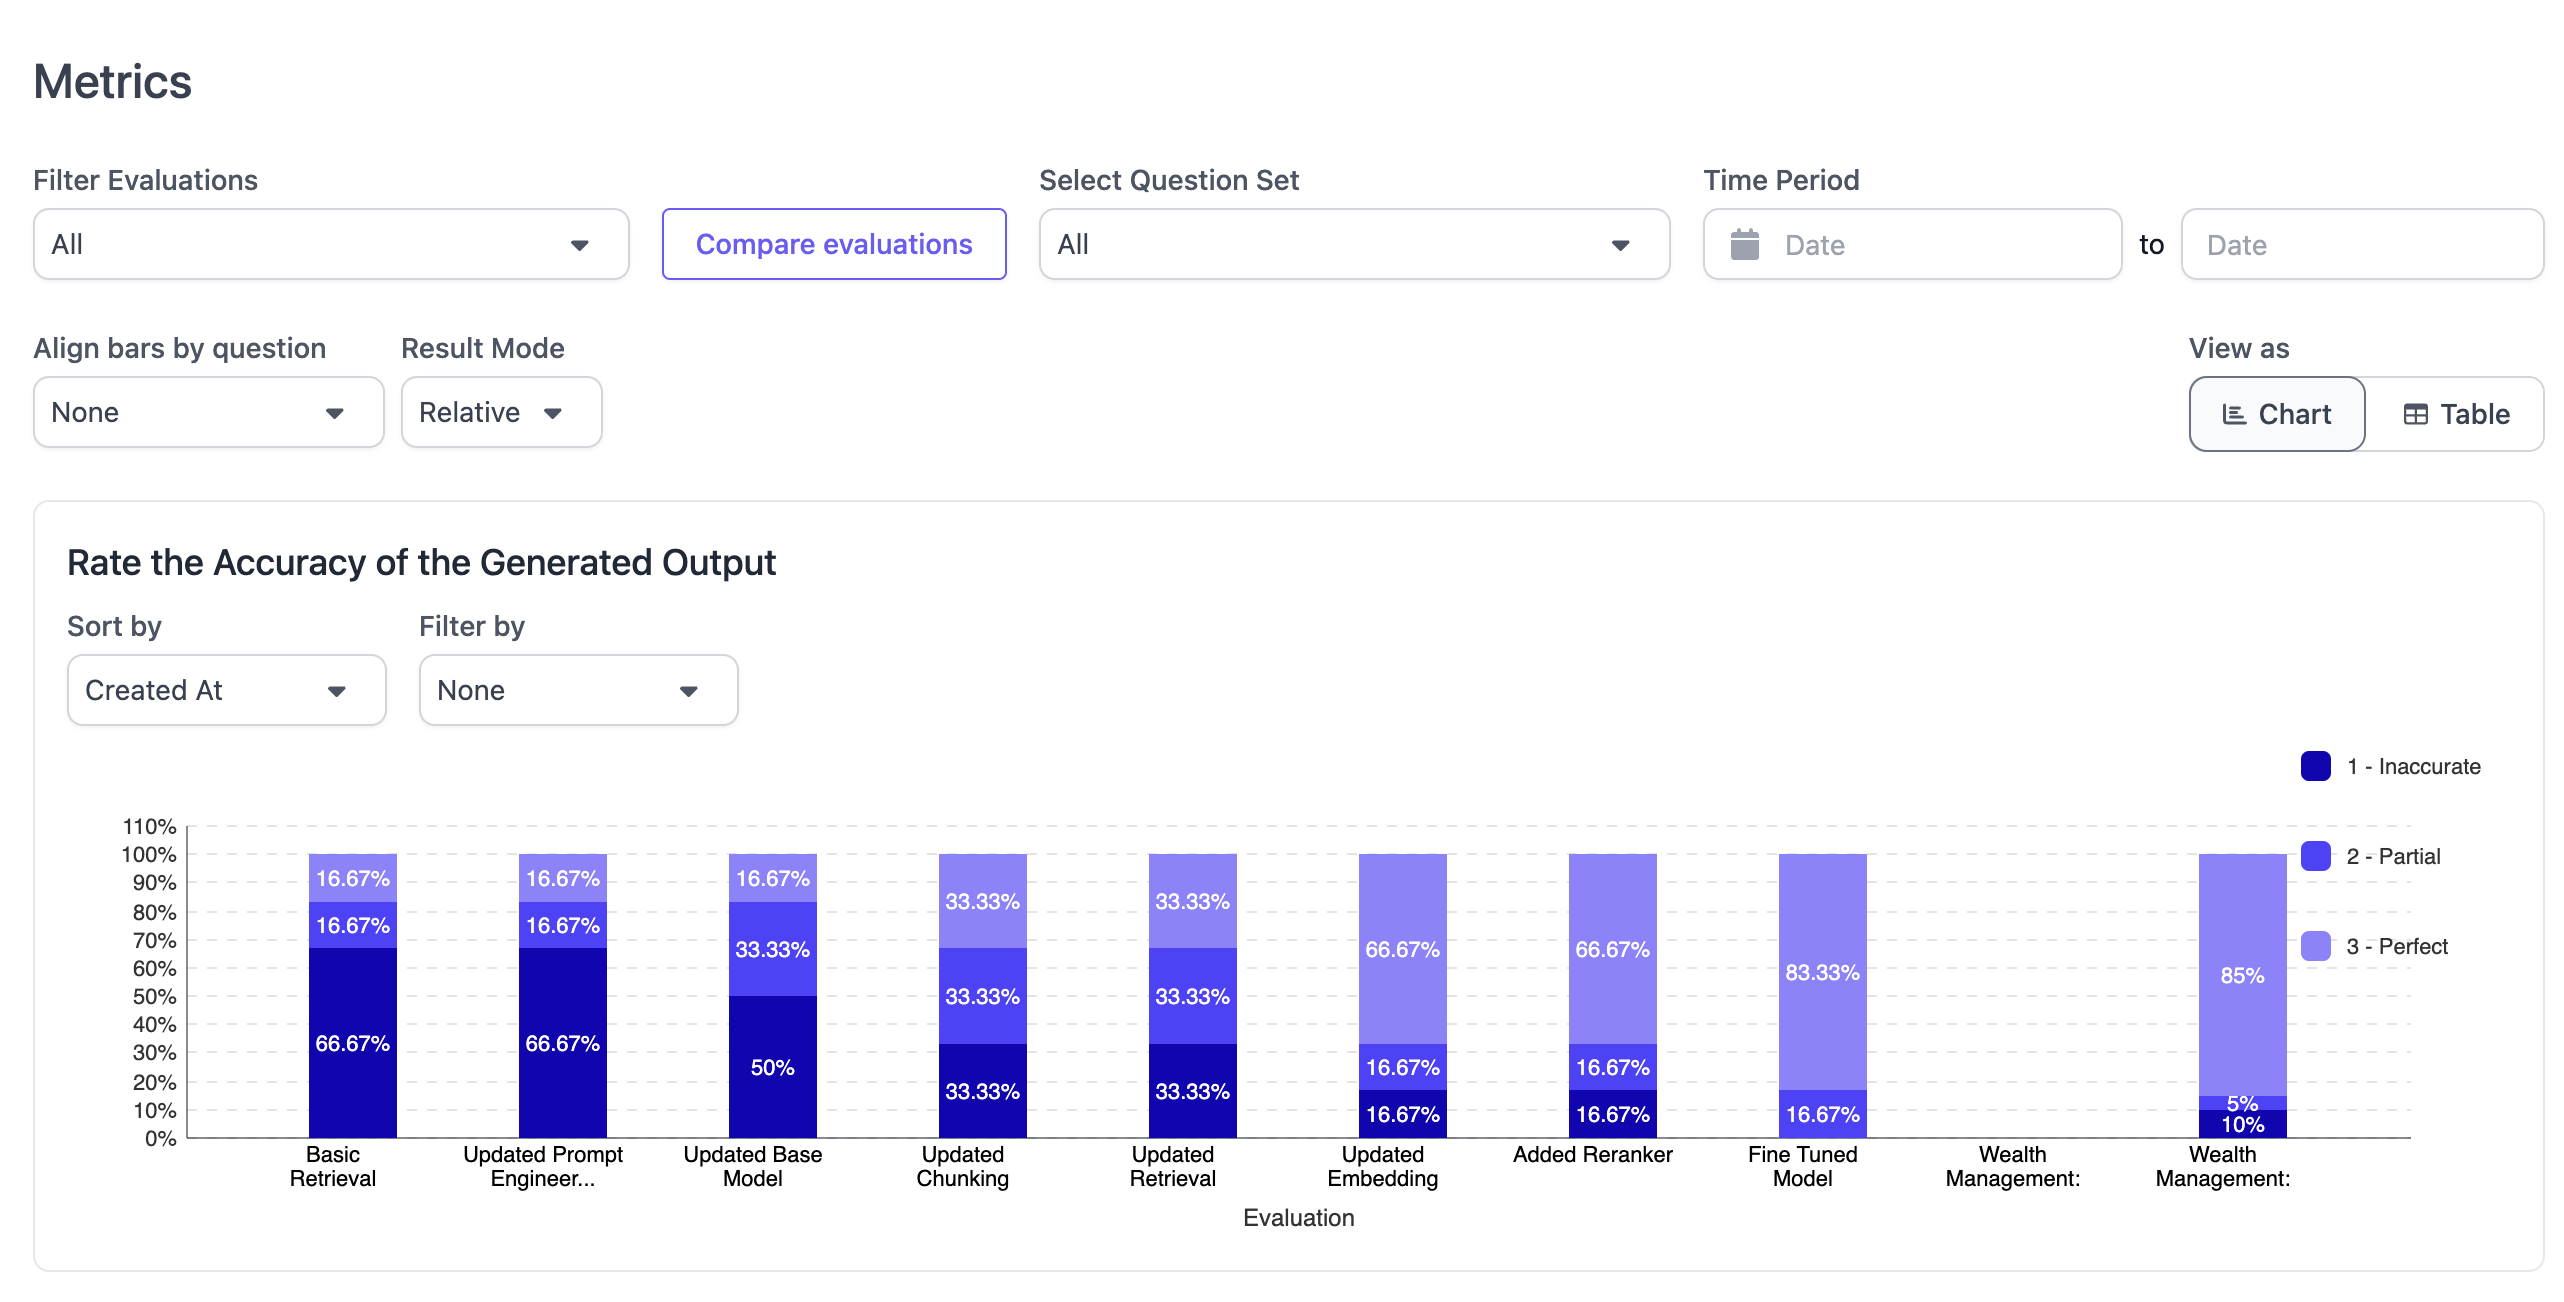
Monitoring Dashboard
The Monitoring view is designed to track all interactions with the deployed application variants over time. The view enables users to see time series metrics for user engagement and execution as well as a tabular view of all interactions. Clicking into an interaction leads to a trace view, showing all details of the specific interaction. The dashboard can be filtered by time and application variant.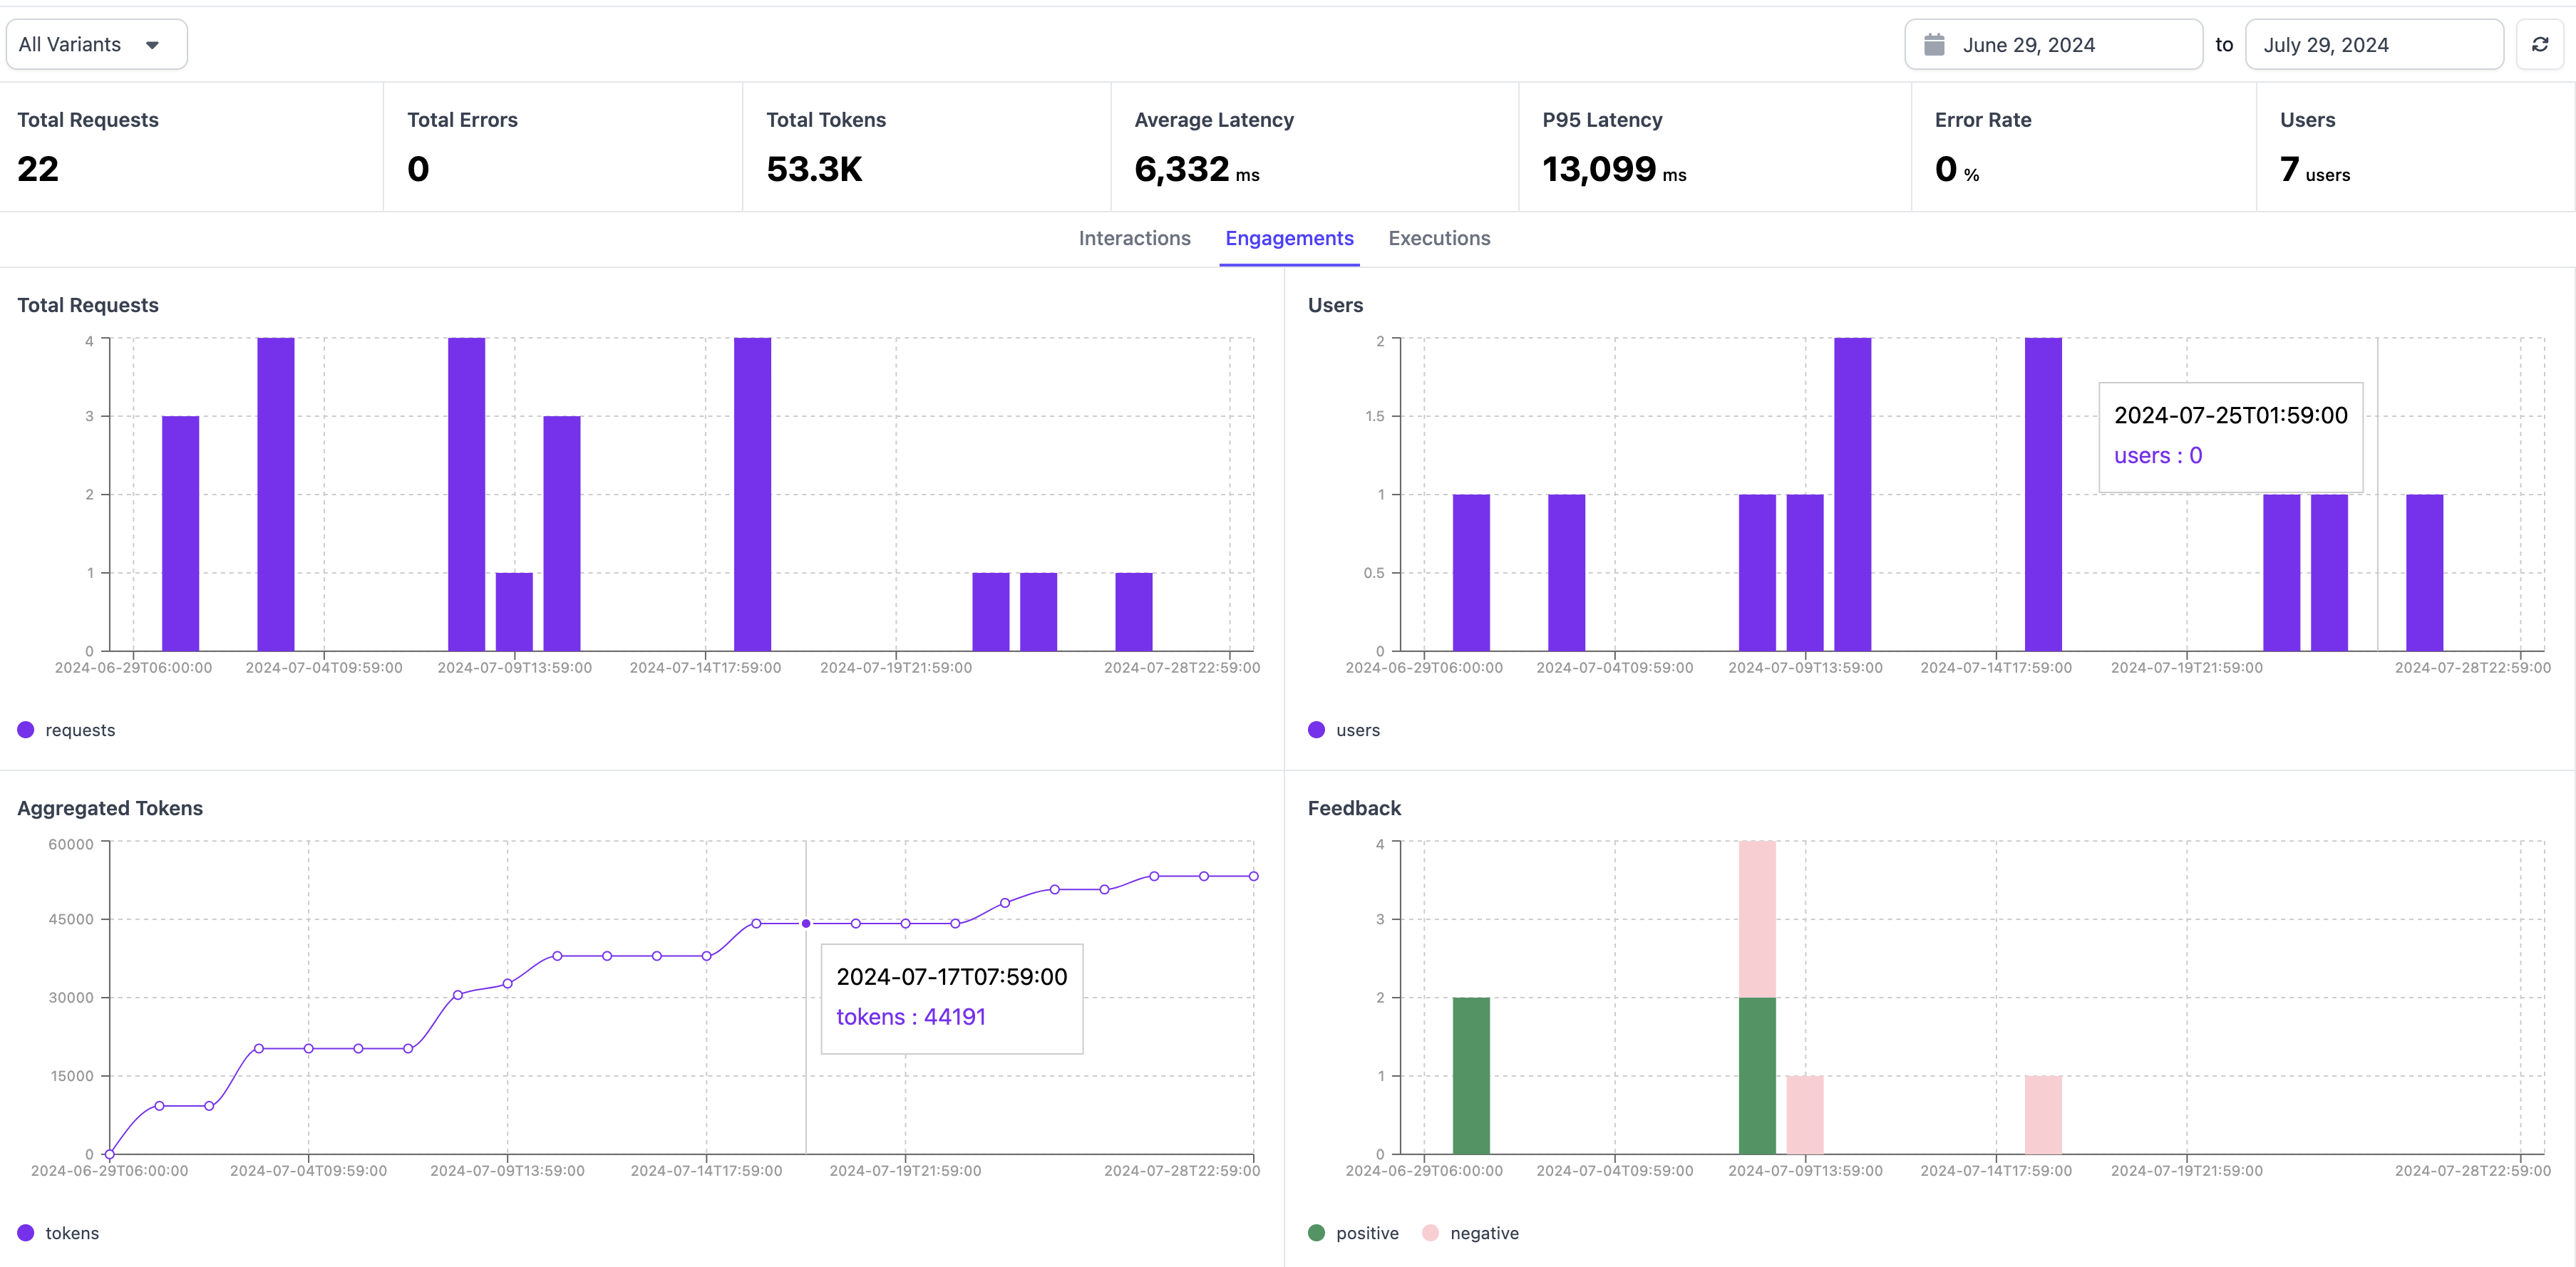
Create Variant
Users can create a new variant from the quick actions. Creating a new variant follows the same pattern as creating a new application.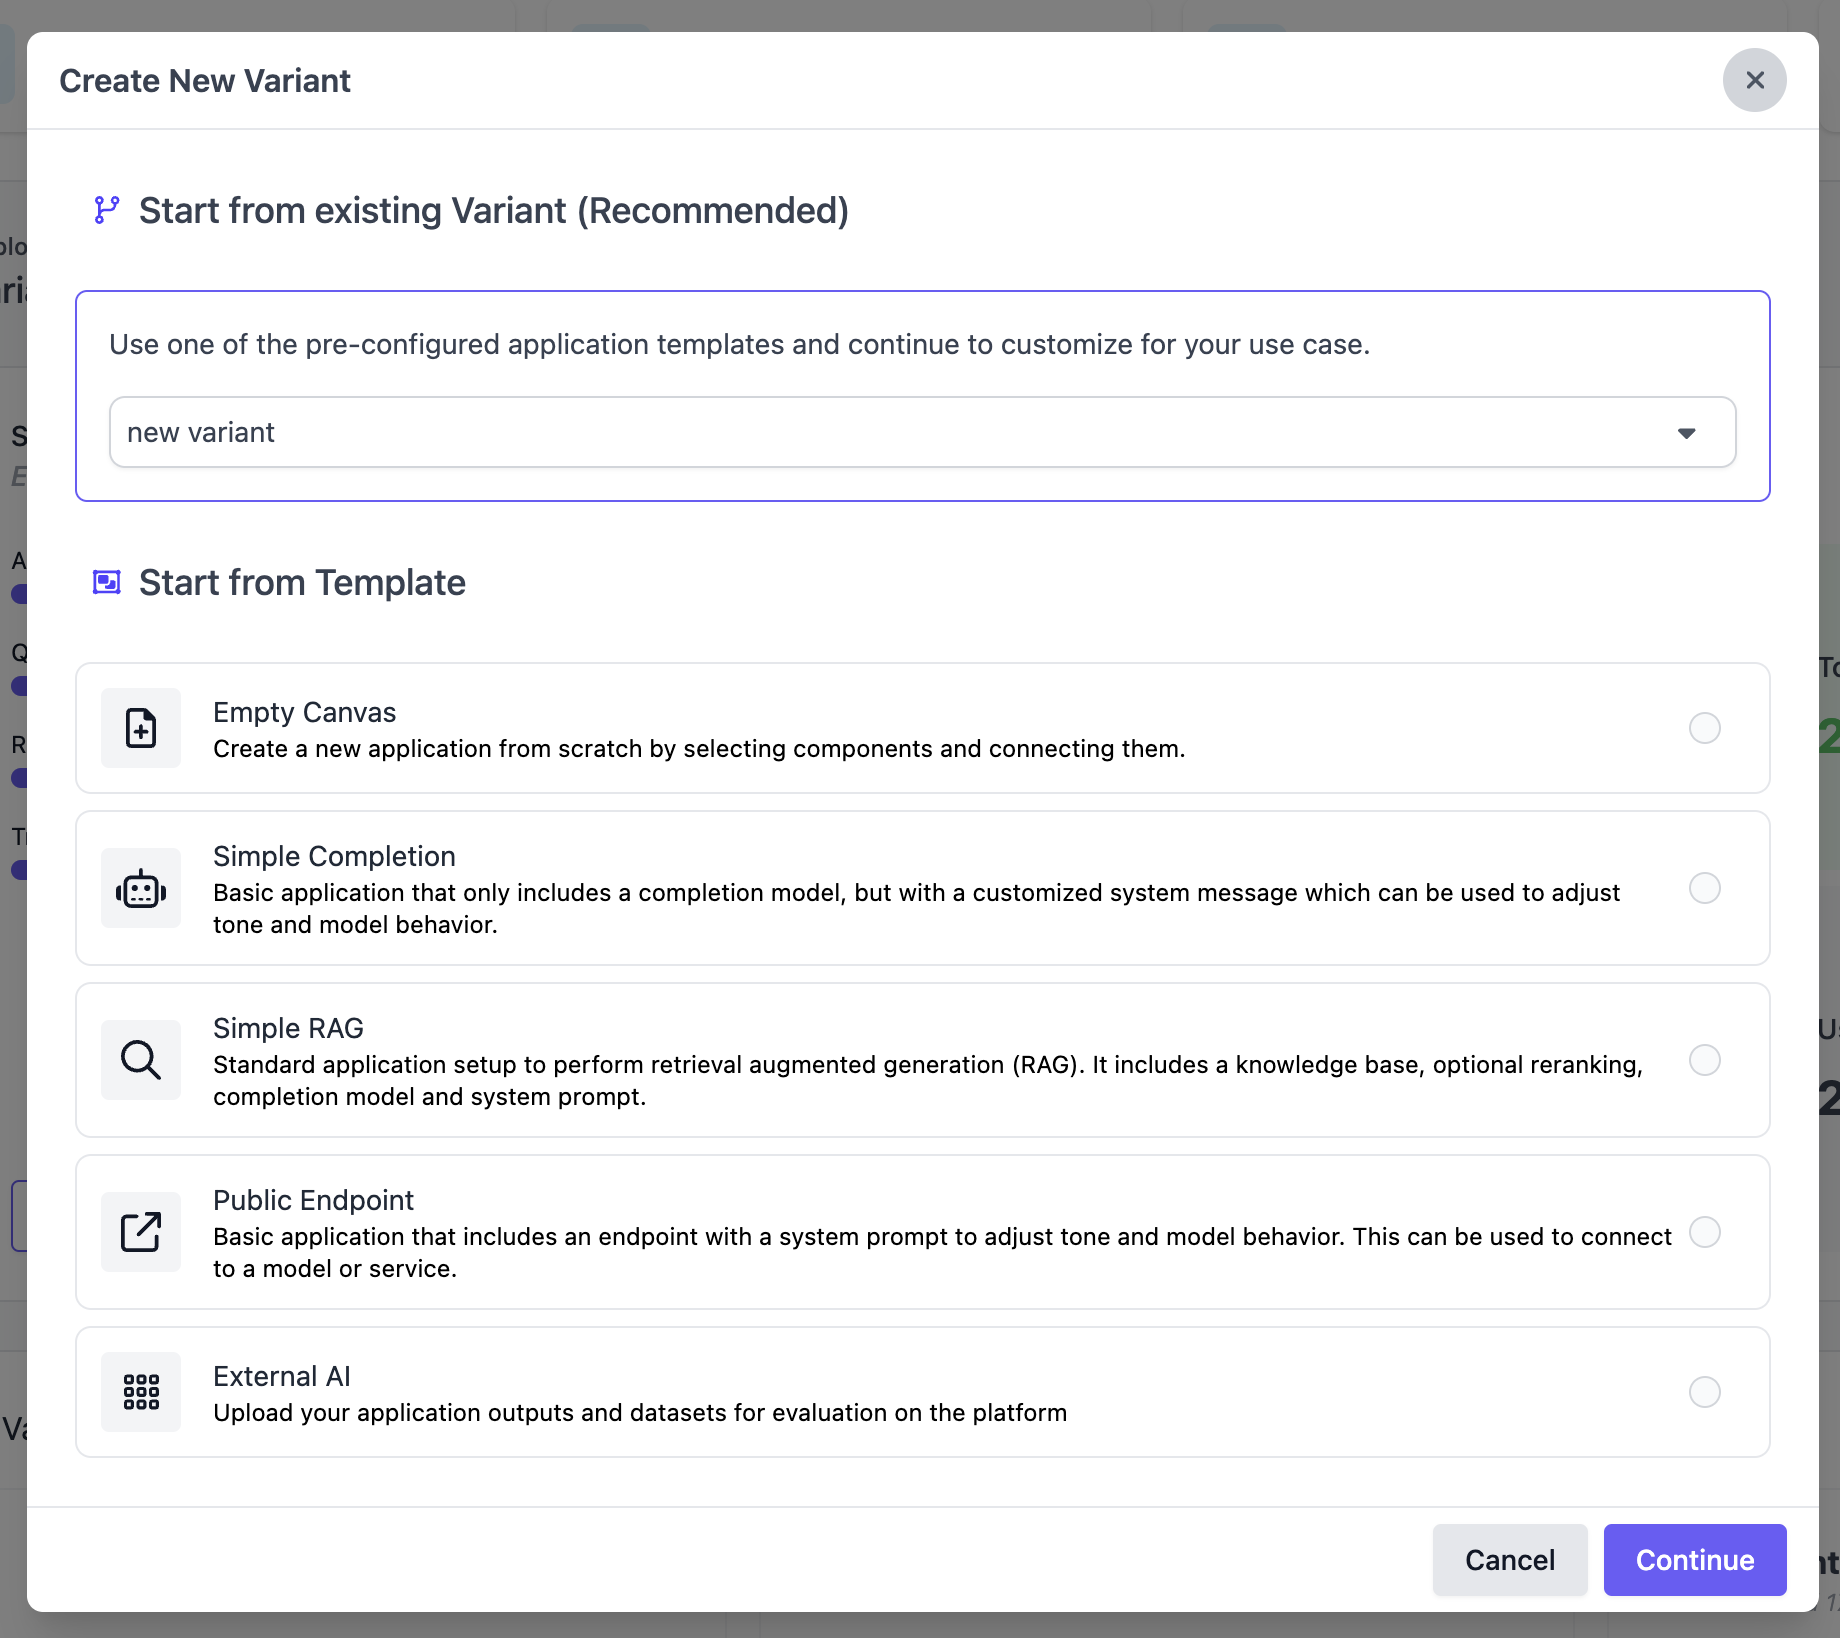
Archive Variant
If you want to remove an application, you can do so by clicking the three dots in the top right hand corner and selecting “archive”.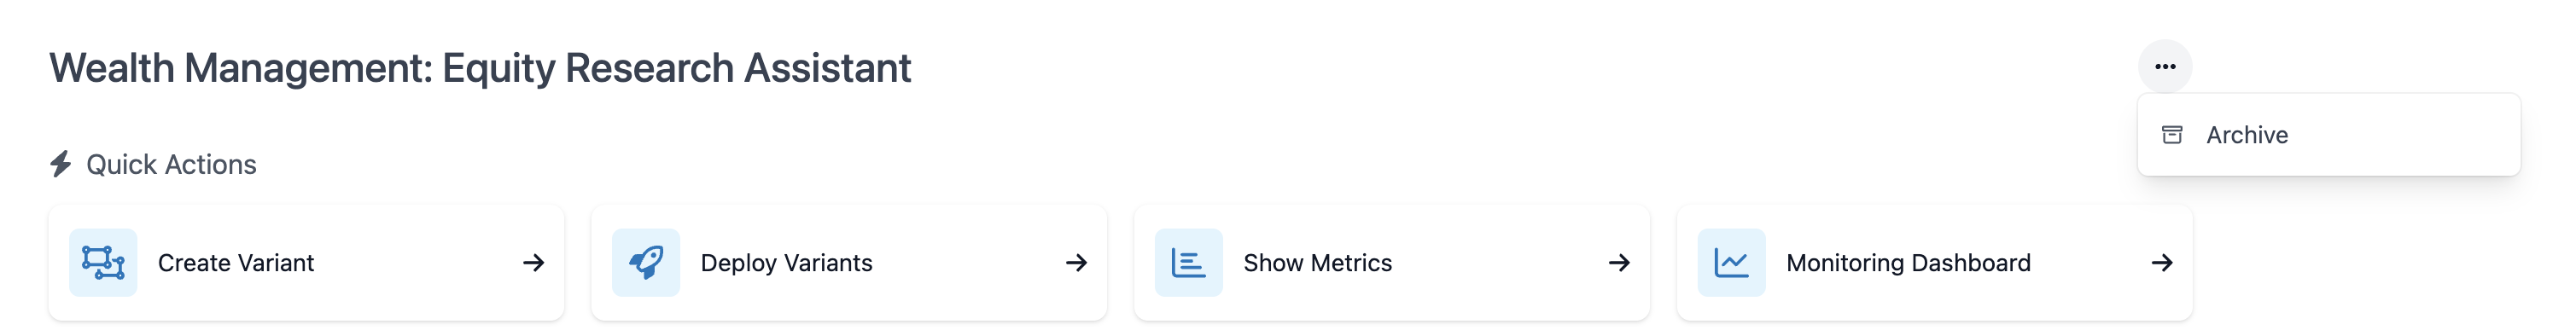
Variant Overview Page Functions
The variant page provides an overview of the given application configuration. By default, this shows the graphical node builder which outlines the variant’s components and their connections in a node-based graph.
Generate / View Report Card
On the right hand side, users can chose to generate a Scale Report Card for this variant, or see the results of the Report Card if it was already generated. For more details on Report Card, see here.Evaluate Variant
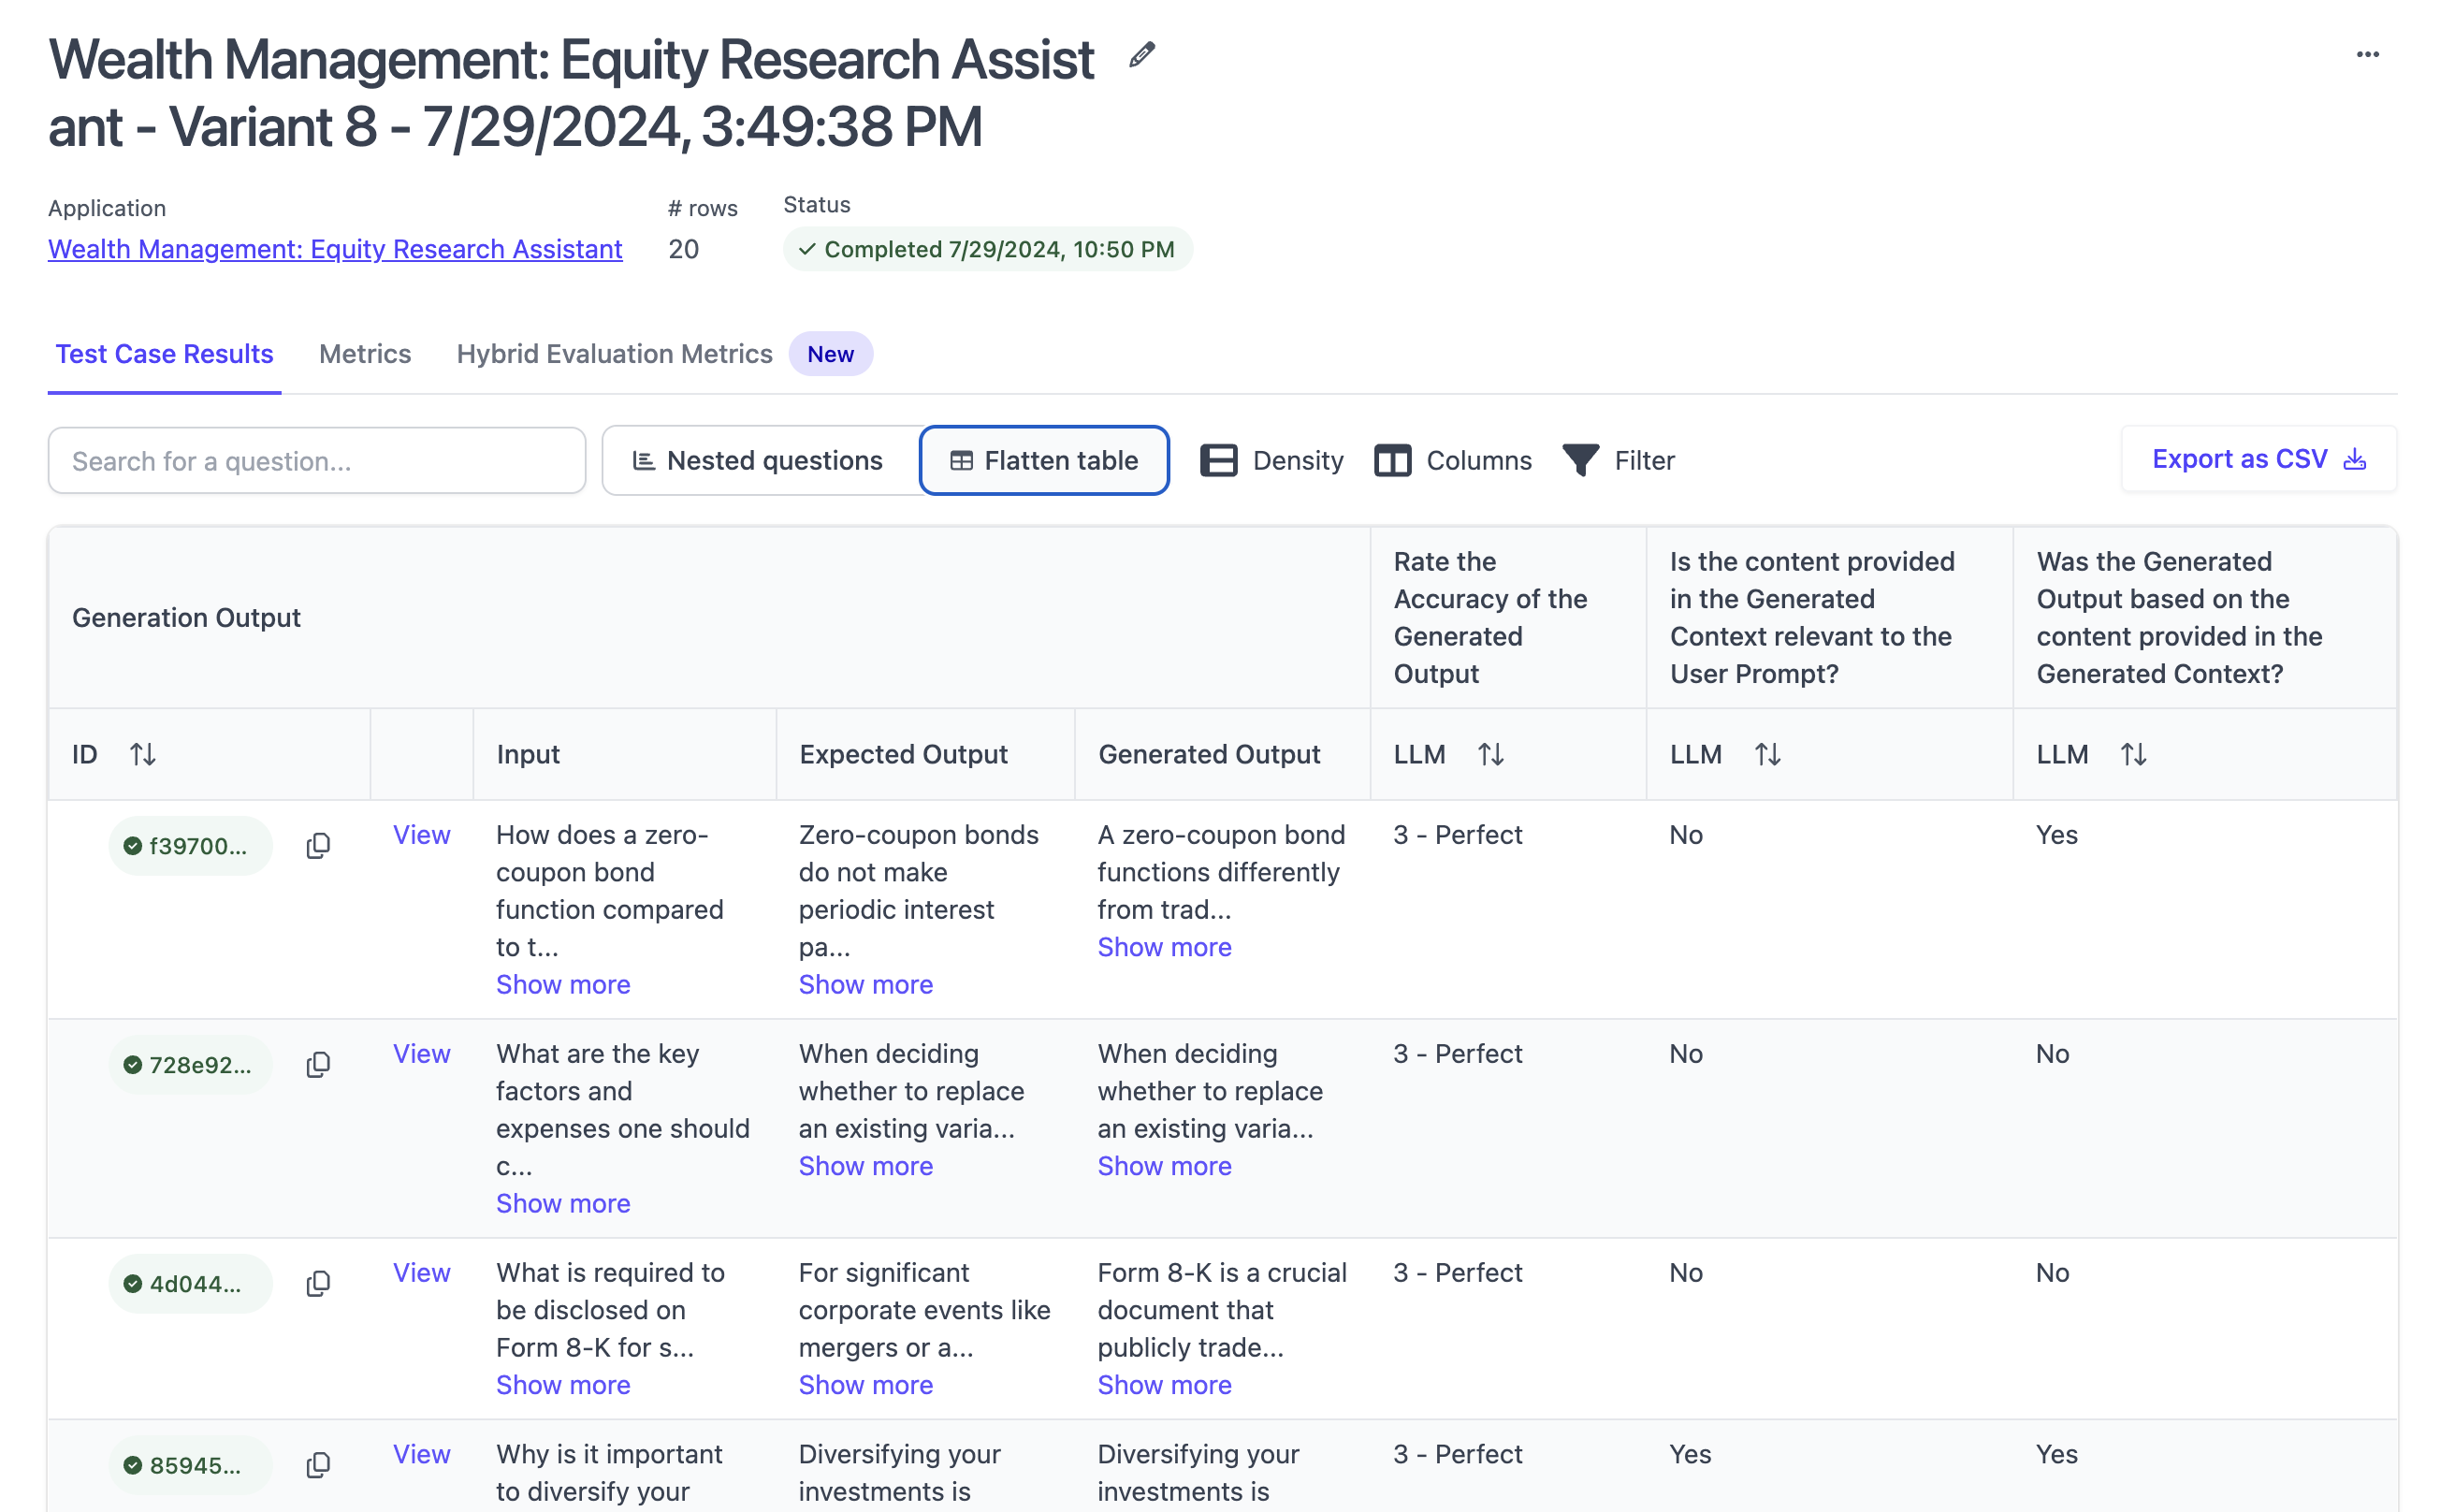
From the quick actions, users can start a new evaluation run for this application variant. For more details of how to create an evaluation run, see our guide on Evaluating Applications.Fork Variant
Users can create a new variant from the node builder, by clicking on “Fork Variant”, which will start the app builder, pre-loading the configuration of this current variant.Manage Deployments
Similar to the application overview page, users can manage which variant is deployed by following the quick action “Manage Deployments” and making the relevant configurations on that page.Try Variant
Clicking on “Try Variant” opens a drawer, which enables users to interact with the variant in an interactive manner. If you want to open the variant properly, this is best done via the “Manage Deployments” quick action.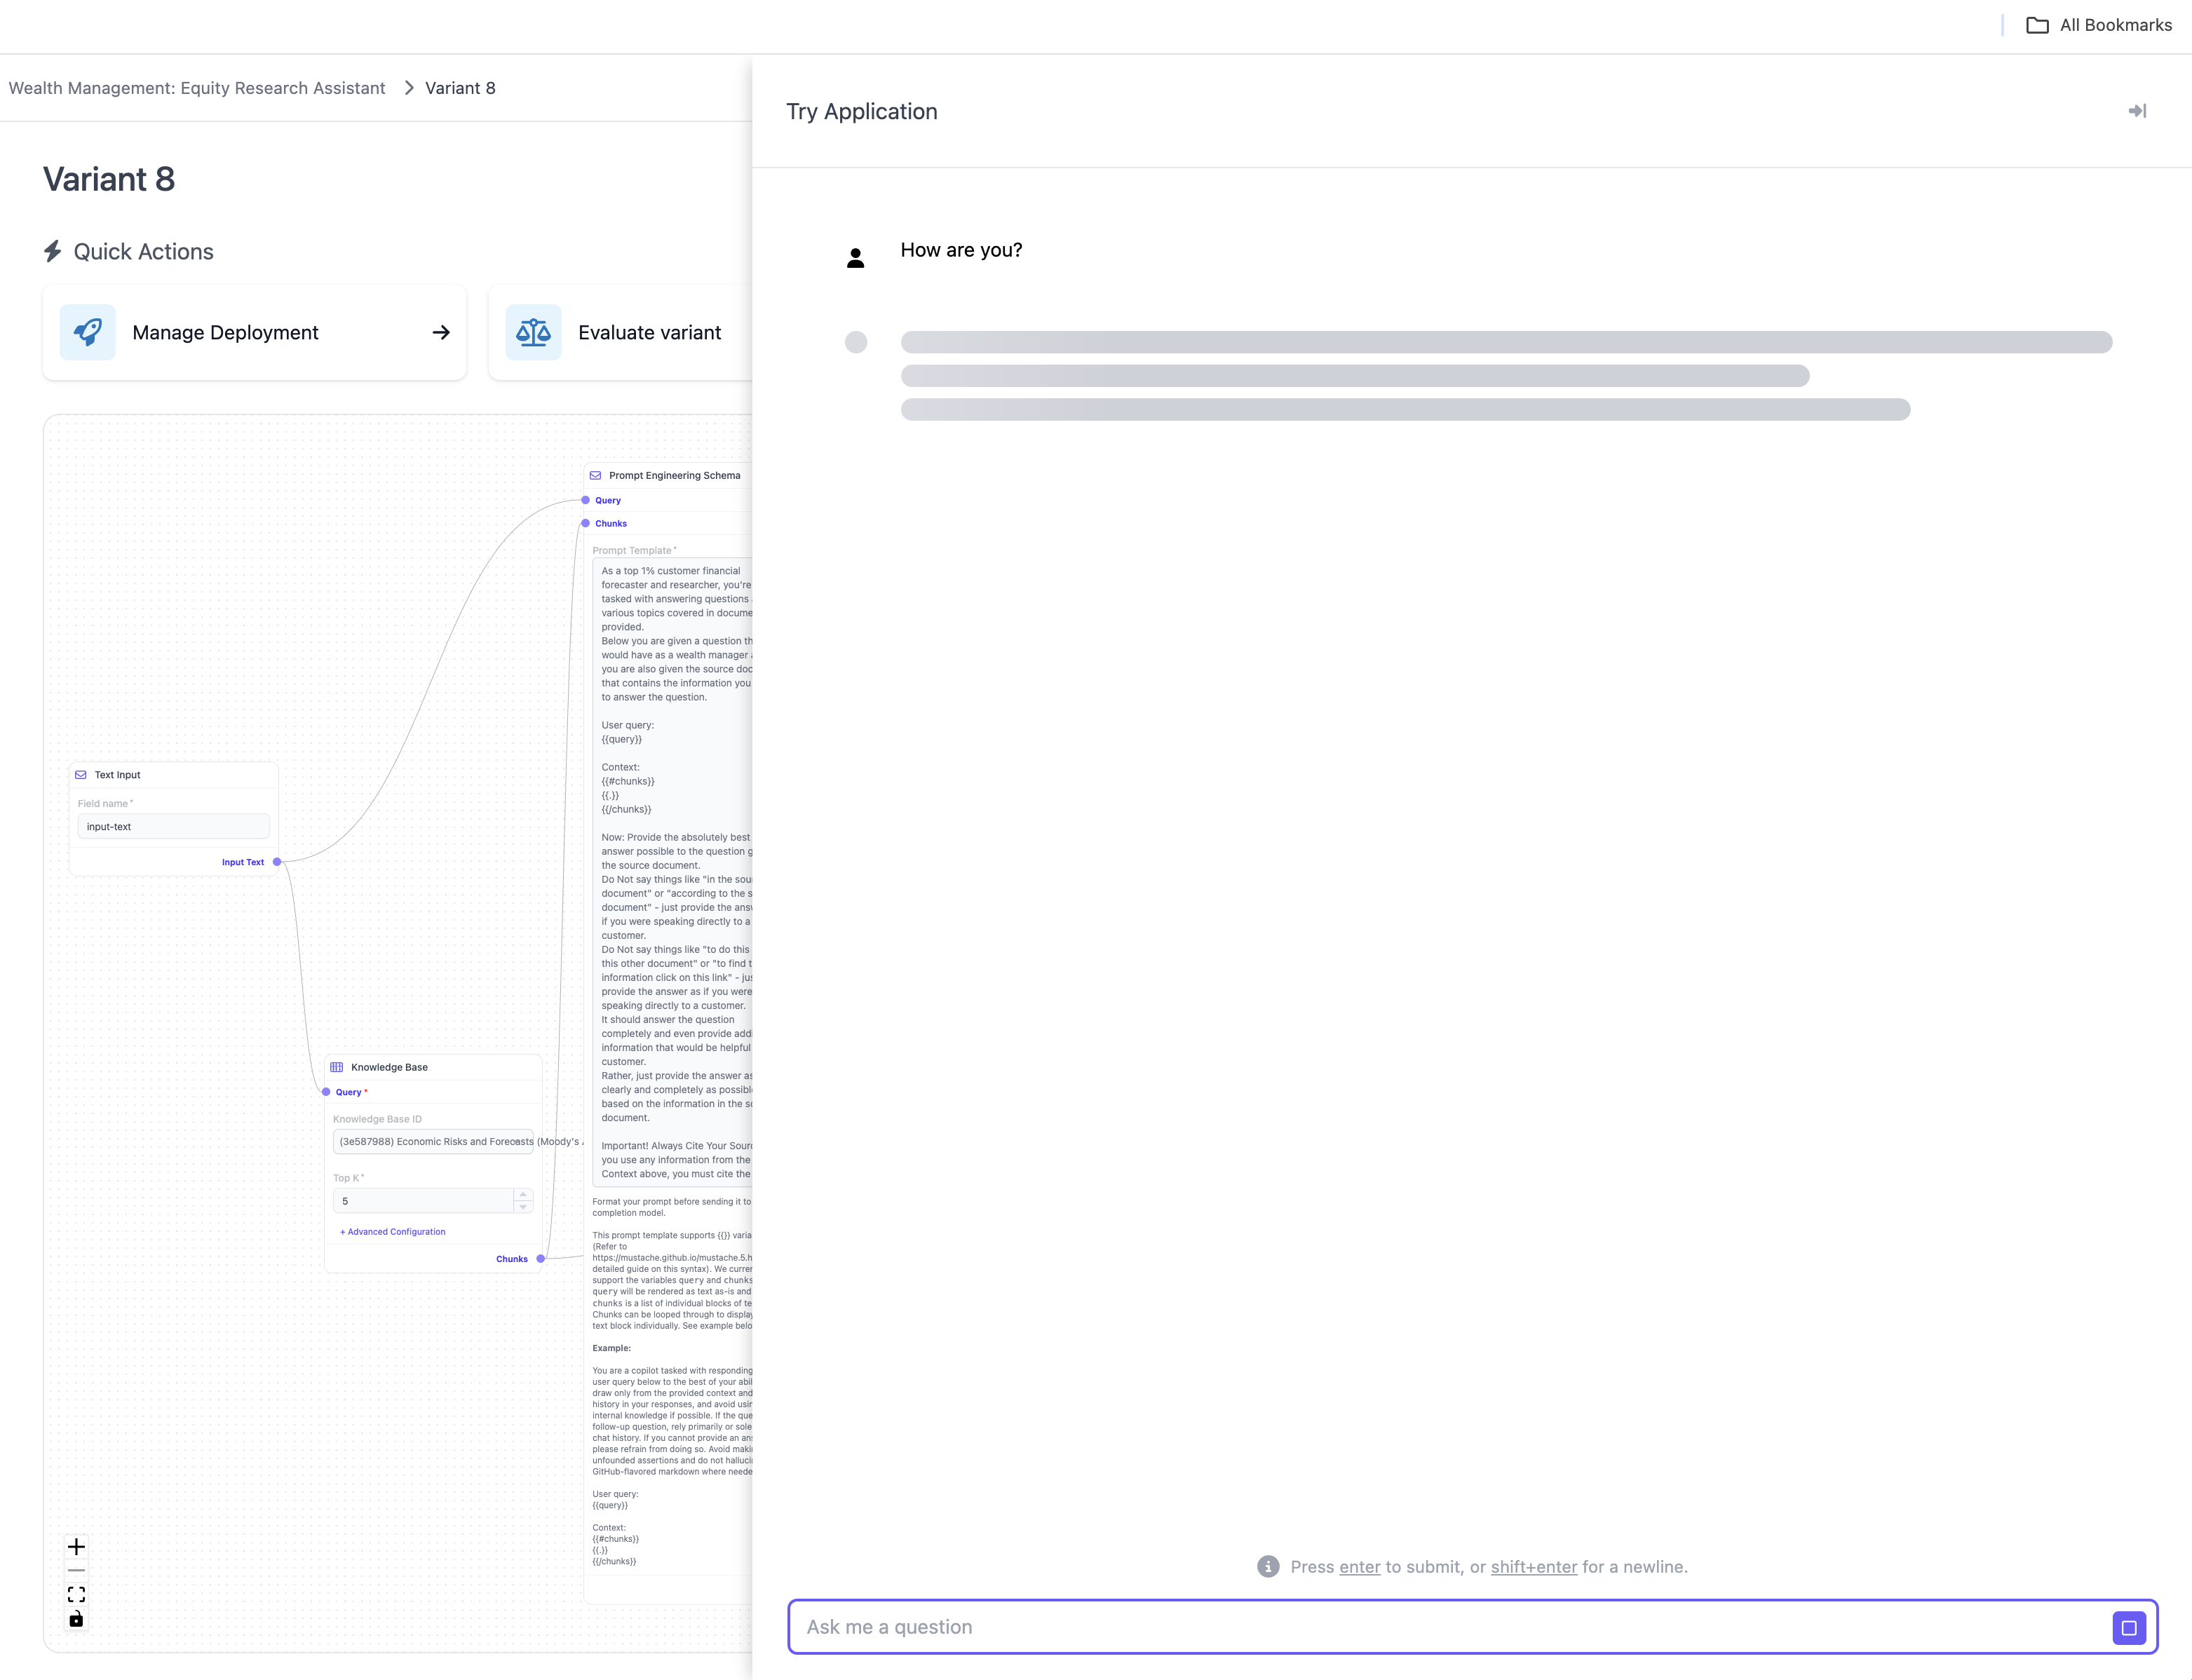
Manage Components
The second major section in SGP is components. Components are the individual building that users can manage and re-use to build applications or evaluate their applications. Components can be used and re-used across applications, which is why they are managed separately from the other workflowsFor Application Building
Models
A list of all models that can be used within SGP applications. This includes closed as well as open source models. Models encompass completion, embedding, and reranking models. SGP supports a very large variety of models out of the box. You can install new models using the Component Catalog. To learn more about models, see Models in SGP.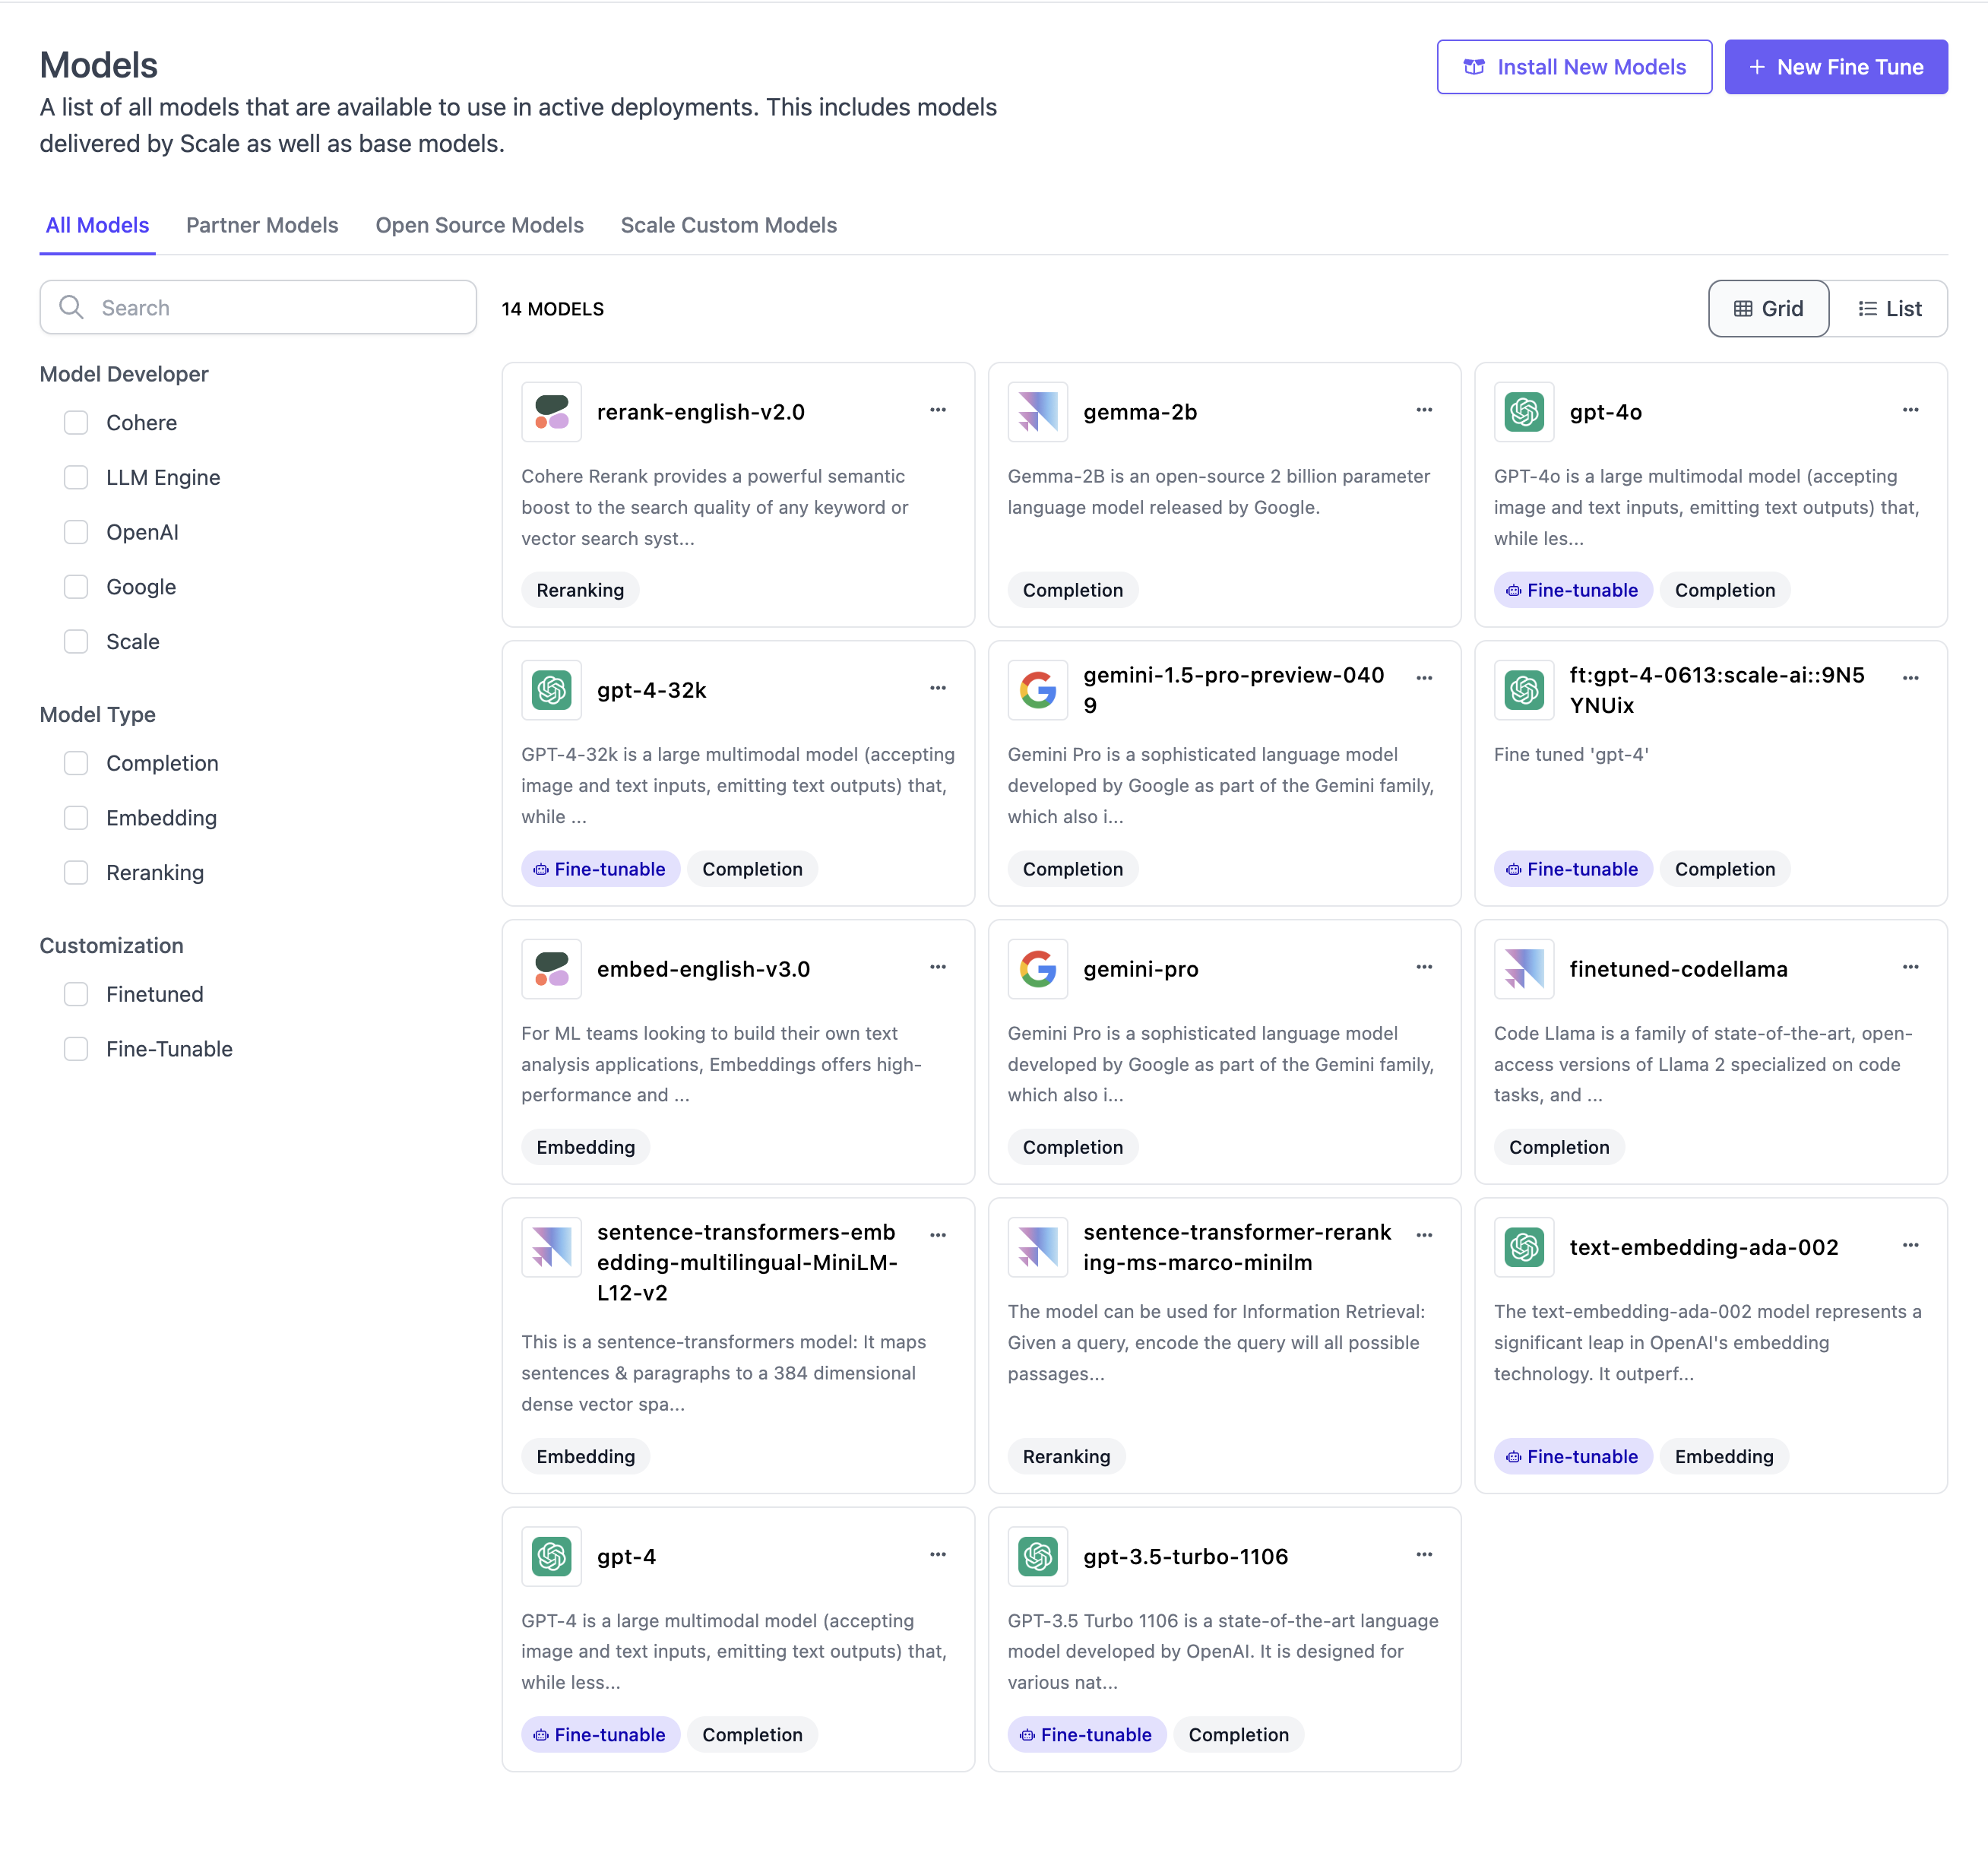
Training Datasets
A list of all training datasets that can be used for fine-tuning models in SGP. You can manually upload new training datasets. Depending on your installation of SGP, there might be off-the-shelf training datasets available provided by Scale AI. To learn more about fine-tuning, see Fine-Tuning.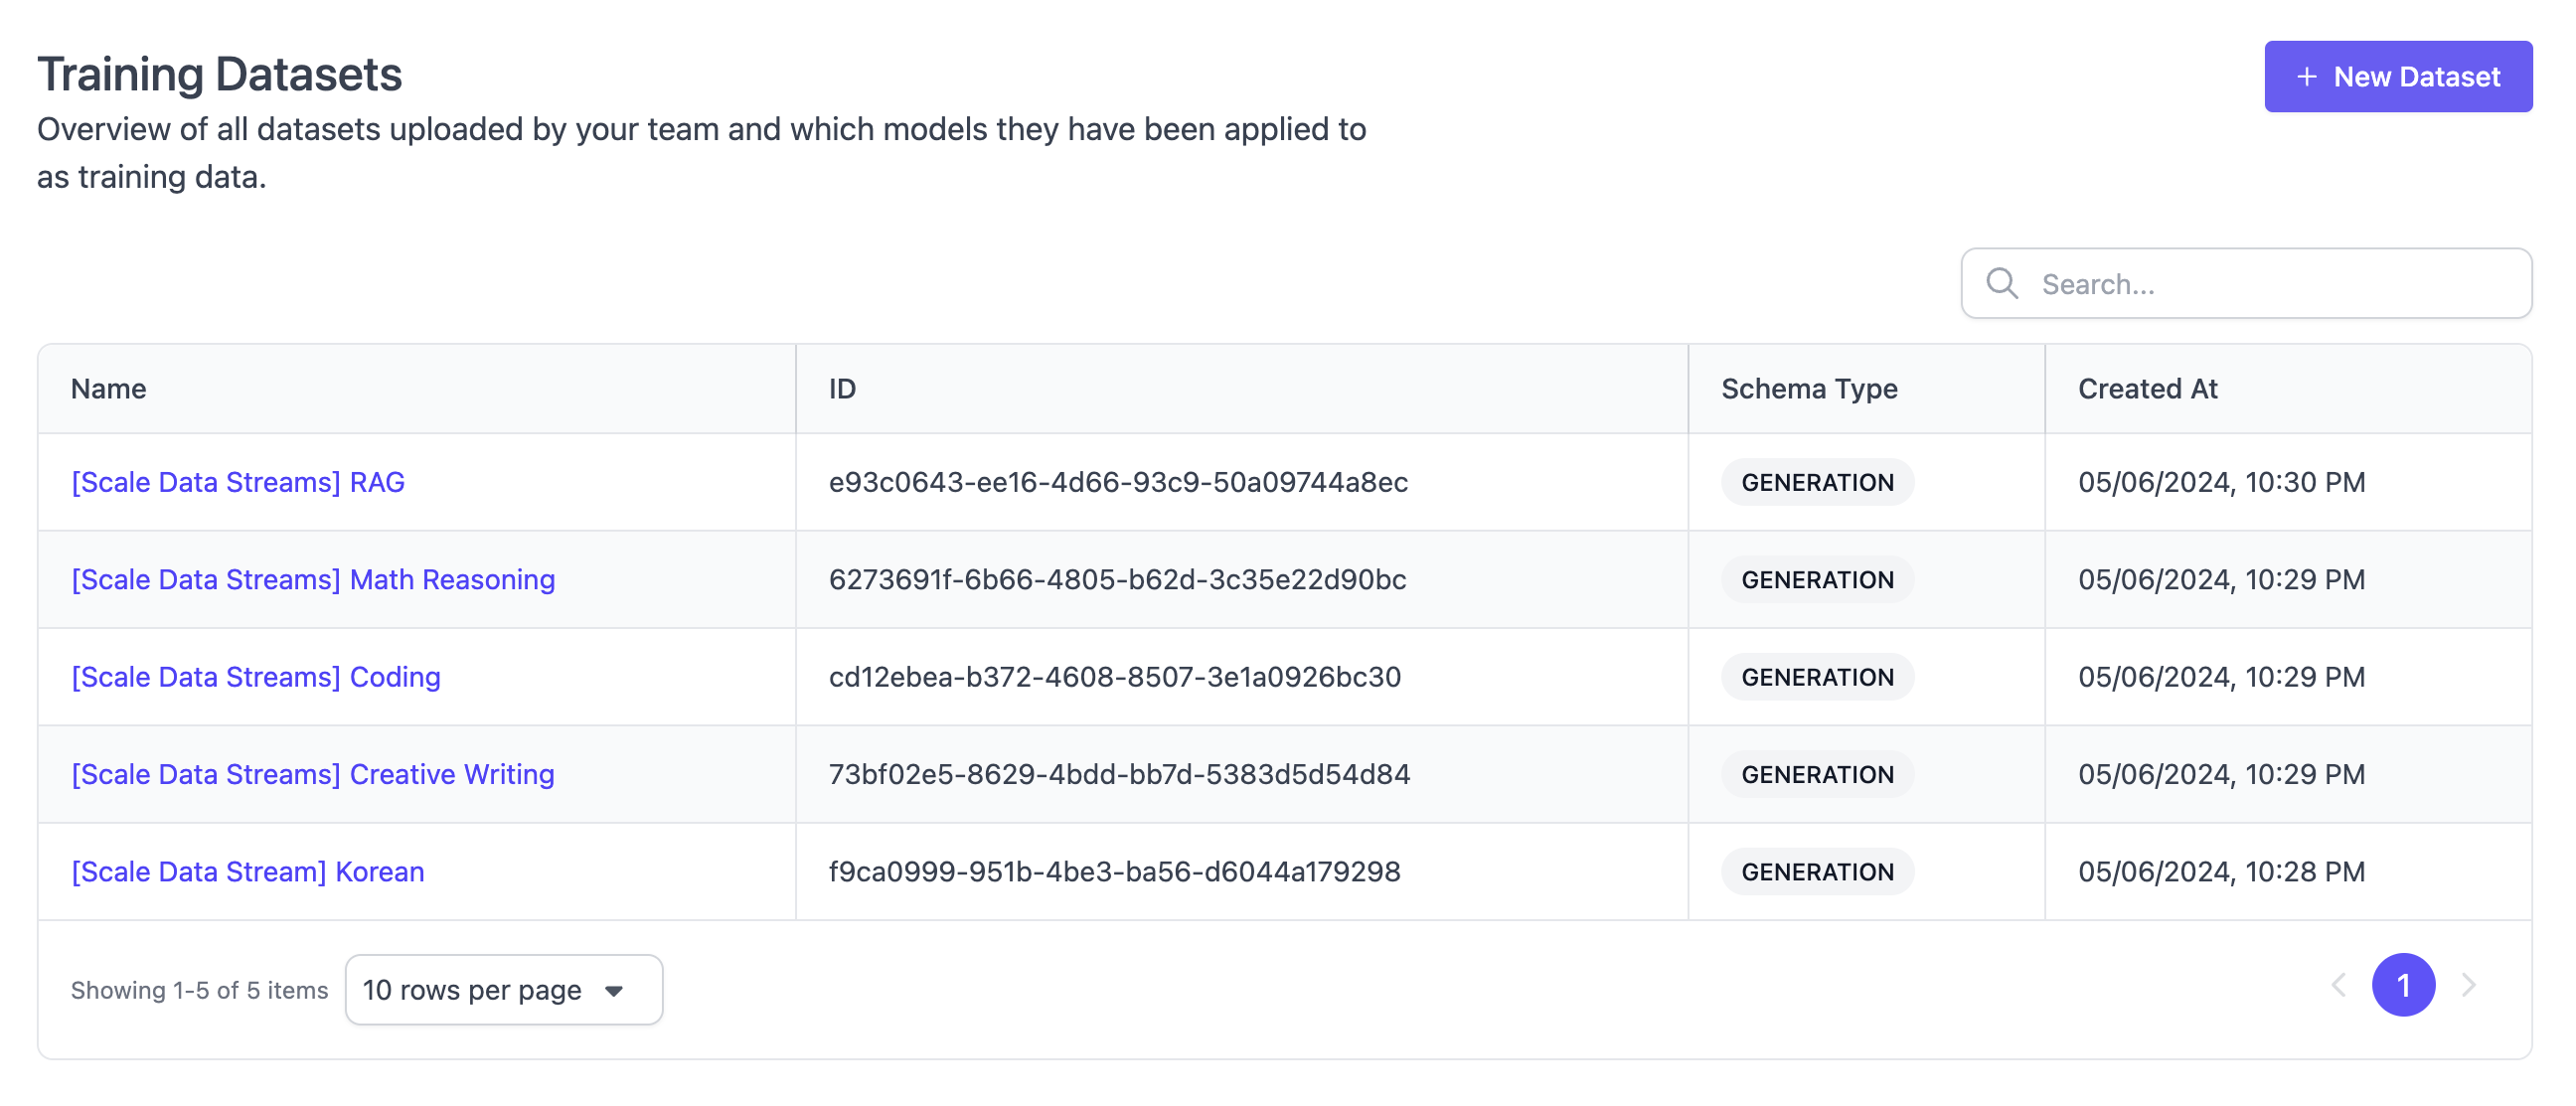
Data Sources
List all data sources that you have connected to, which can be used to dynamically upload data into knowledge bases. You can add new data sources or inspect the configuration of existing data sources. SGP supports several data sources like Azure Blob, S3, Google Drive, Confluence, Slack, and Sharepoint out of the box. If you need a specific data connector, do not hesitate to reach out to our sales team. To learn more about data sources, see Data Sources.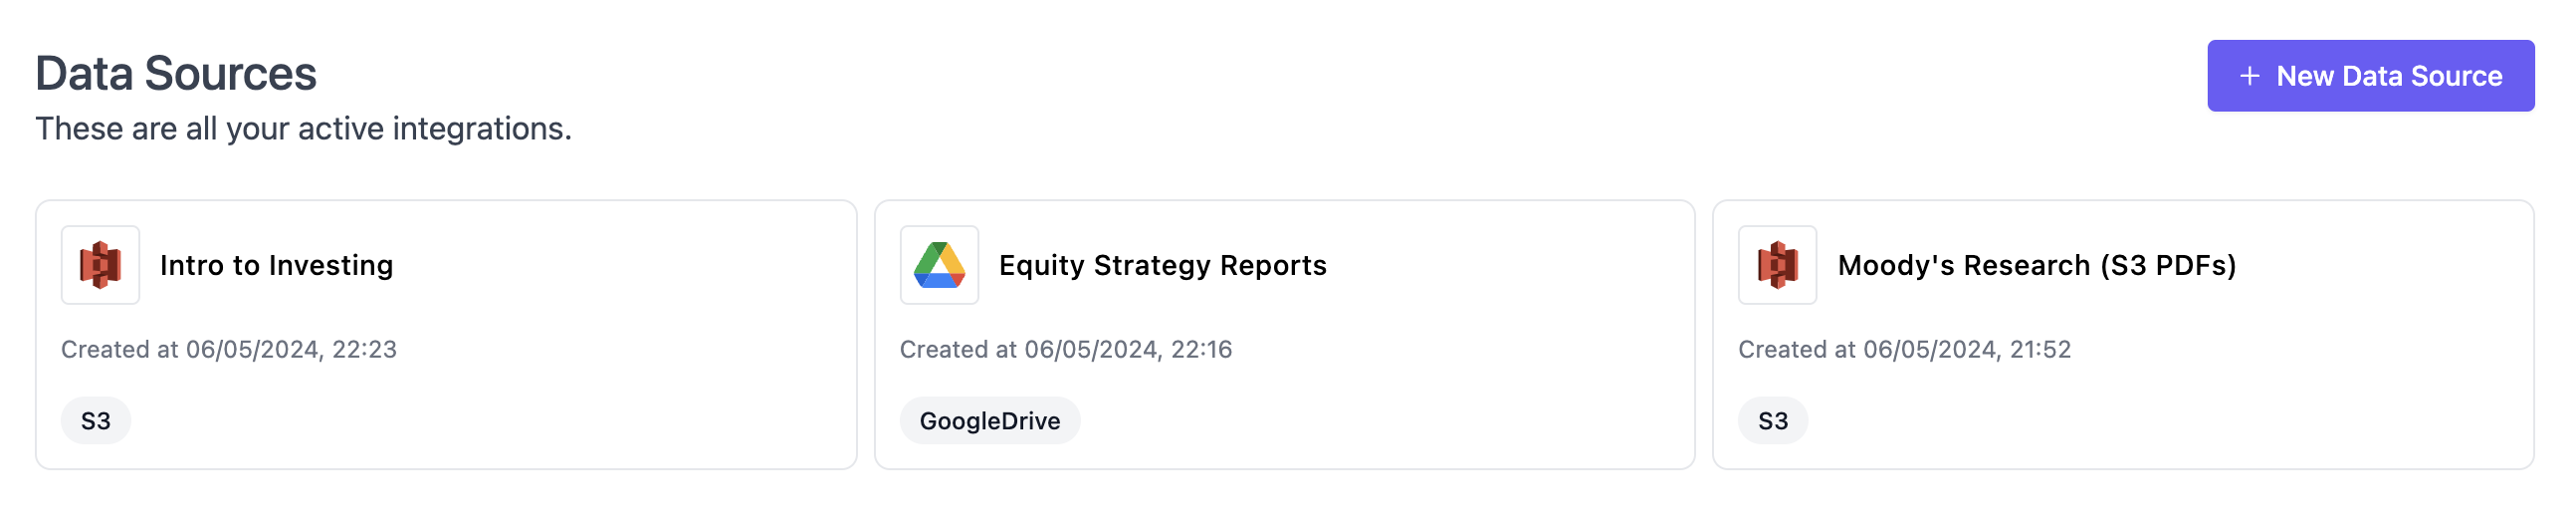
Knowledge Bases
Lists all Knowledge Bases available in your account. You can create a new knowledge base or inspect the data within a given knowledge base by clicking into them. Within a knowledge base, you can see past uploads, scheduled uploads as well as a list of all artifacts and chunks contained in a given knowledge base. Knowledge bases are essential building blocks for RAG applications. In SGP, knowledge bases can also be used to dynamically generate Evaluation Datasets. To learn more about knowledge bases, see Knowledge Bases.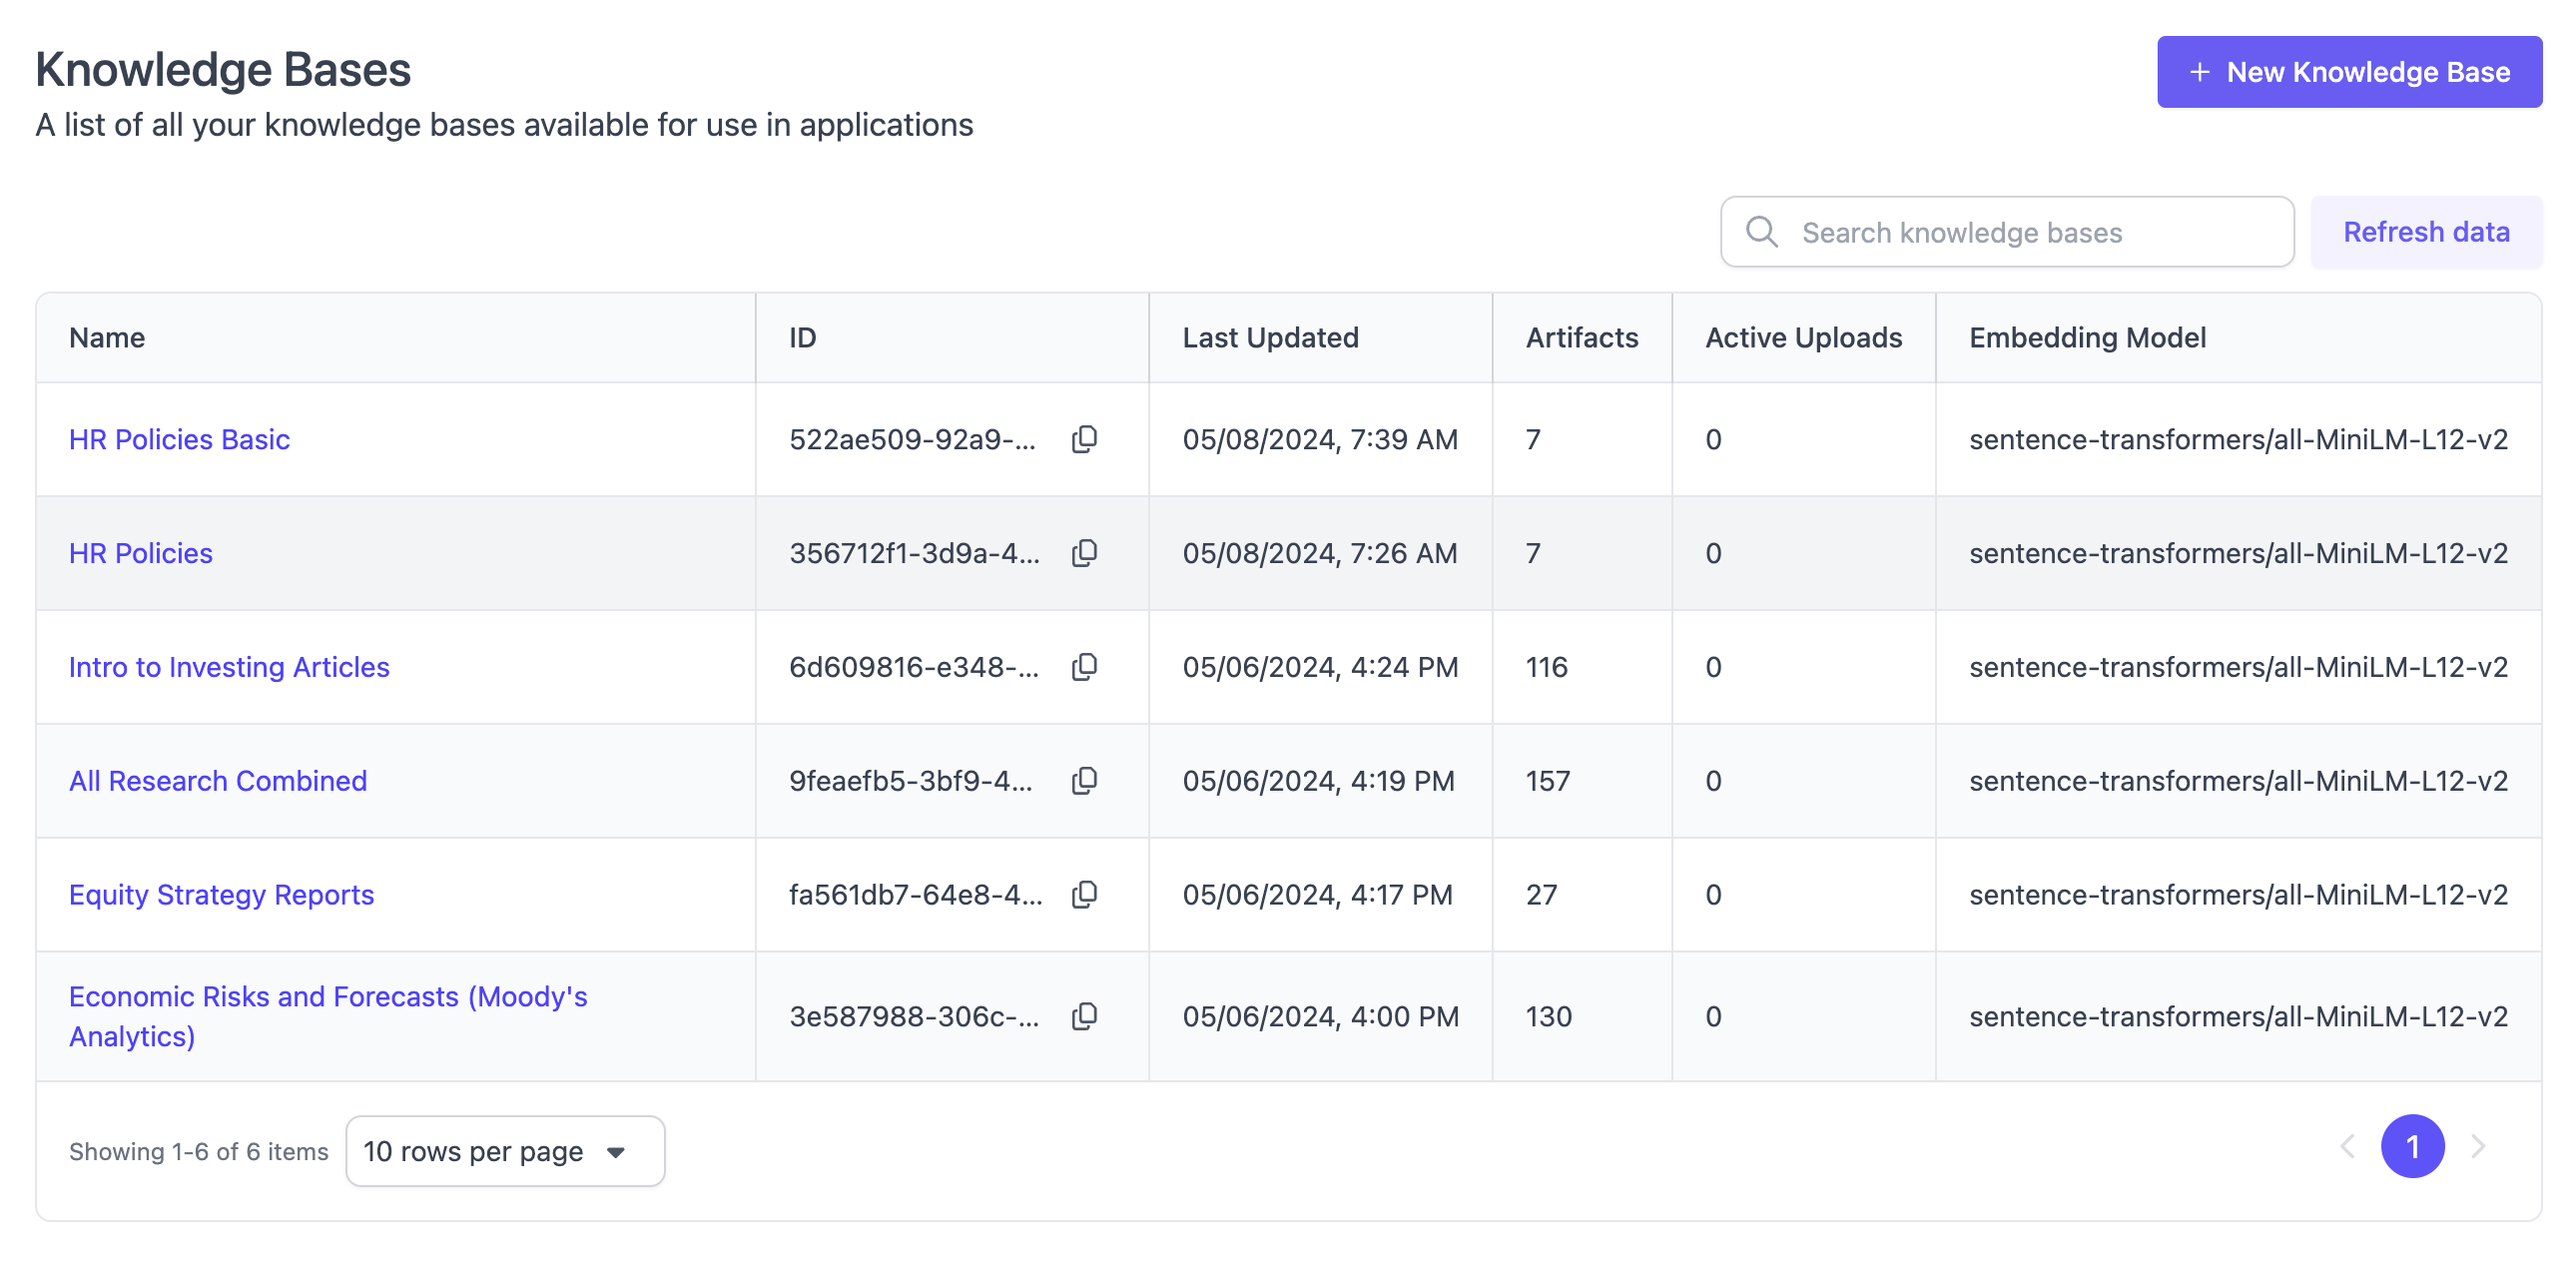
Catalog
The component catalog can be used to install additional components such as models, datasets, or knowledge bases. Installing means making them available for all members of the given account. Only users with at least manager permissions on the account can install new components using the catalog. The contents of the catalog are defined by the installation of SGP. For single-tenant or VPC installations, this means that the catalog is defined by your organization’s admin.For Evaluation
Evaluation Datasets
Lists all available evaluation datasets, including datasets that are currently in draft mode. Evaluation datasets (golden datasets) are a key component for evaluation in SGP; they contain the test cases that you evaluate your AI application on. In this view, you can create new evaluation datasets, either through manual upload or automatic generation. Clicking into an evaluation dataset shows its details, including versioning and schema type. Learn more about Evaluation Datasets.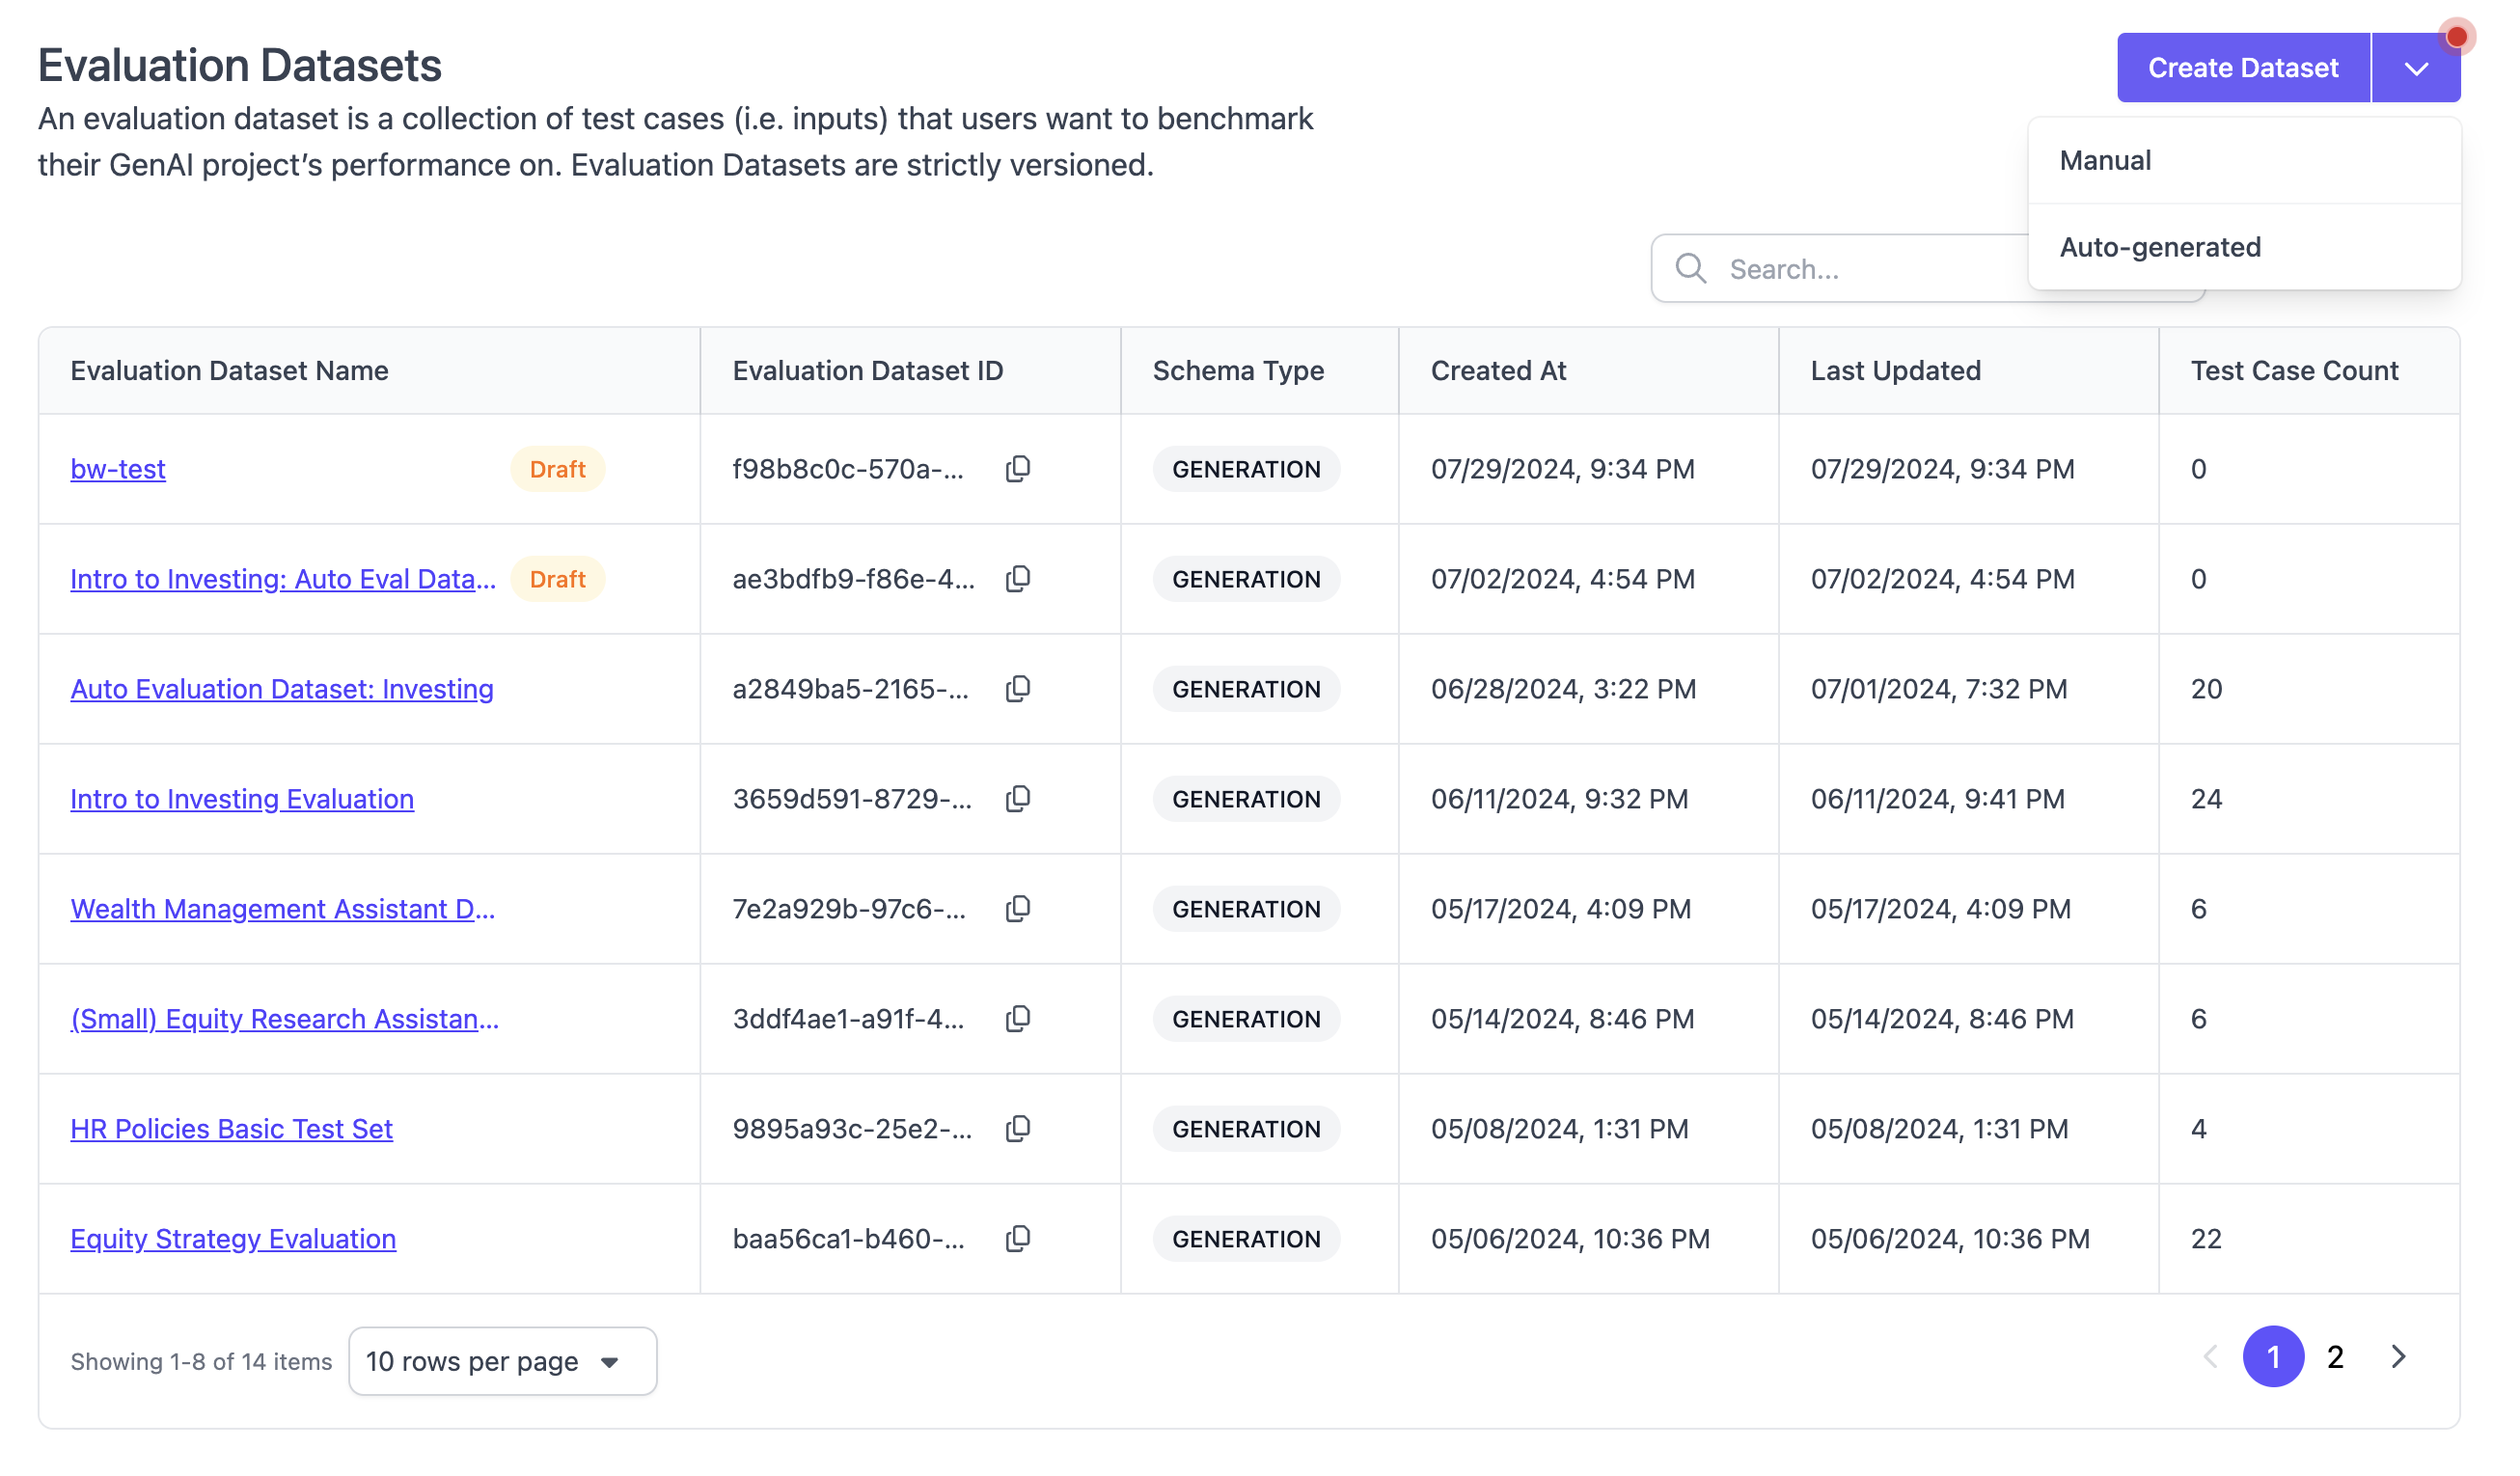
Evaluation Rubrics
Evaluation rubrics are the questions that each individual AI application output is evaluated on. Examples are accuracy, conciseness, recency, and so on. This page lists the available questions and question sets in your account. Question sets are collections of evaluation questions, which are needed to create a new evaluation run. You may see pre-installed questions and question sets in your account. Clicking into a question or question set enables you to see details and a preview of the rubric. You can also create new questions and question sets.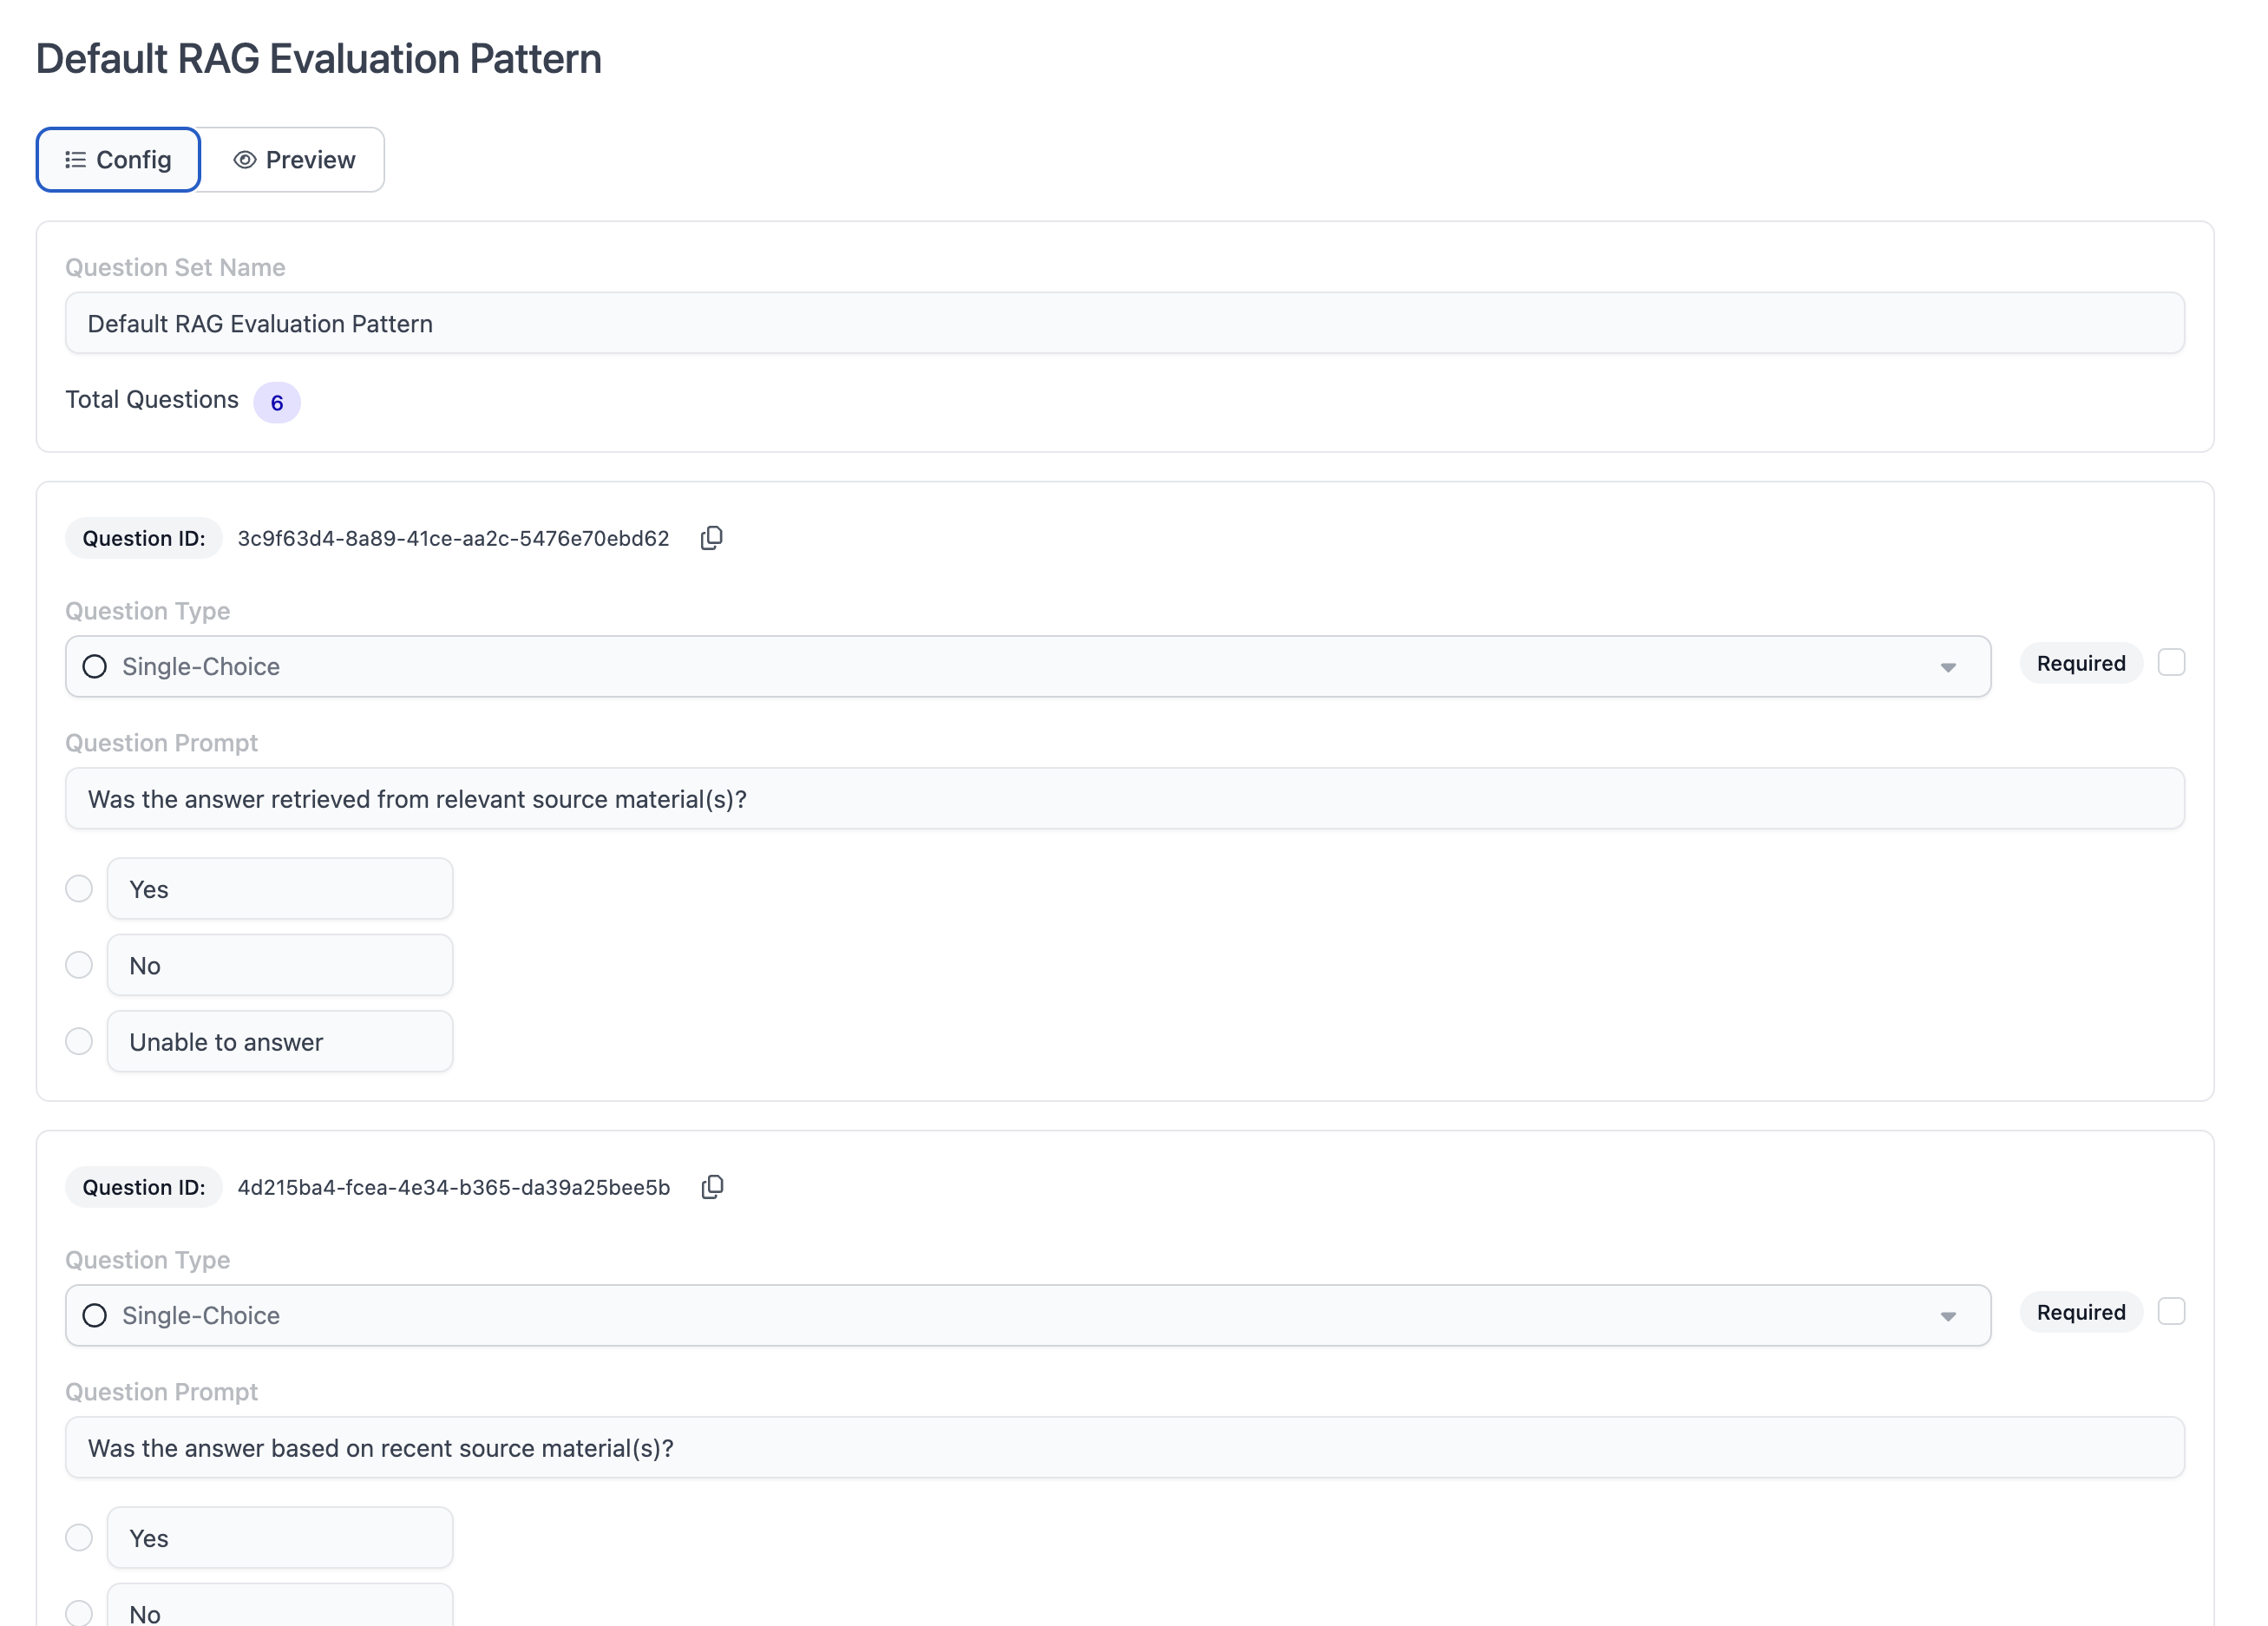
Annotation
The annotation pages provide a list of active human annotation projects in the given account. An annotation project is created for each evaluation run that is selected as type “Hybrid” or type “Contributor.” For each test case in these evaluation runs, there will be a task in the respective annotation project. The overview page lists completed and in-progress annotation projects with their respective progress. Users can choose to directly start annotation or view the task dashboard.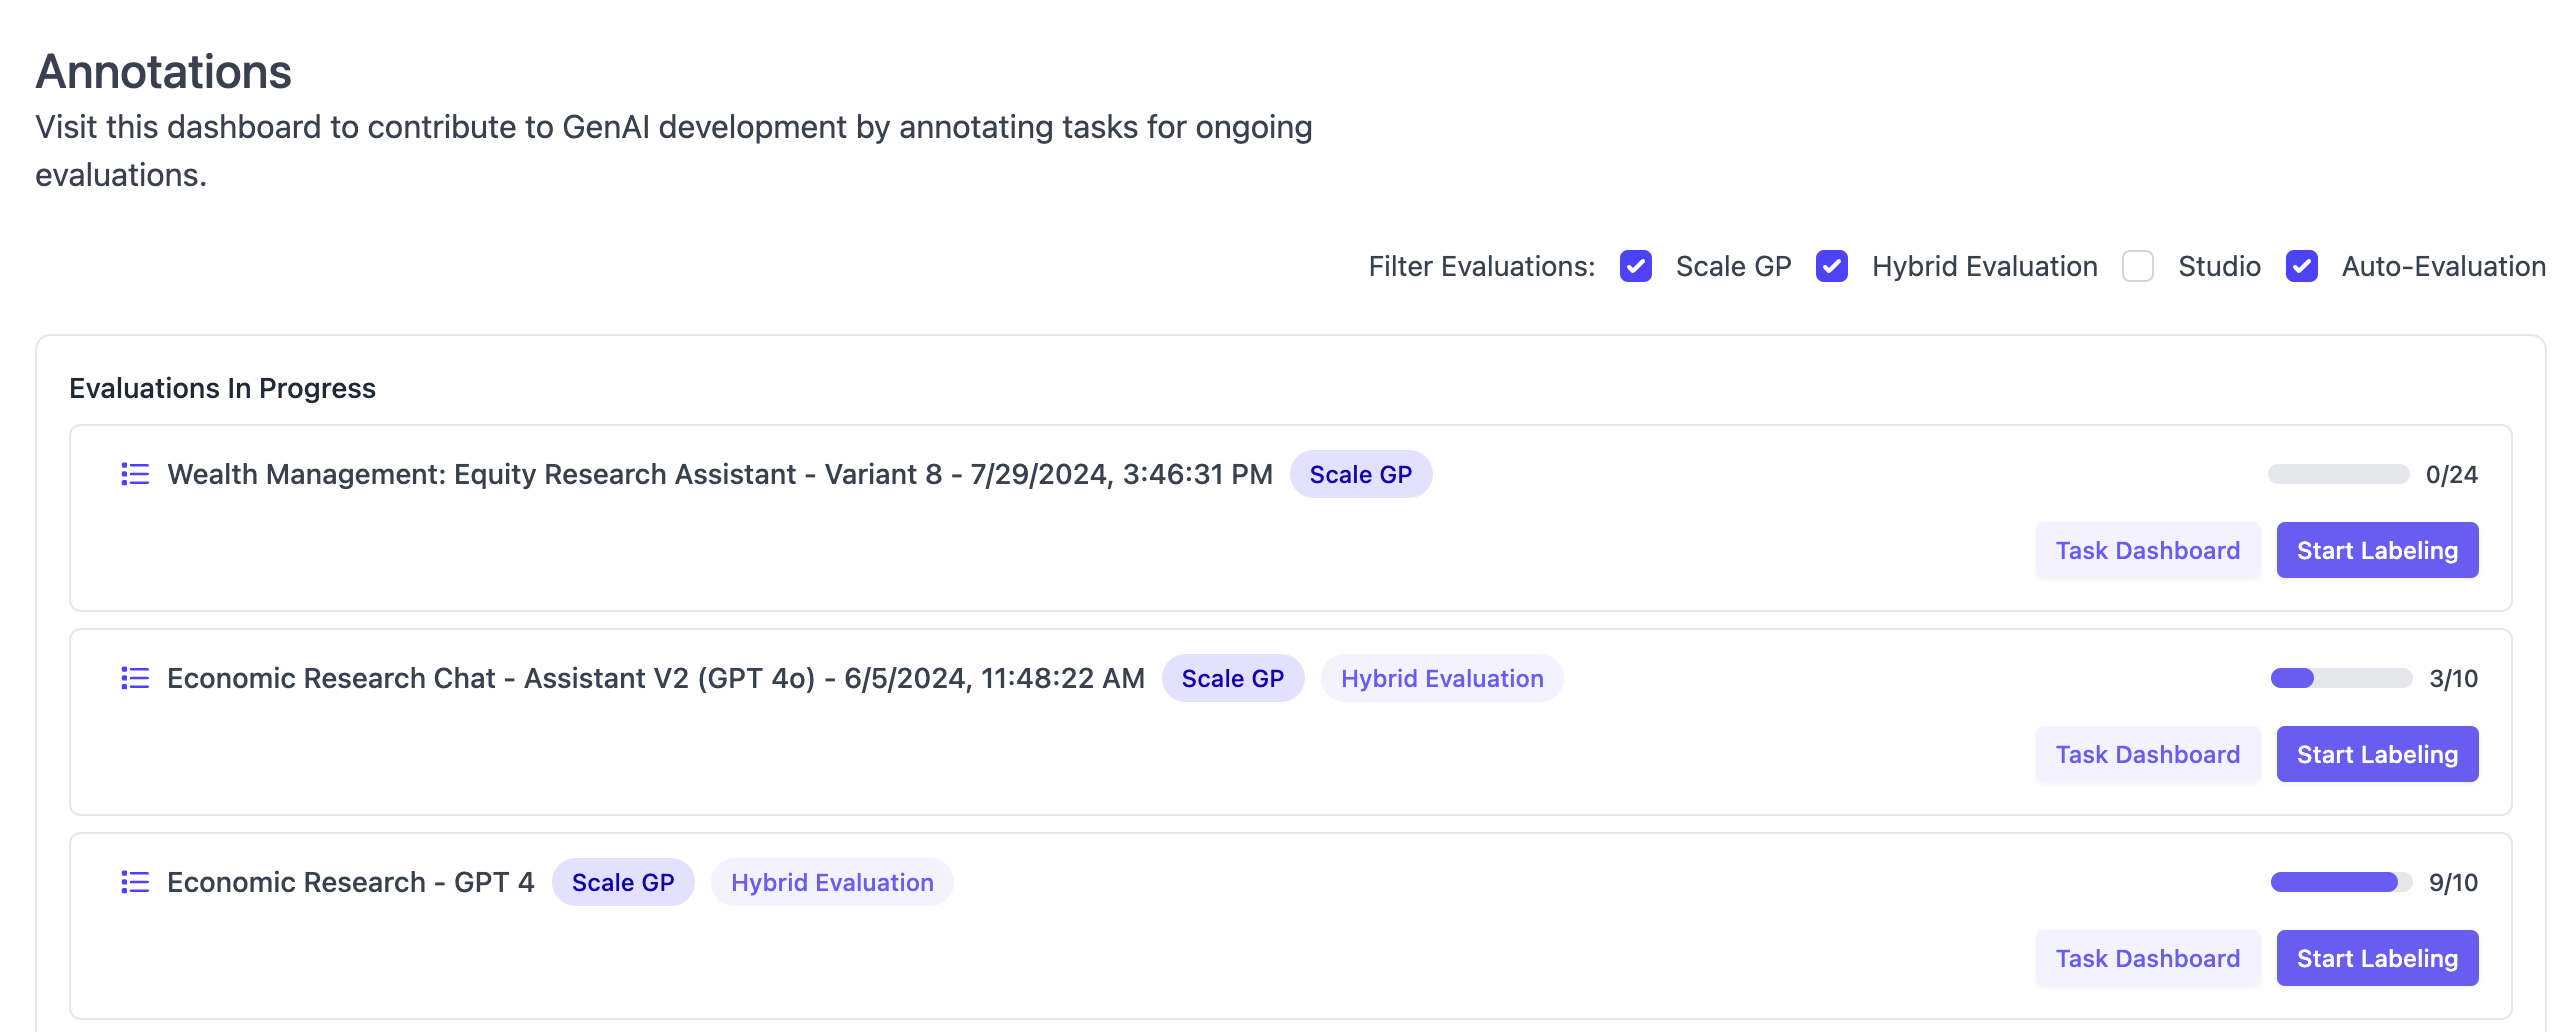
Task Dashboard
The task dashboard provides an overview of all tasks in the given annotation project. Each task is listed with status, metadata, assigned contributor, and other metrics. The “contributor metrics” tab provides basic insight into the efficiency of all human contributors on this specific annotation project.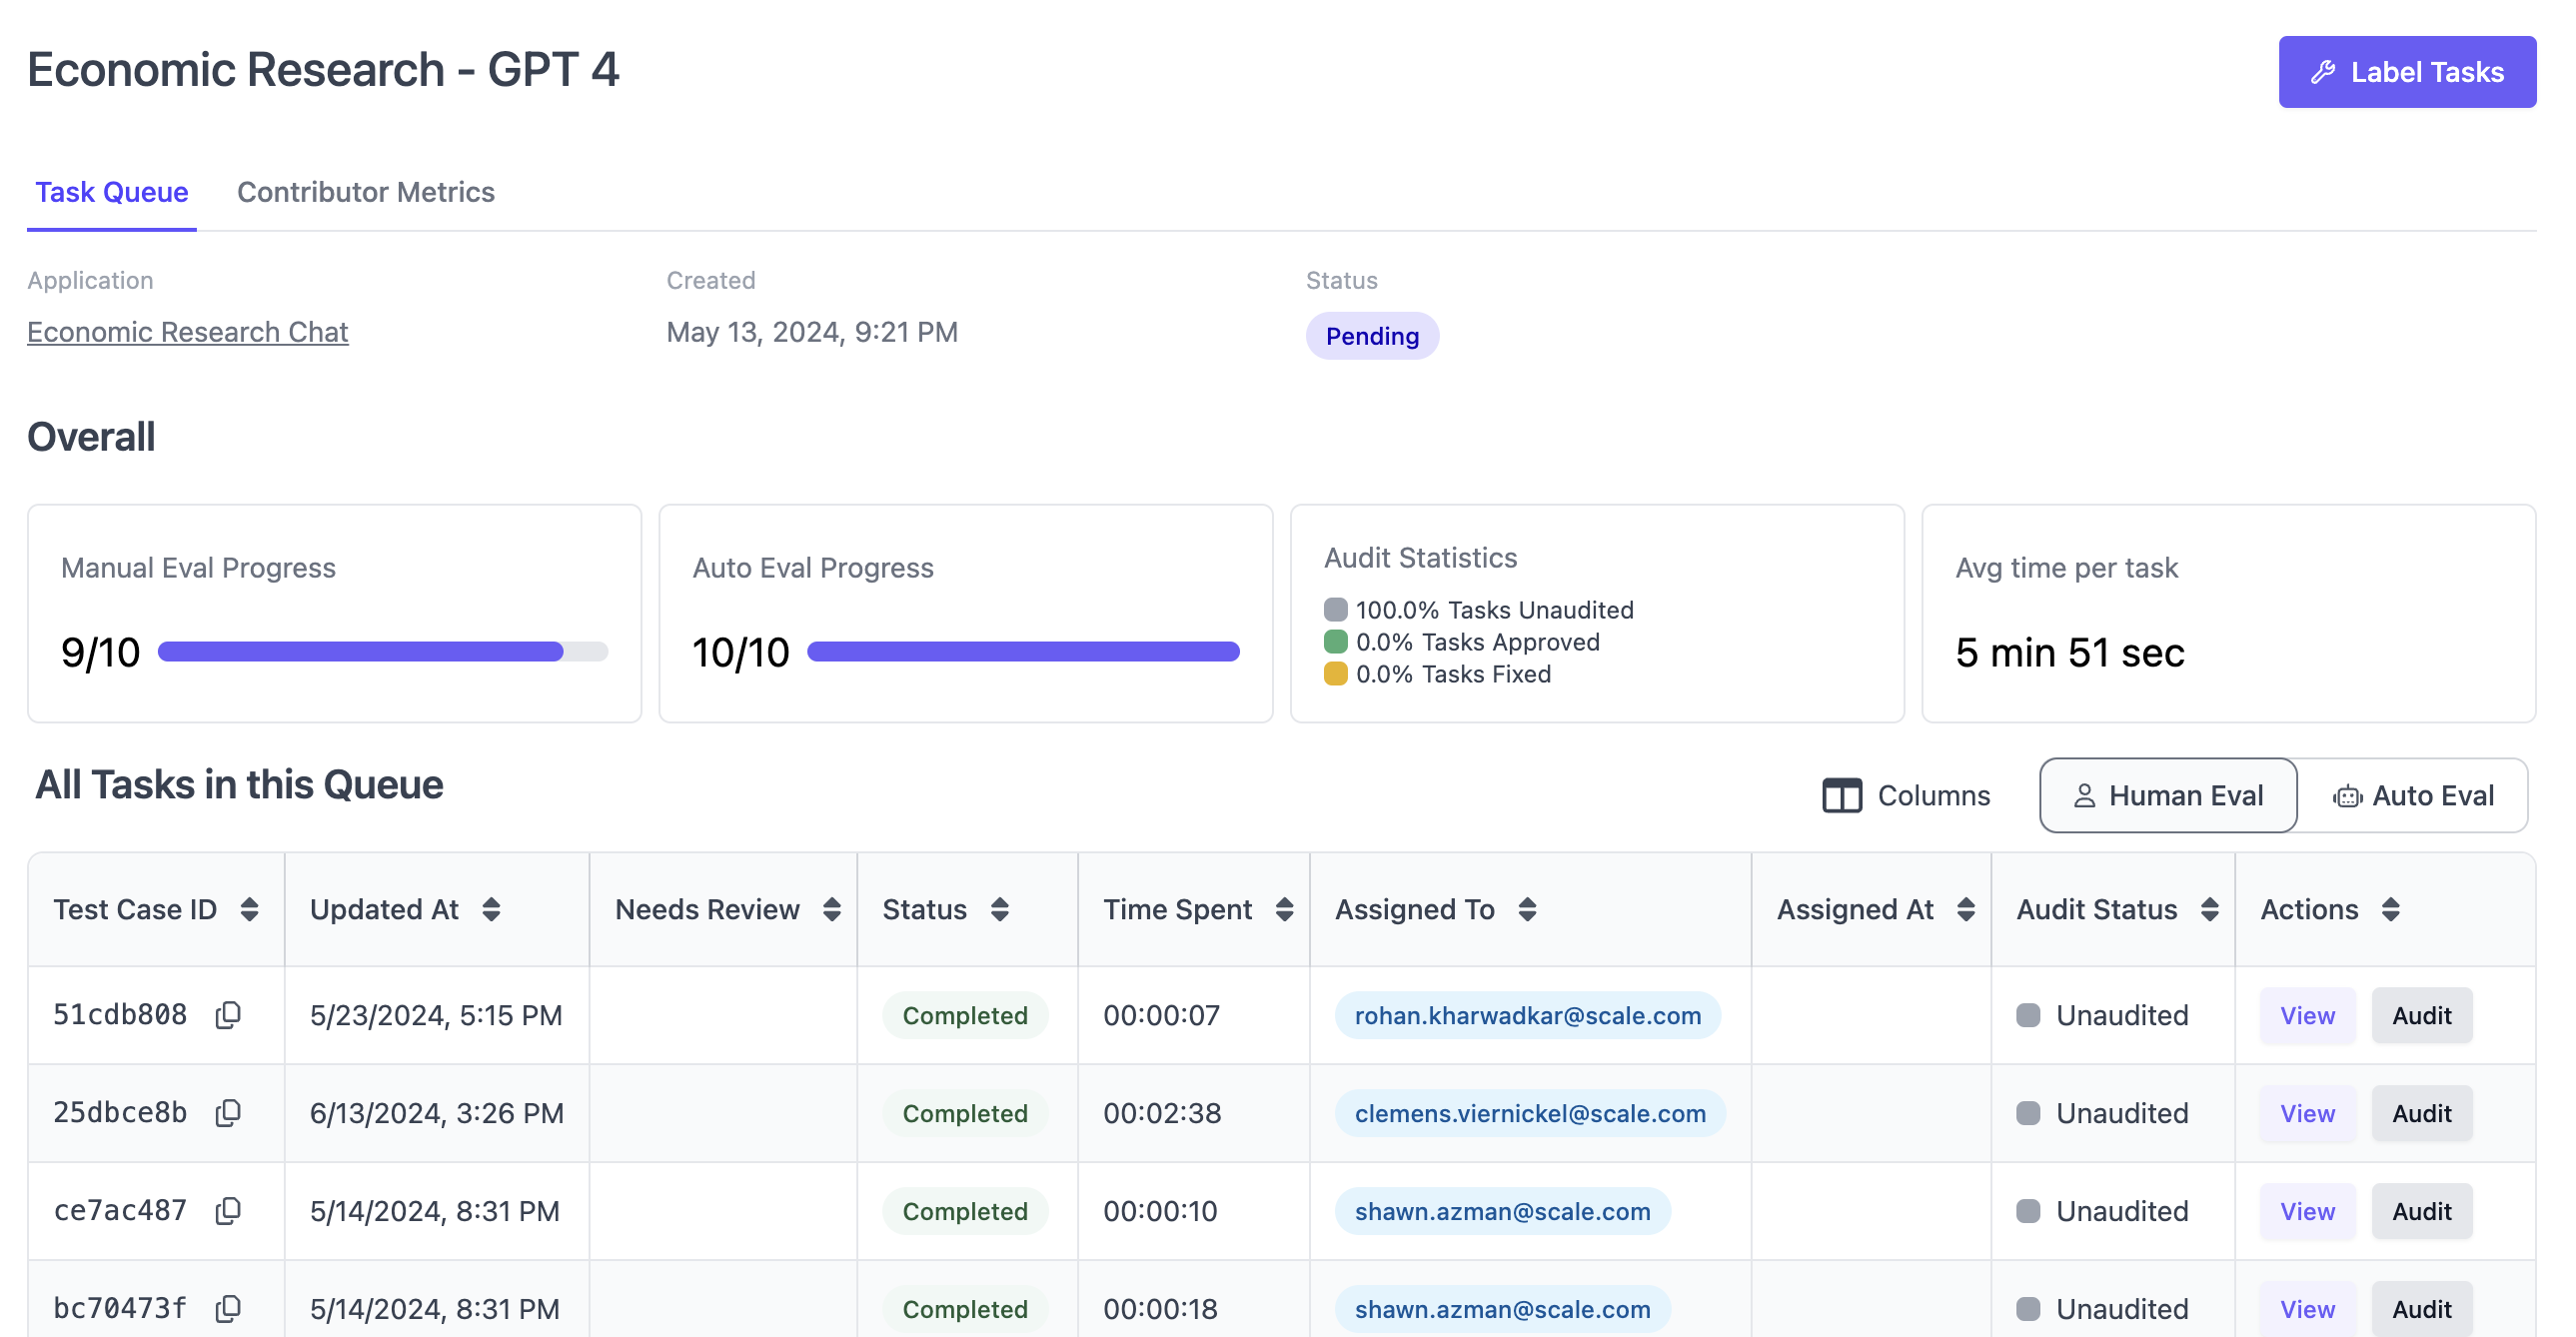
Label Tasks
When a user selects “Label Tasks,” they are redirected to the “task view” to start completing annotation tasks for evaluation projects, which are assigned to them by the queue. The layout of the task view may change based on the type of application being evaluated. Users complete the evaluation rubrics and move to the next task, optionally flagging tasks with a comment if necessary.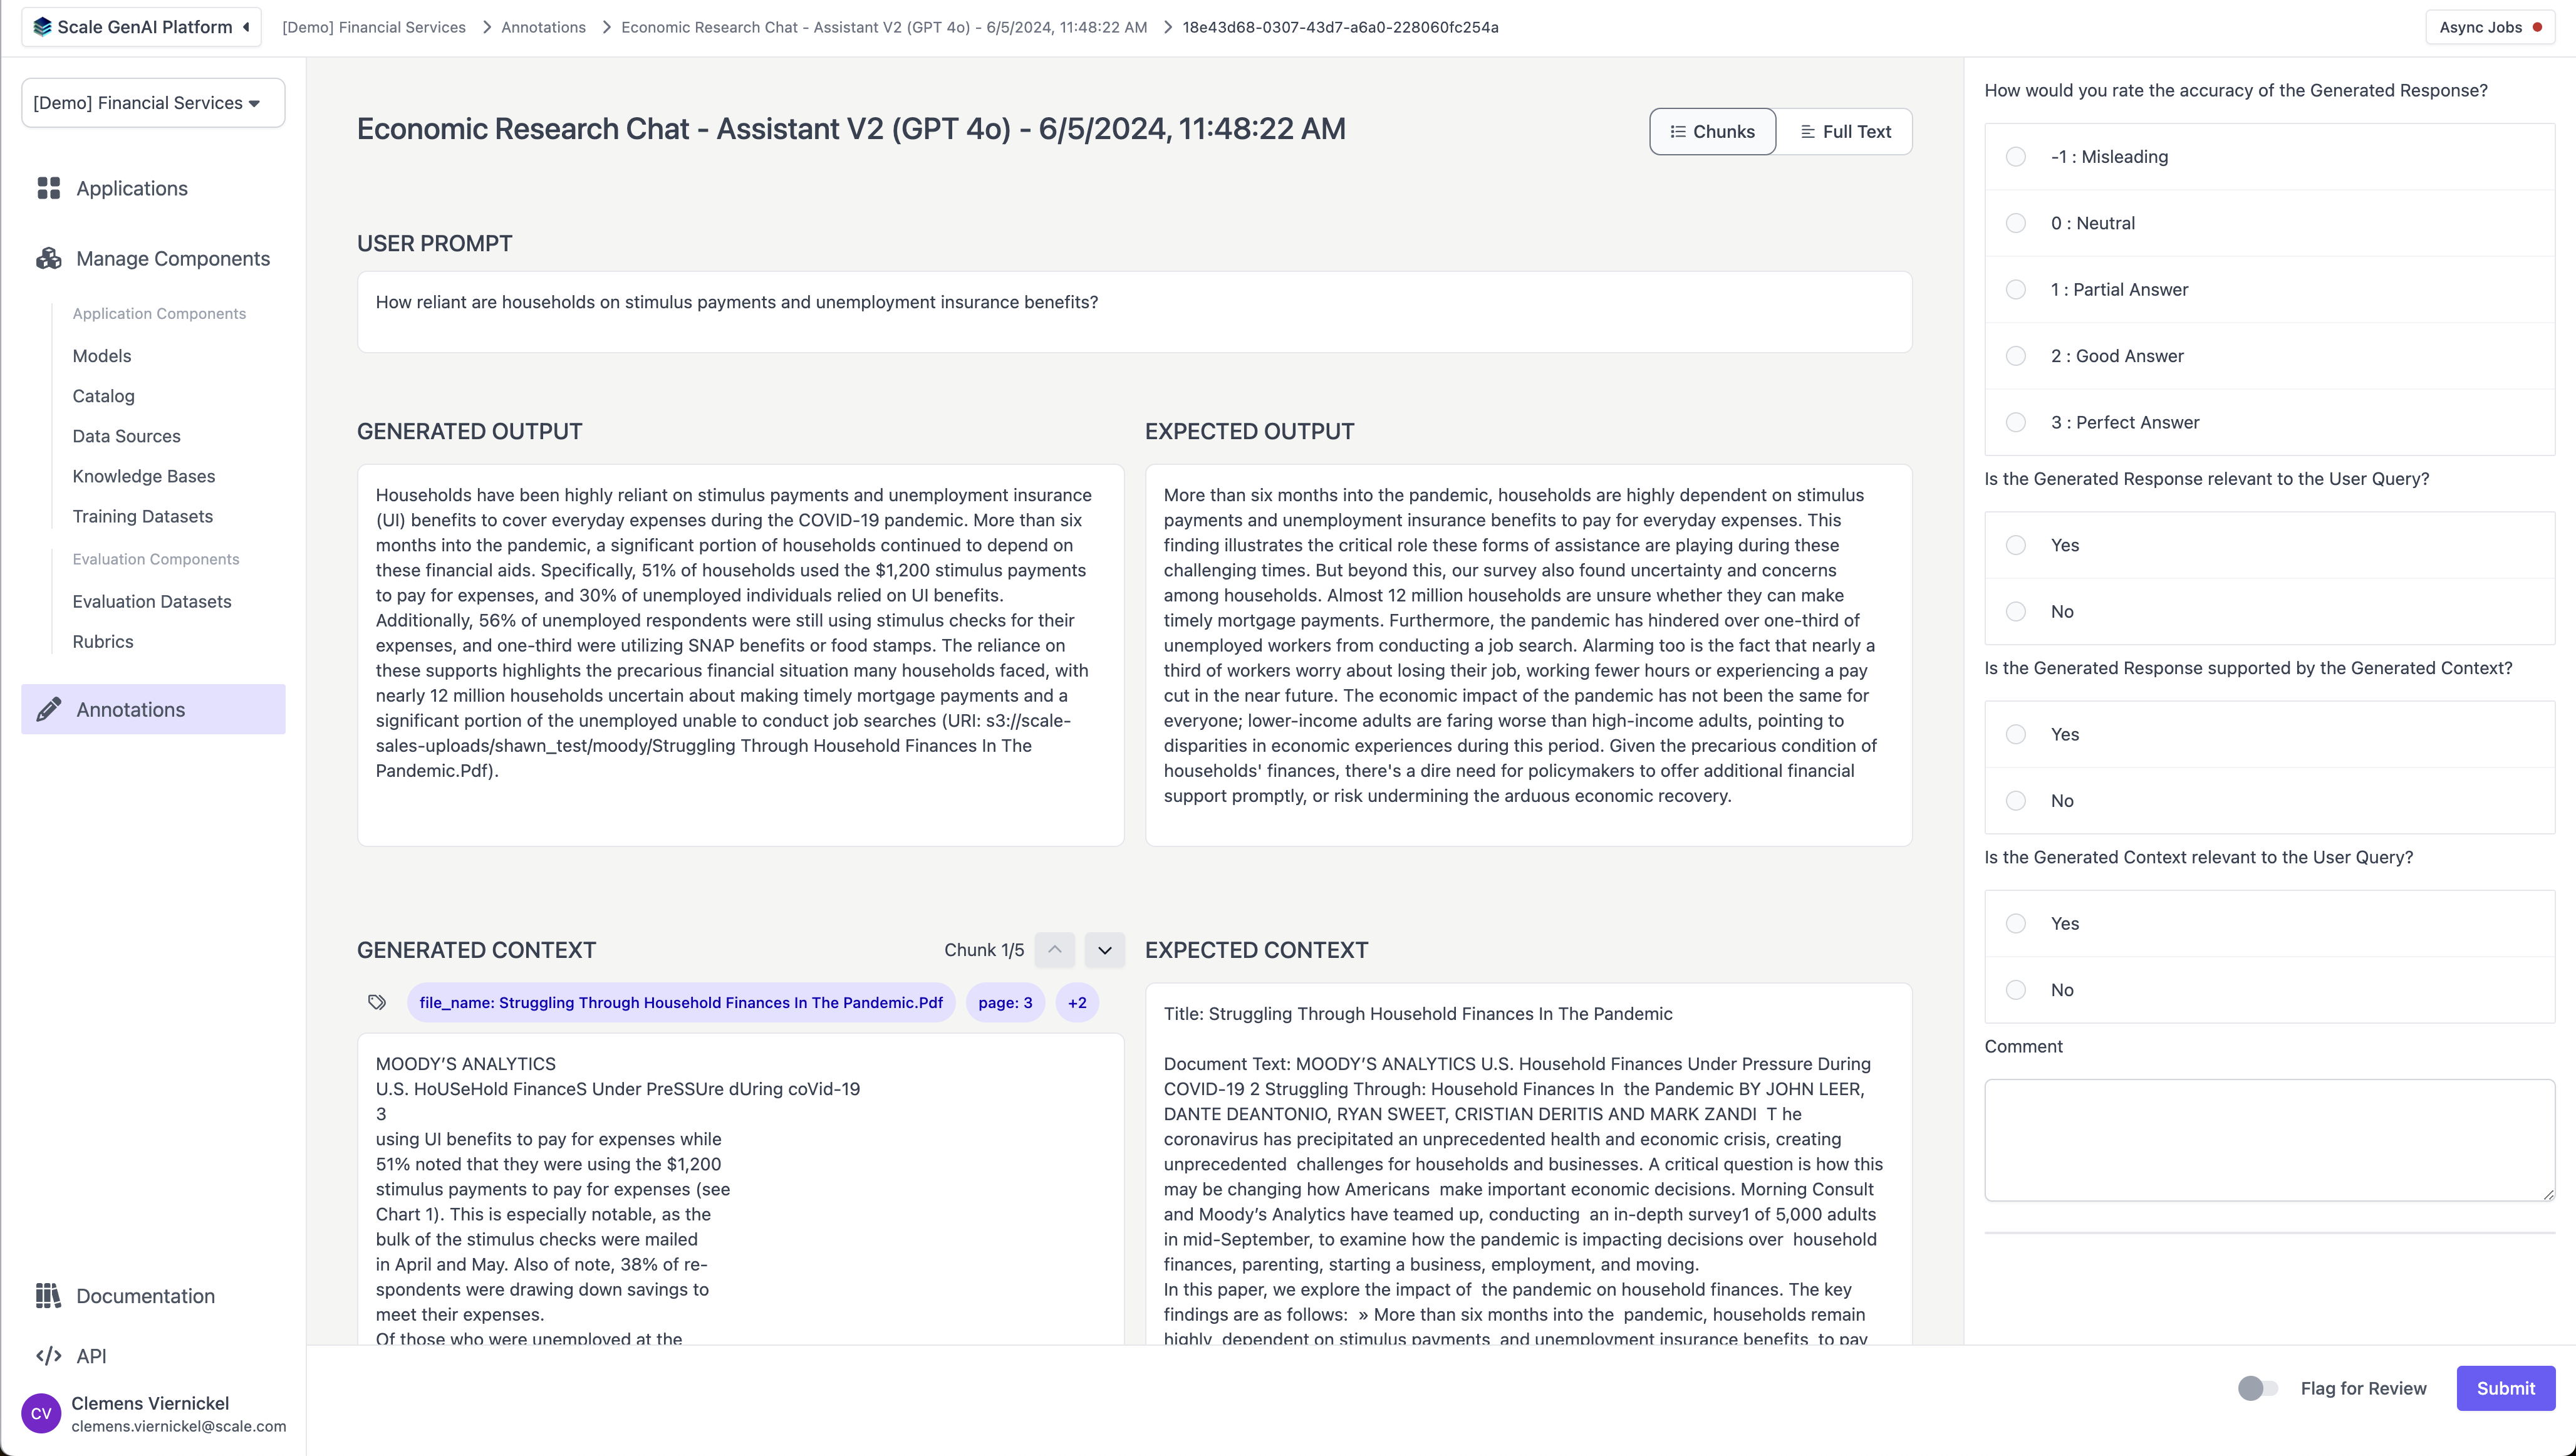
Audit Tasks
From the task dashboard, users can start to audit tasks, which leads to a variant of the “task view,” with the difference that the auditor can see the responses of contributors or LLM judges for each of the evaluation rubrics and can “approve” or “fix” the respective task based on business needs.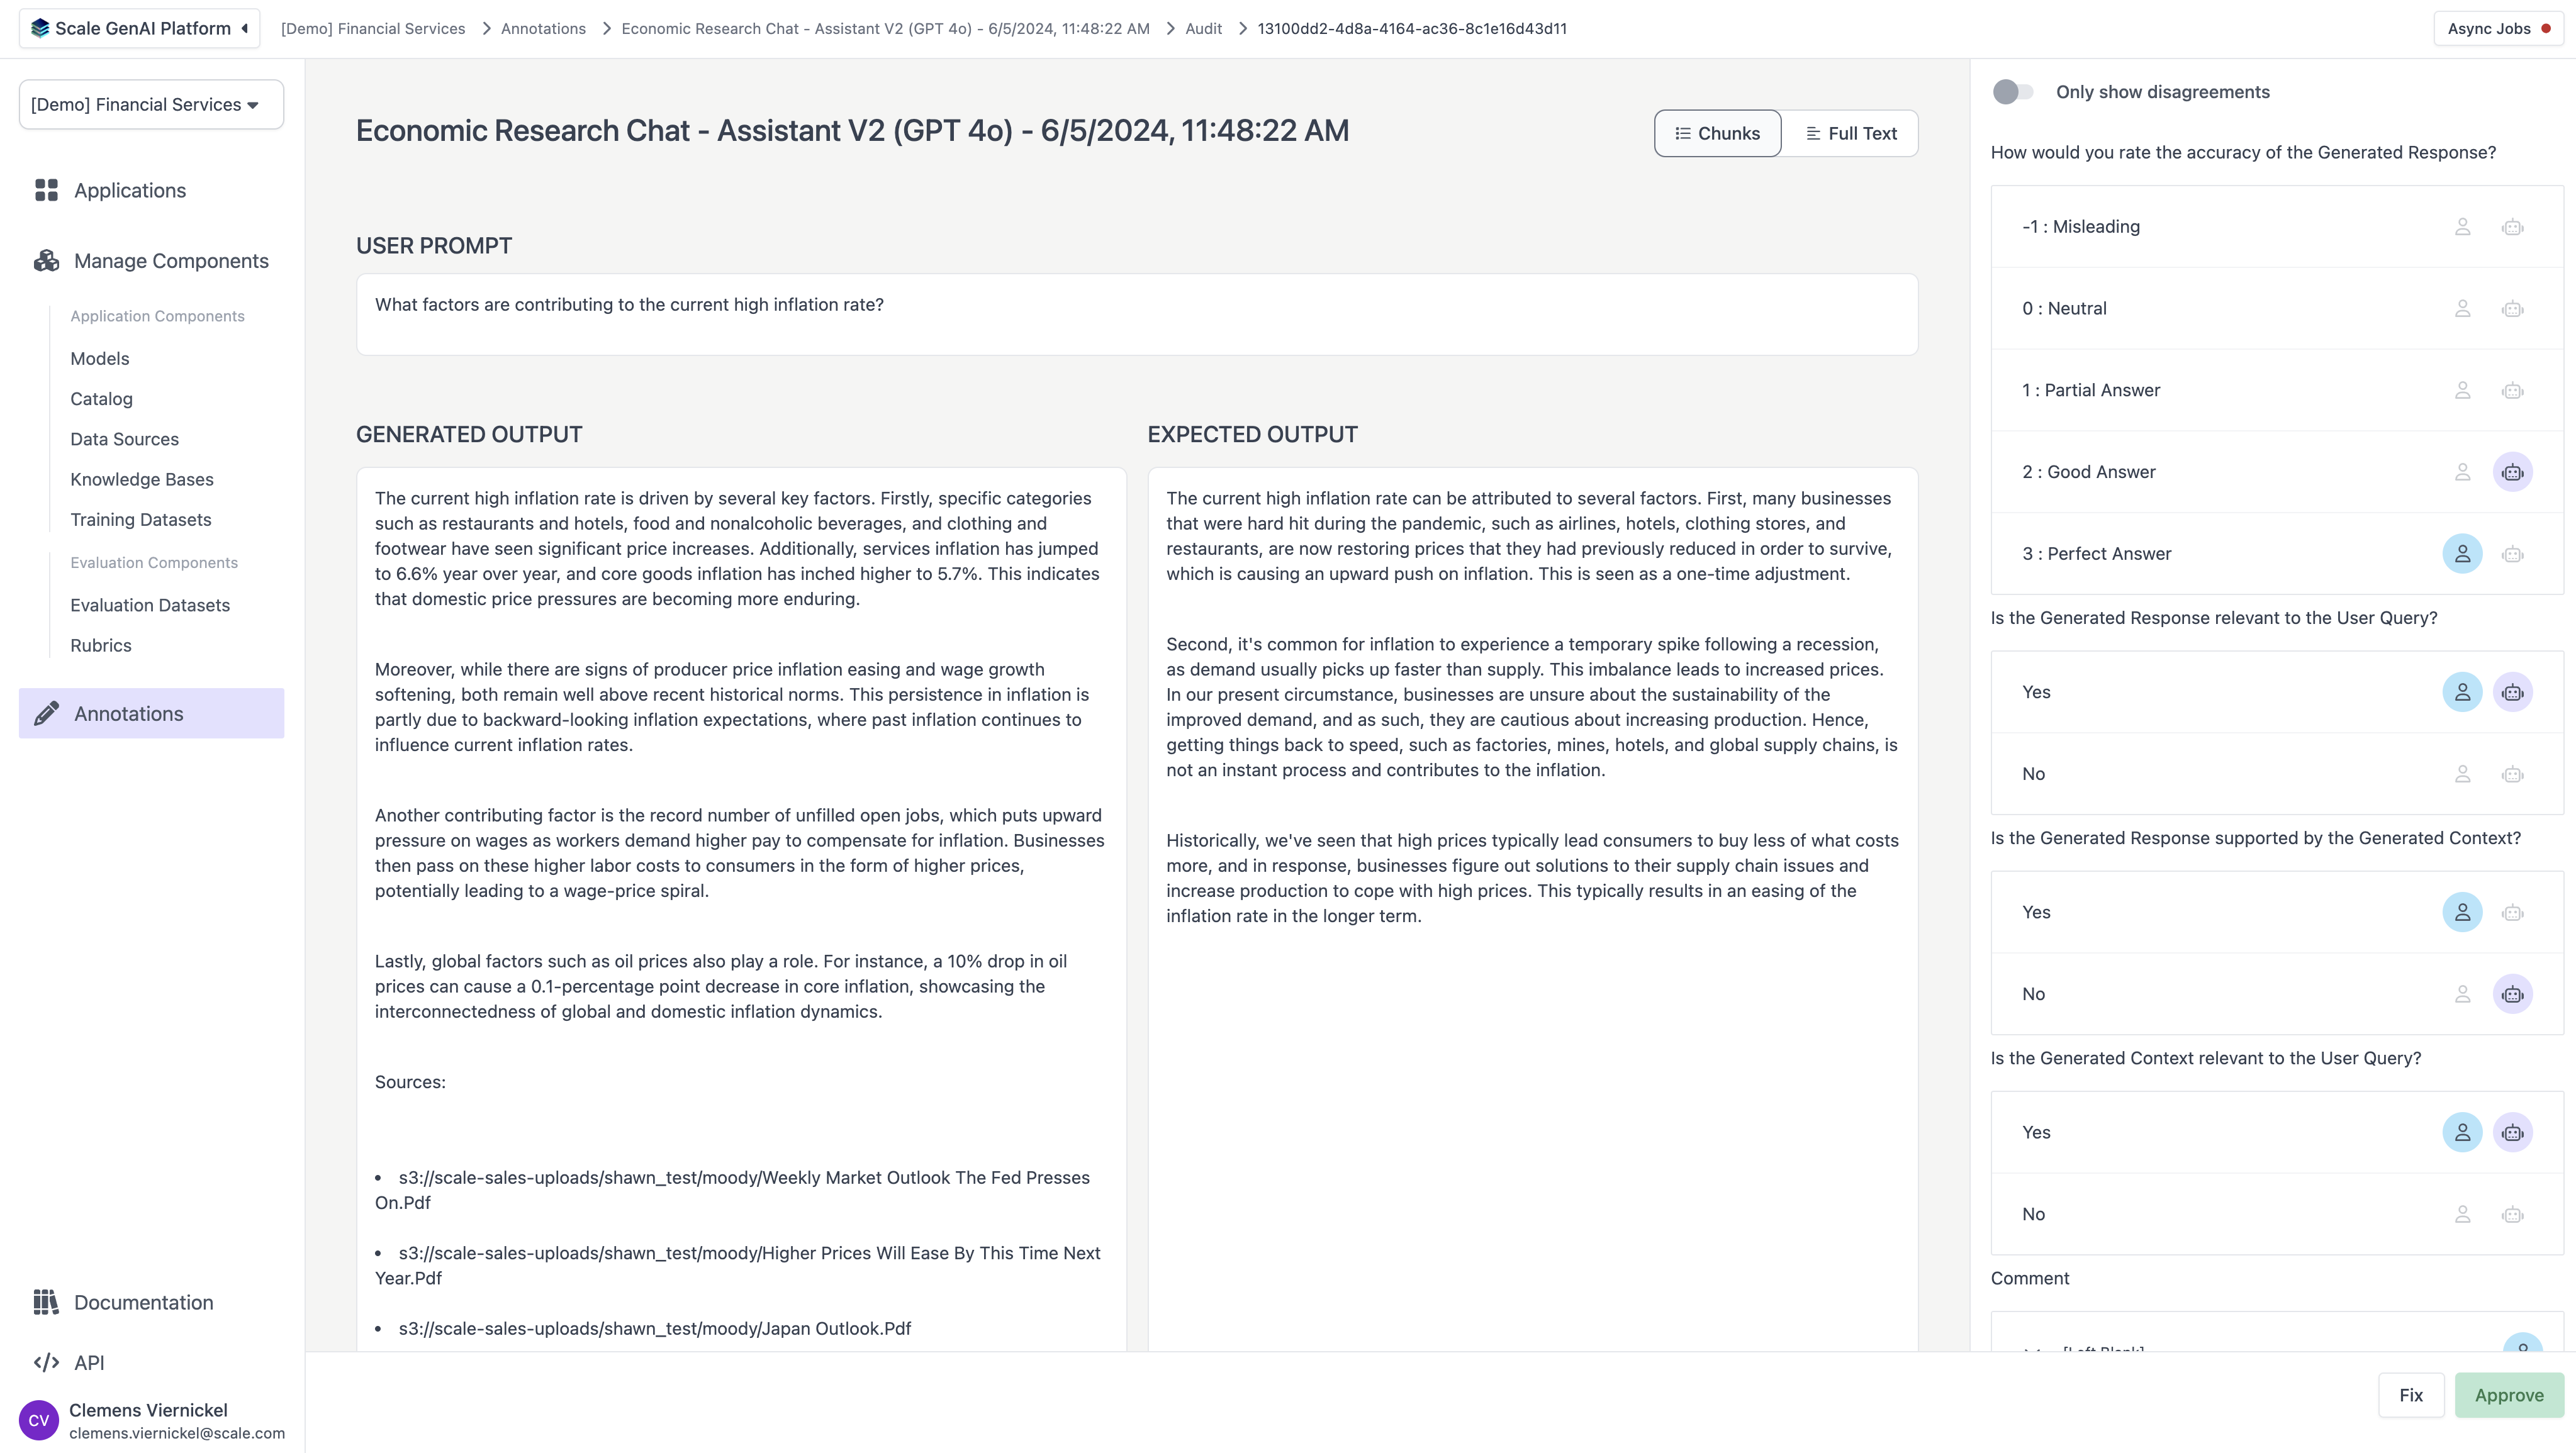
Async Jobs
Via the button in the top left corner, users can access a list of asynchronous jobs, including model fine-tuning, knowledge base uploads, and auto-evaluation pipelines.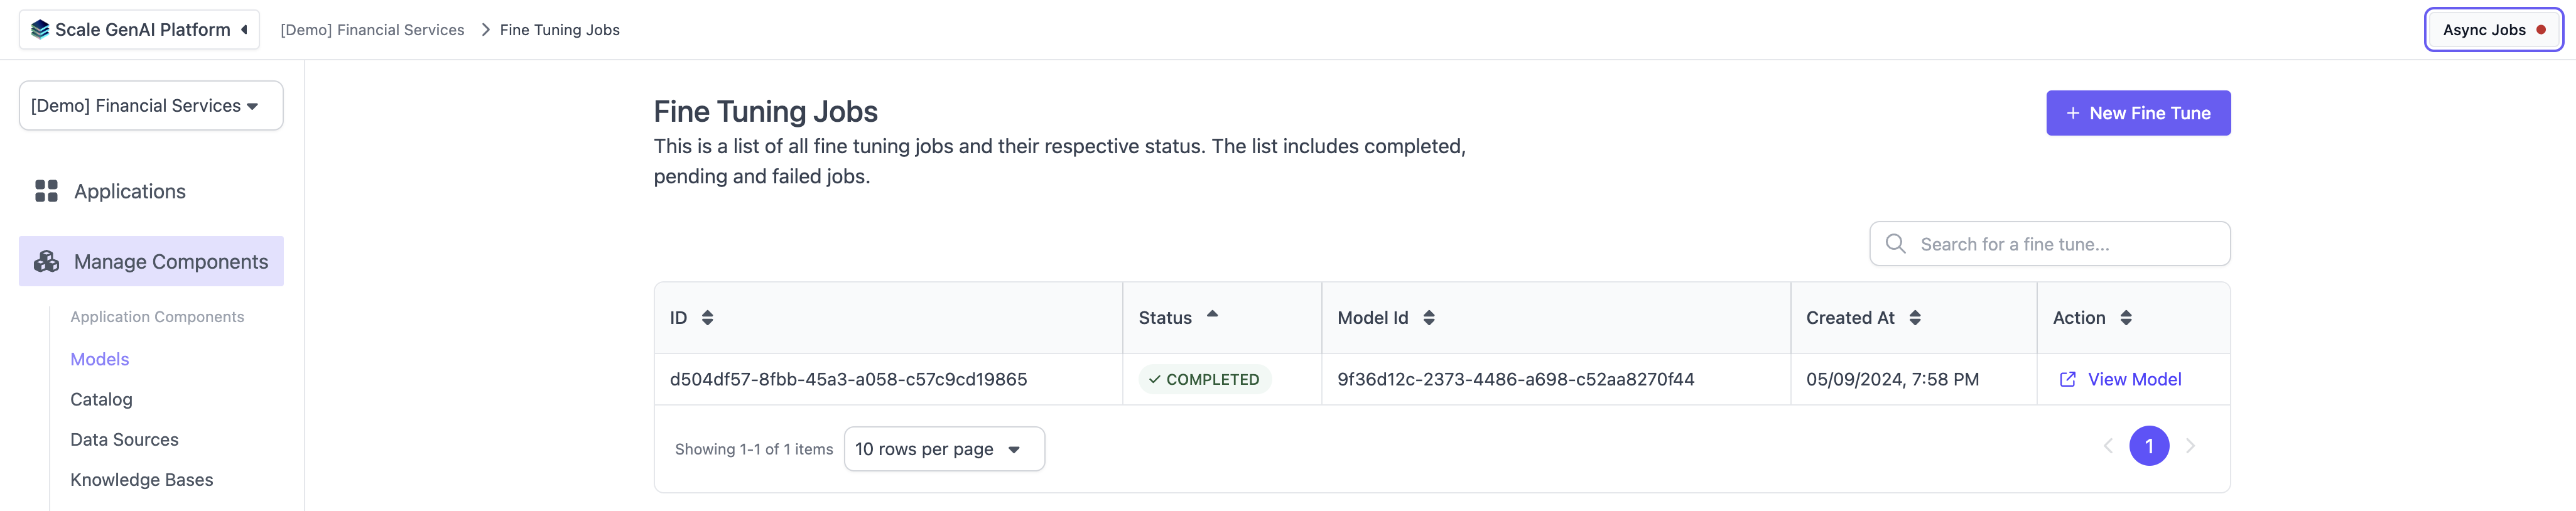
Account Actions
The context menu for account actions is located in the bottom left corner of the screen. It provides access to three functions: manage accounts, API key, and profile.