v25.3.1
v25.3.0
Version 25.3.0
04/08/2025New Features
Annotators Can Edit Tasks
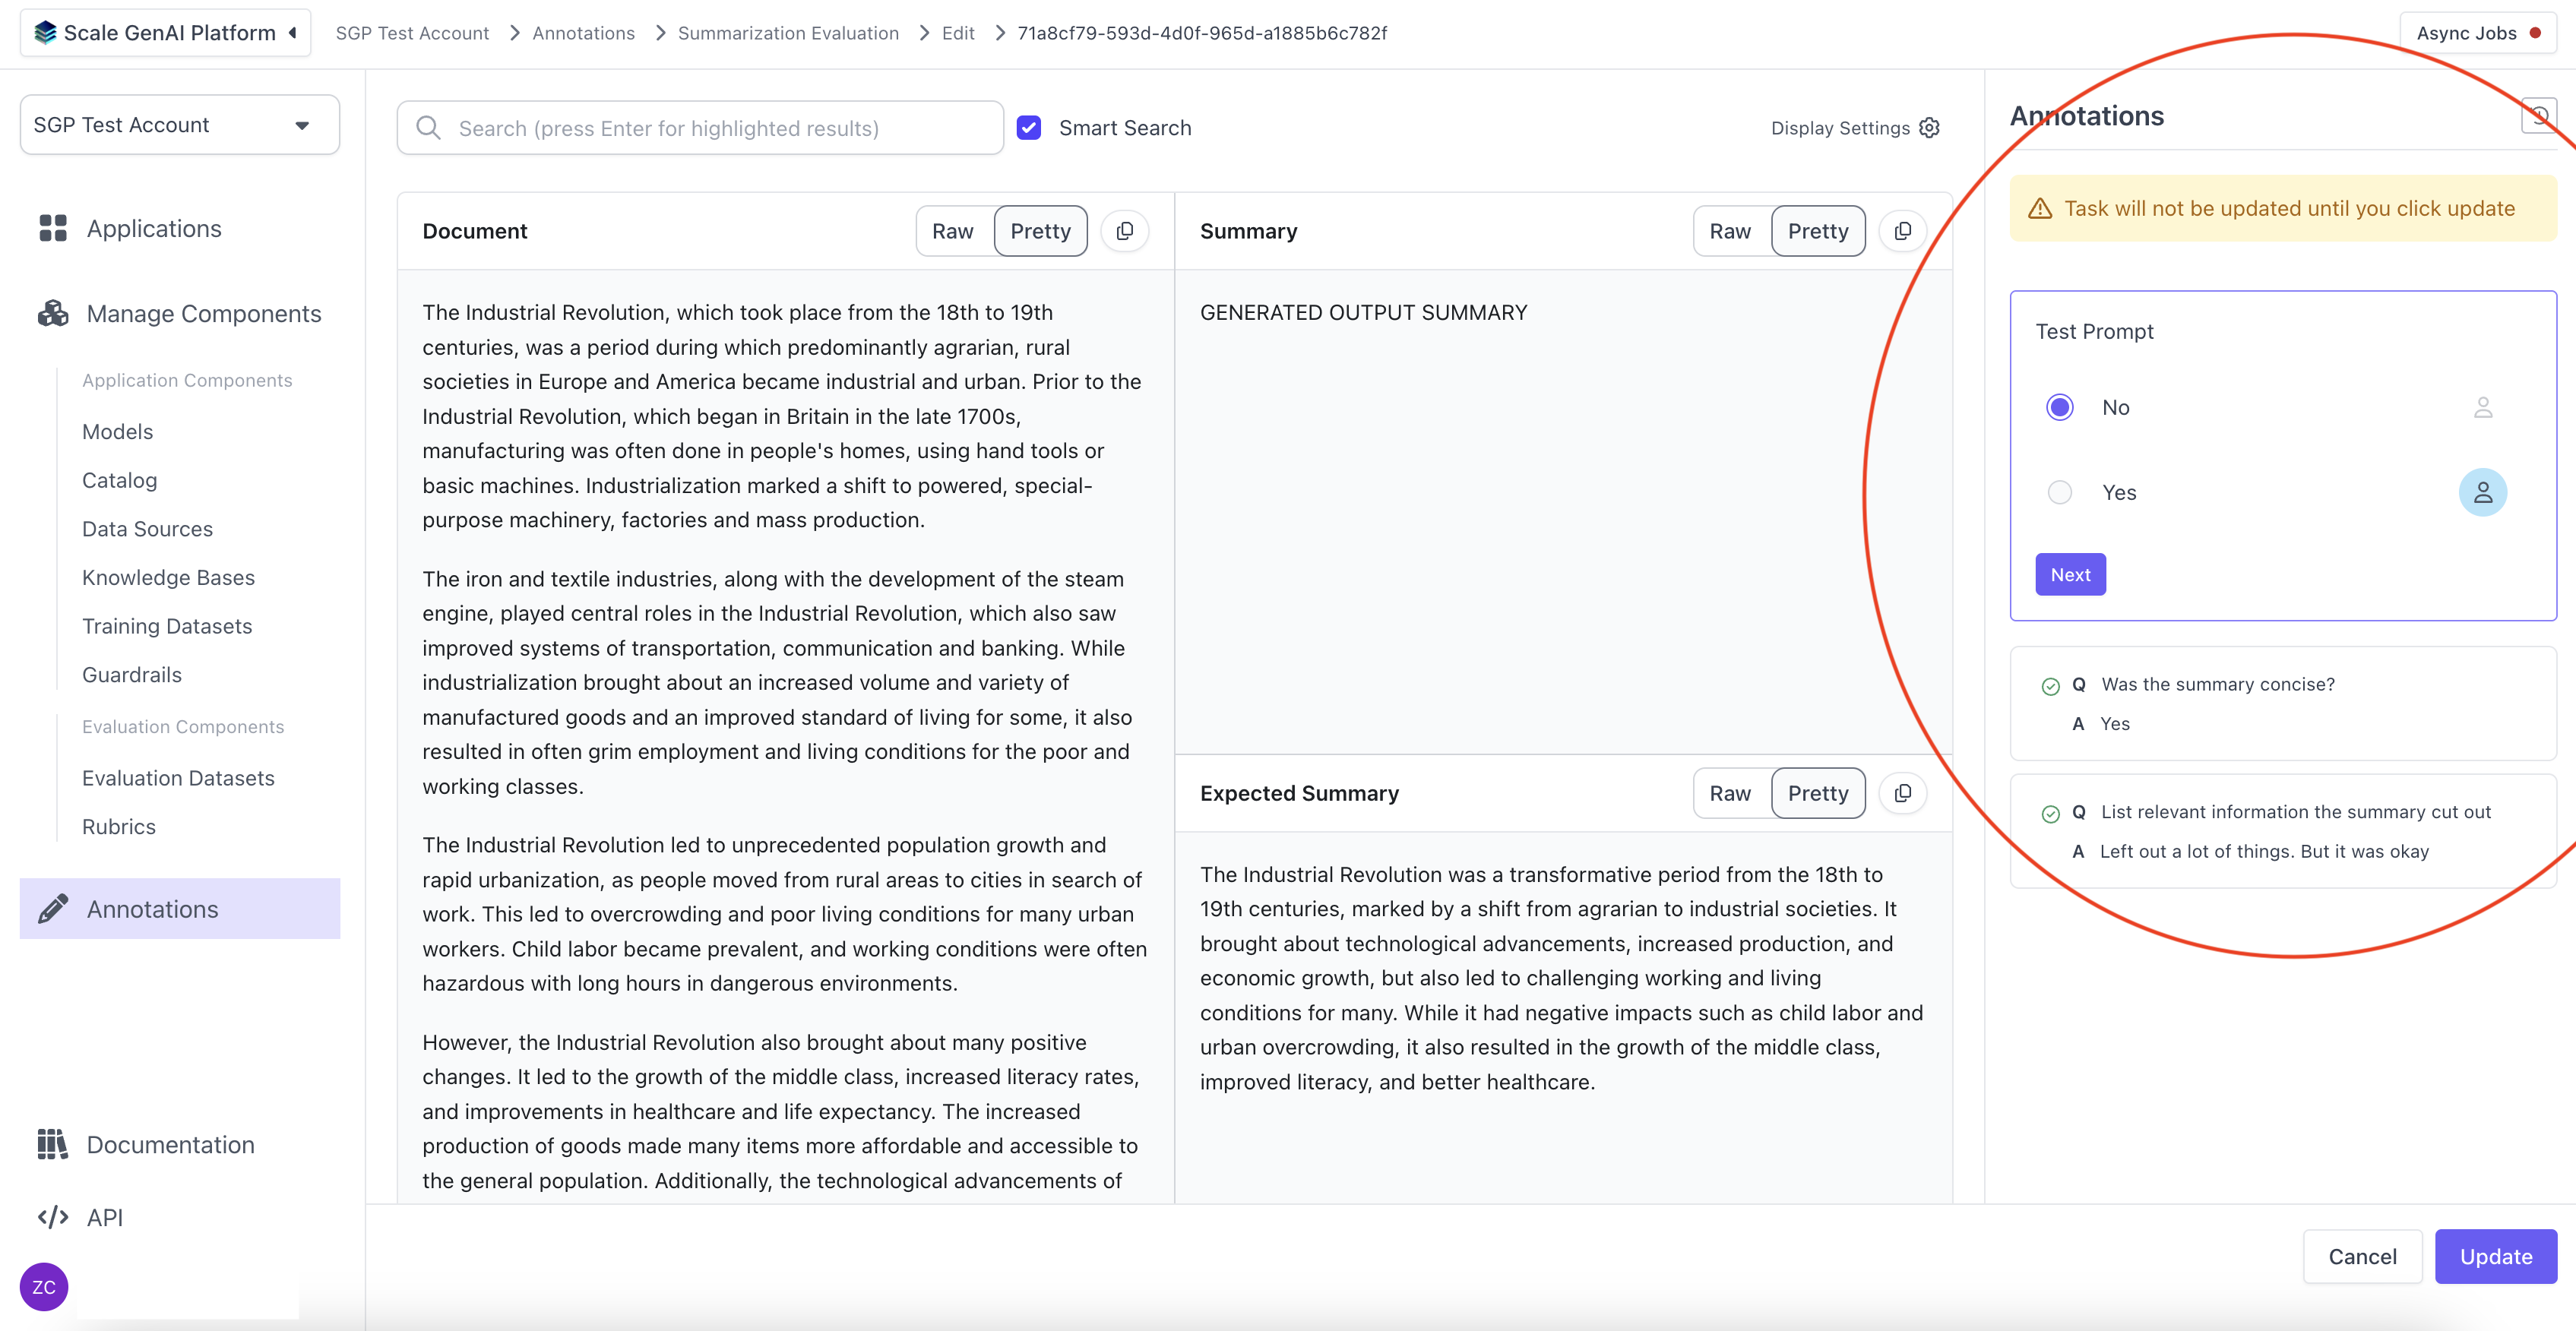
Annotators can now edit tasks that have been completed prior to the tasks being audited. Annotators will not be able to edit tasks that have been audited. Click Edit on a completed task.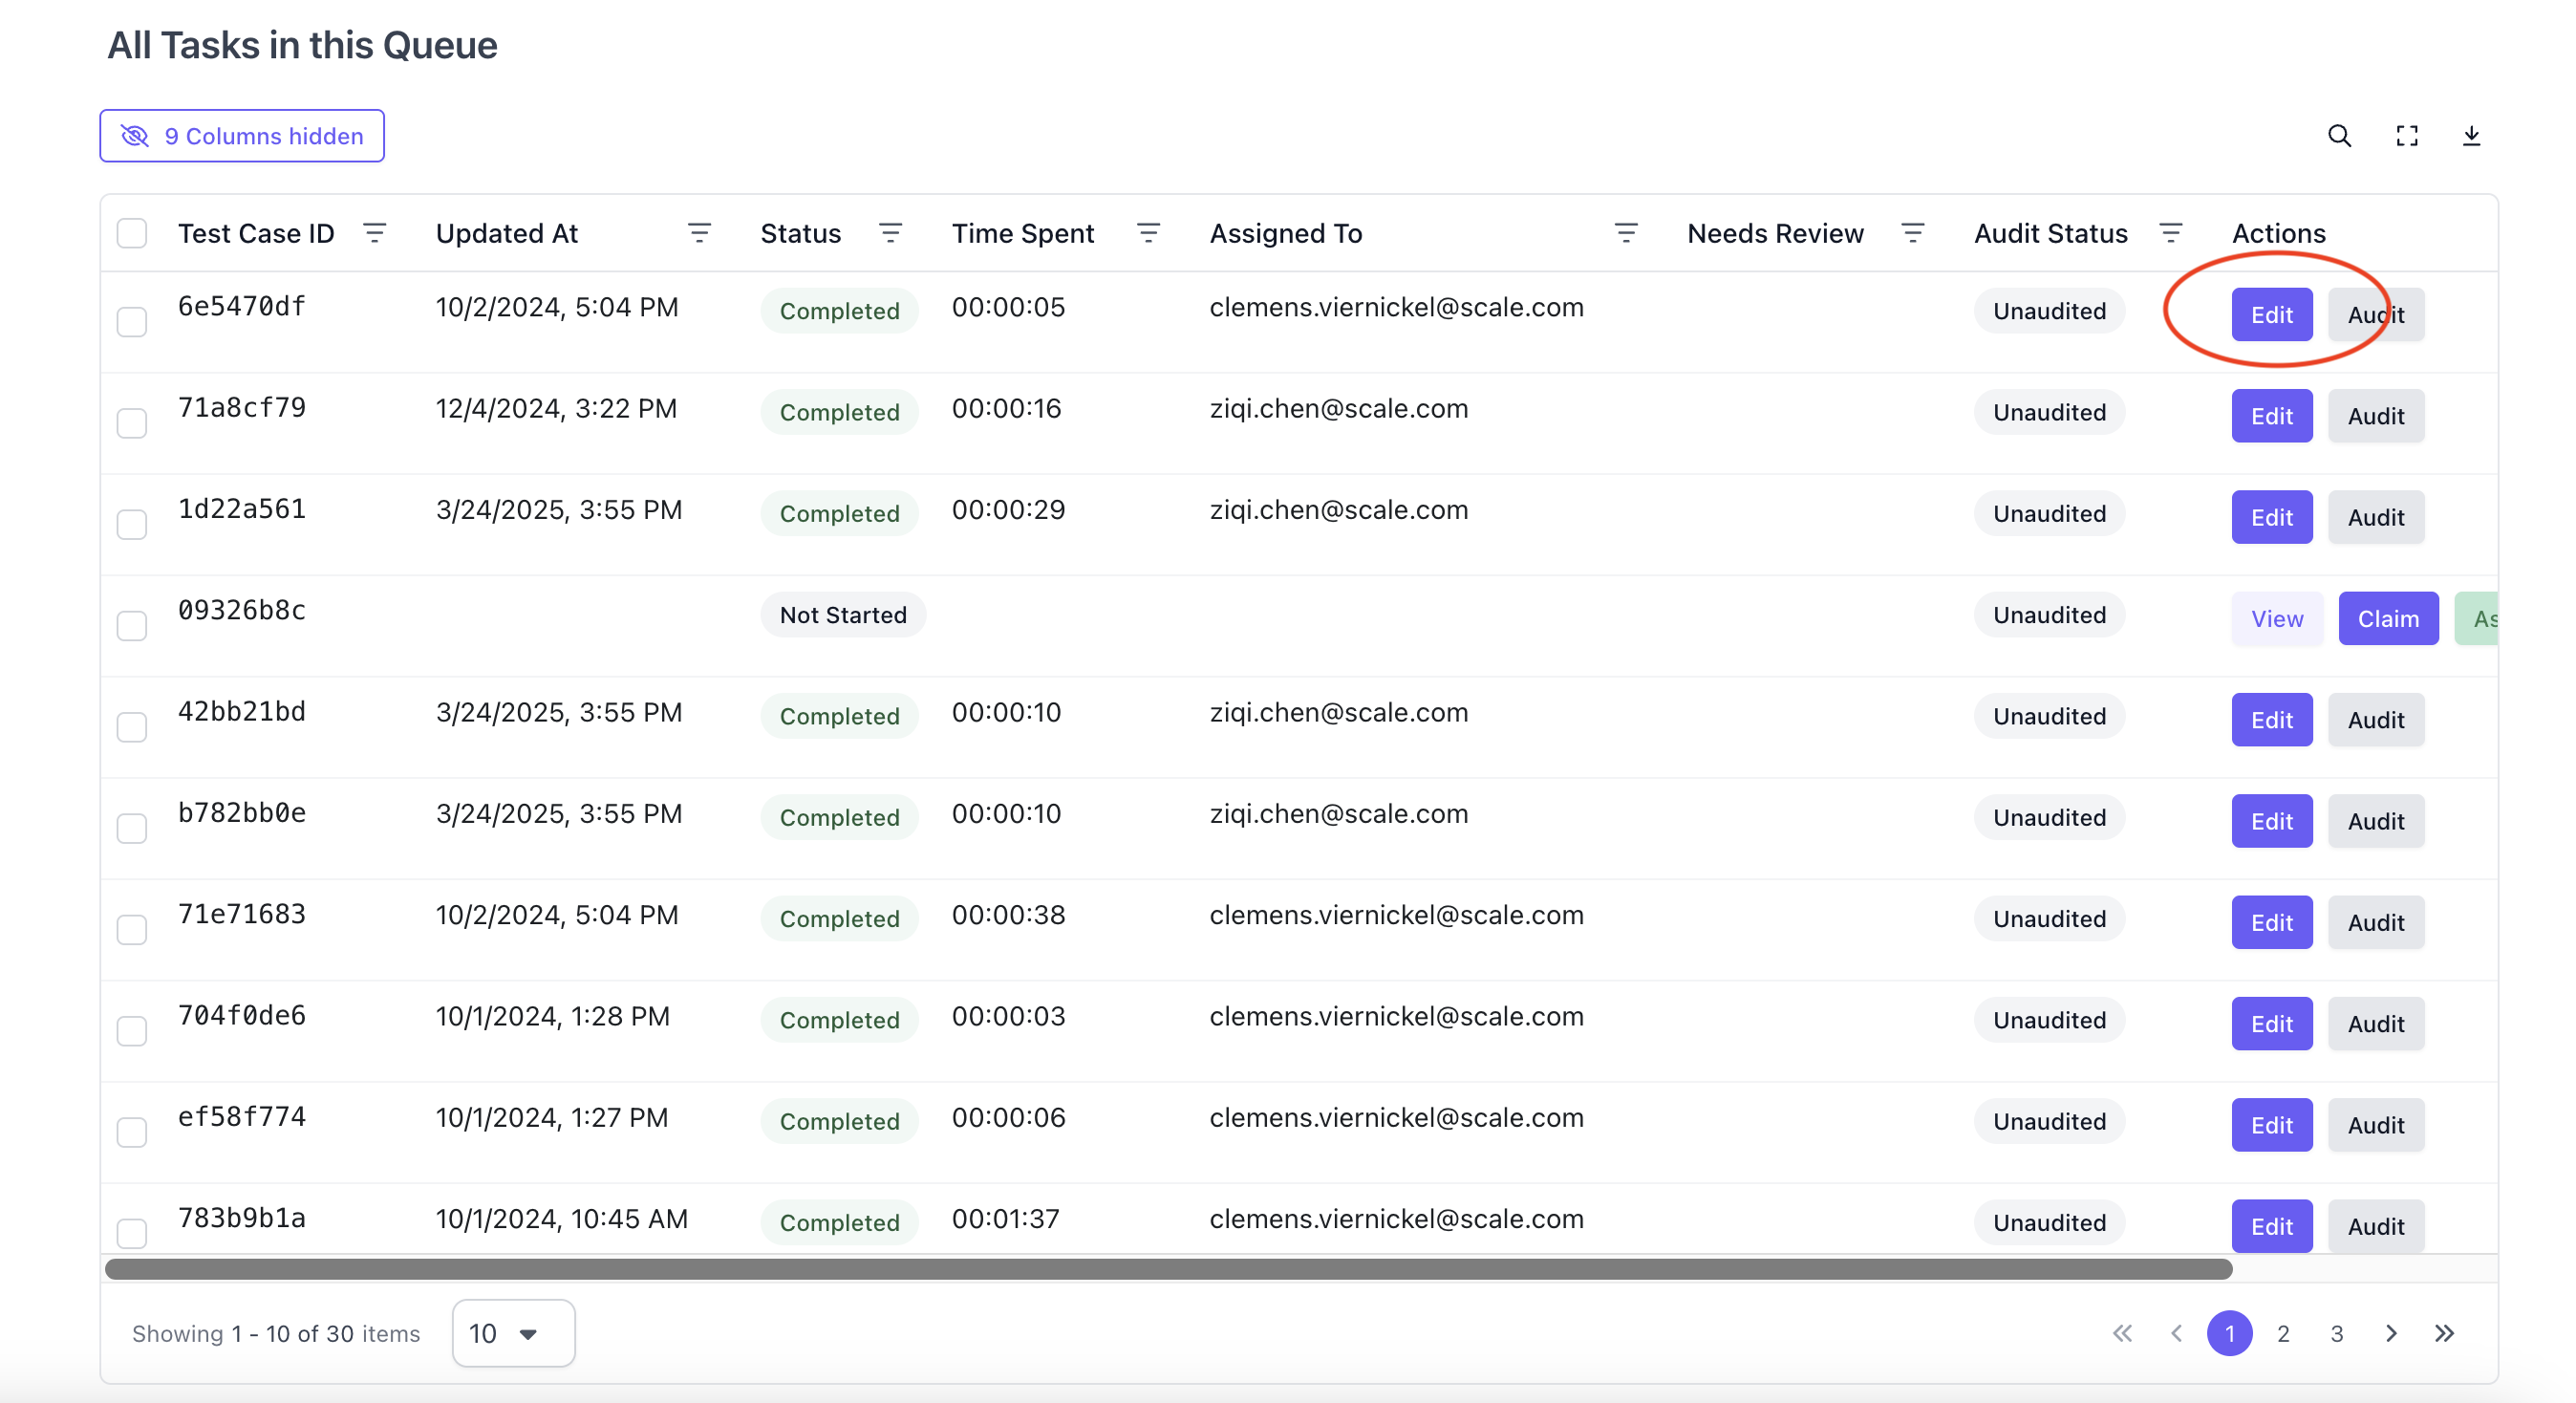
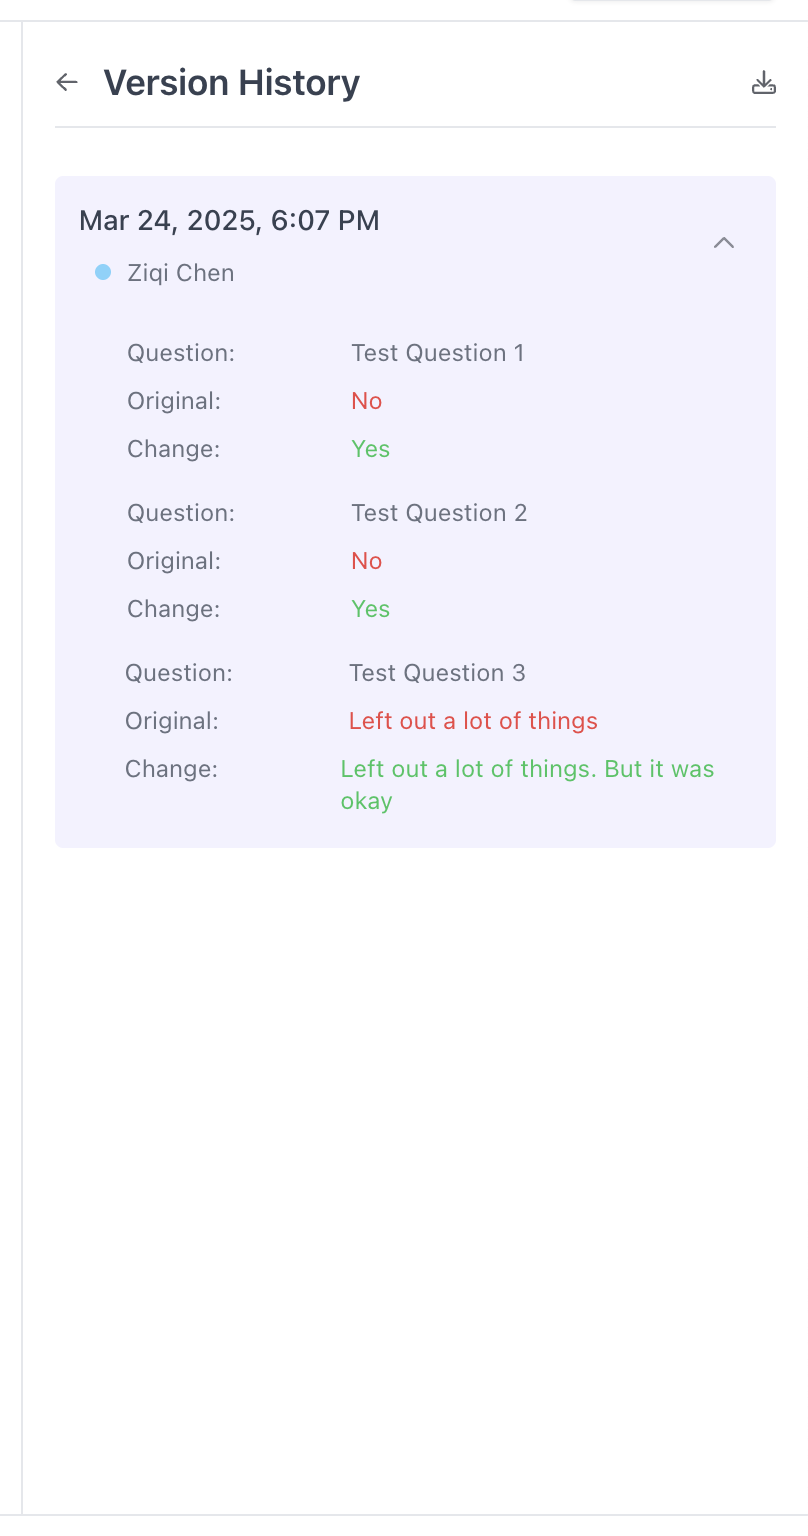
Version History
Users can see the version history of all tasks. The version history shows all edits and fixes that have been made from audits.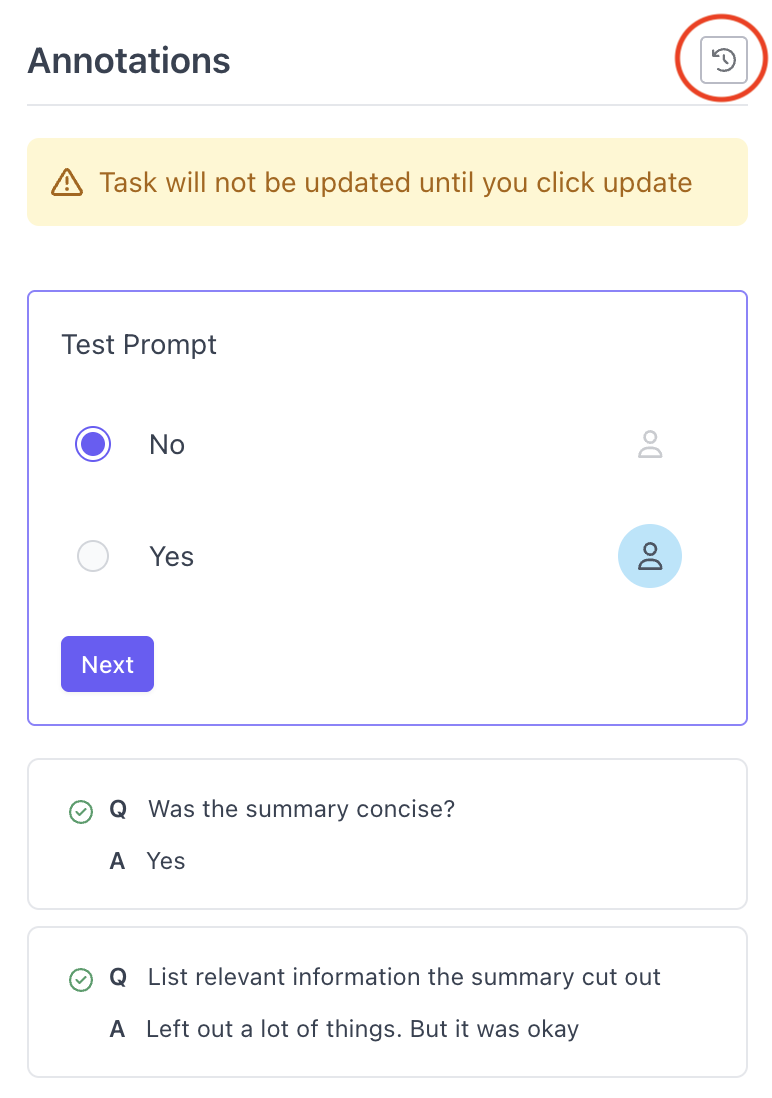
Multi-Stage Auditing
The platform now supports two stages of auditing. Each audit stage must be done by different users. A user will only be able to perform a first stage audit after a task is complete. A user will only be able to perform a second stage audit after another auditor has completed the first stage audit.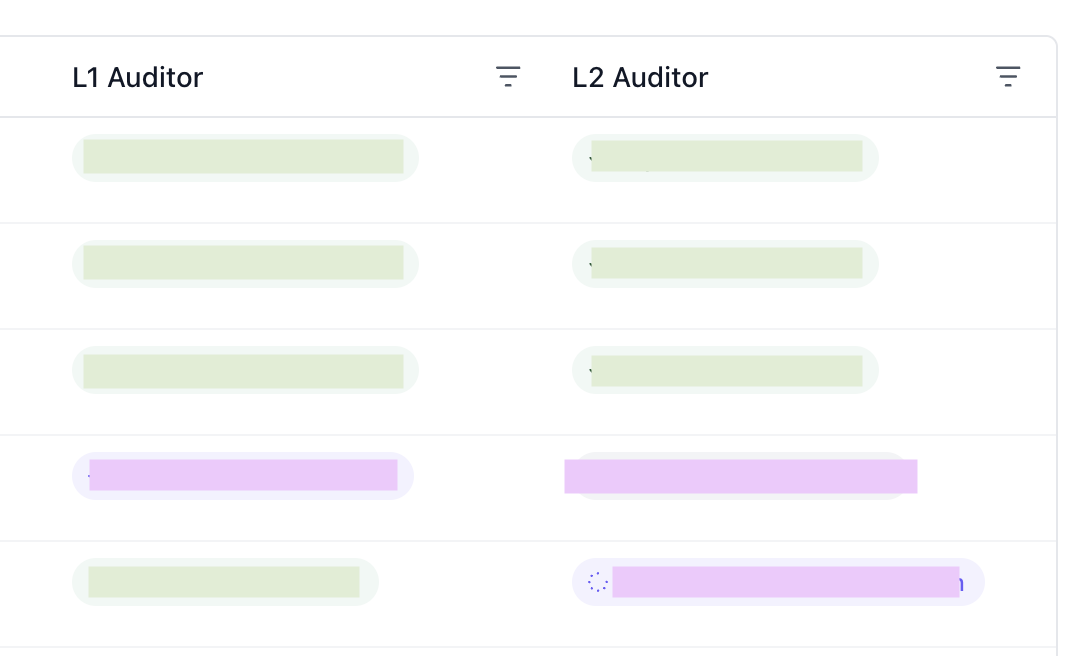
Assigning Auditors and Auditing Queue
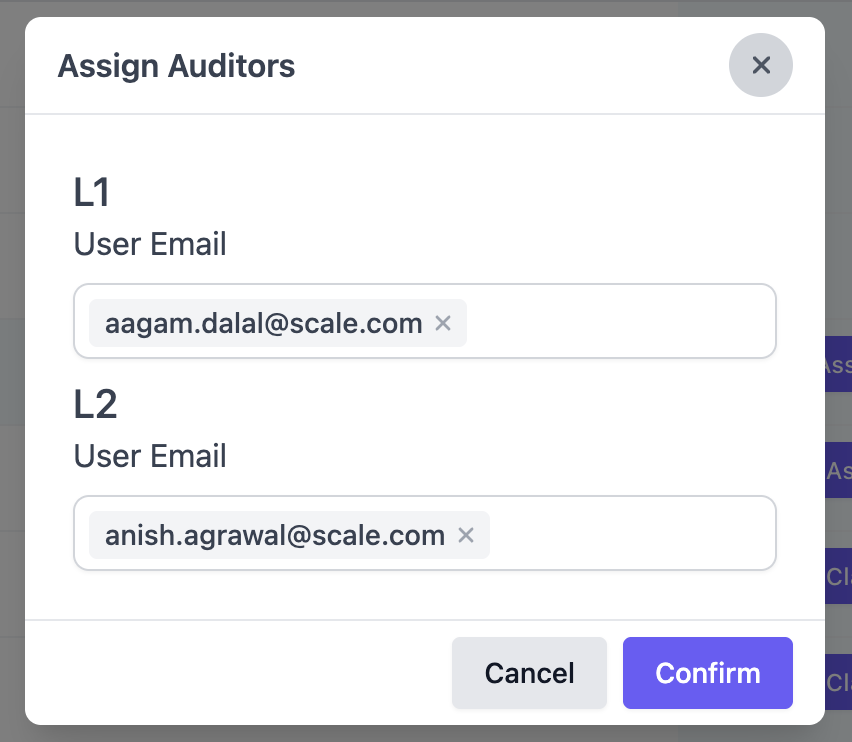
Managers can now assign users to be auditors for a certain task. A user cannot be assigned as both an L1 and an L2 auditor for a specific task.Just like the task queue for annotators, there is a general audit queue and a queue for each individual auditor.When a user is assigned a task for auditing, the task will be added to their personal queue. However, a task is only eligible for L1 audit if it has been labeled and L2 audit if it has been audited once already. When a user selects “Start Auditing”, it will first take eligible tasks off of their personal queue. If their personal queue is empty, it will take eligible tasks off the general queue.Assign Auditors
Click “Assign Auditors” to assign an auditor to a task.
Clicking Audit Tasks
If a user has permission to Audit tasks, they can see the Audit Tasks button.
Minor Features
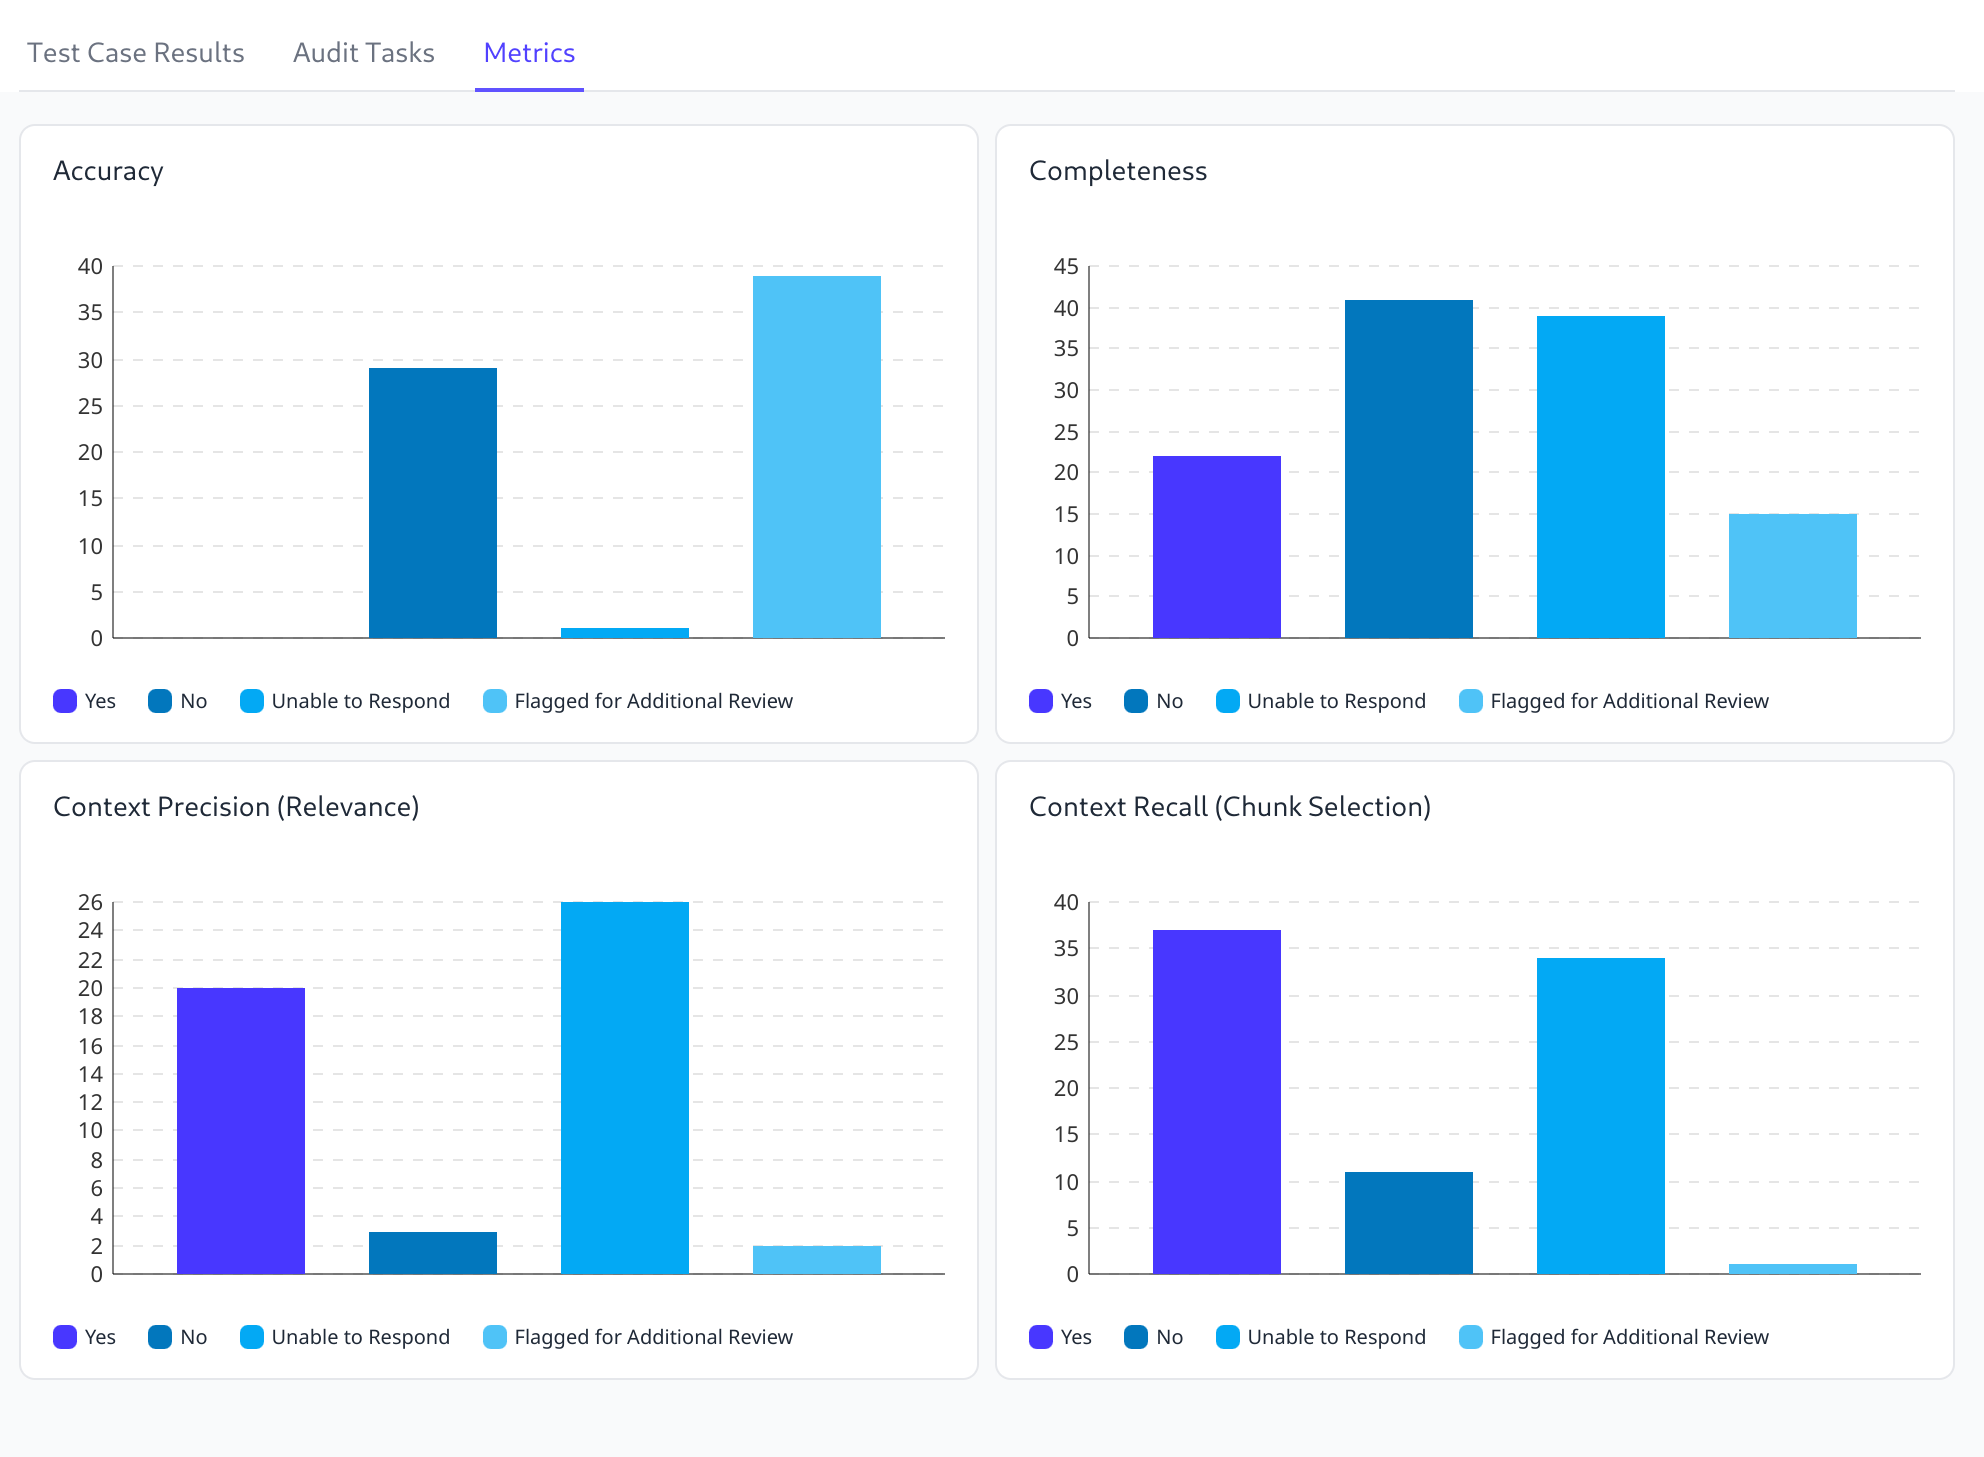
Aggregate Metrics Across Evaluation Runs
The aggregate metrics view for multiple evaluation runs now has the ability to aggregate rubrics and metrics across many evaluation runs at once, for a given time period. It also allows users to see numerical metric aggregates from multiple evaluation runs in multiple ways. Users can select between Mean and Median and Aggregate to determine how they want to show the result of the metric across all evaluations.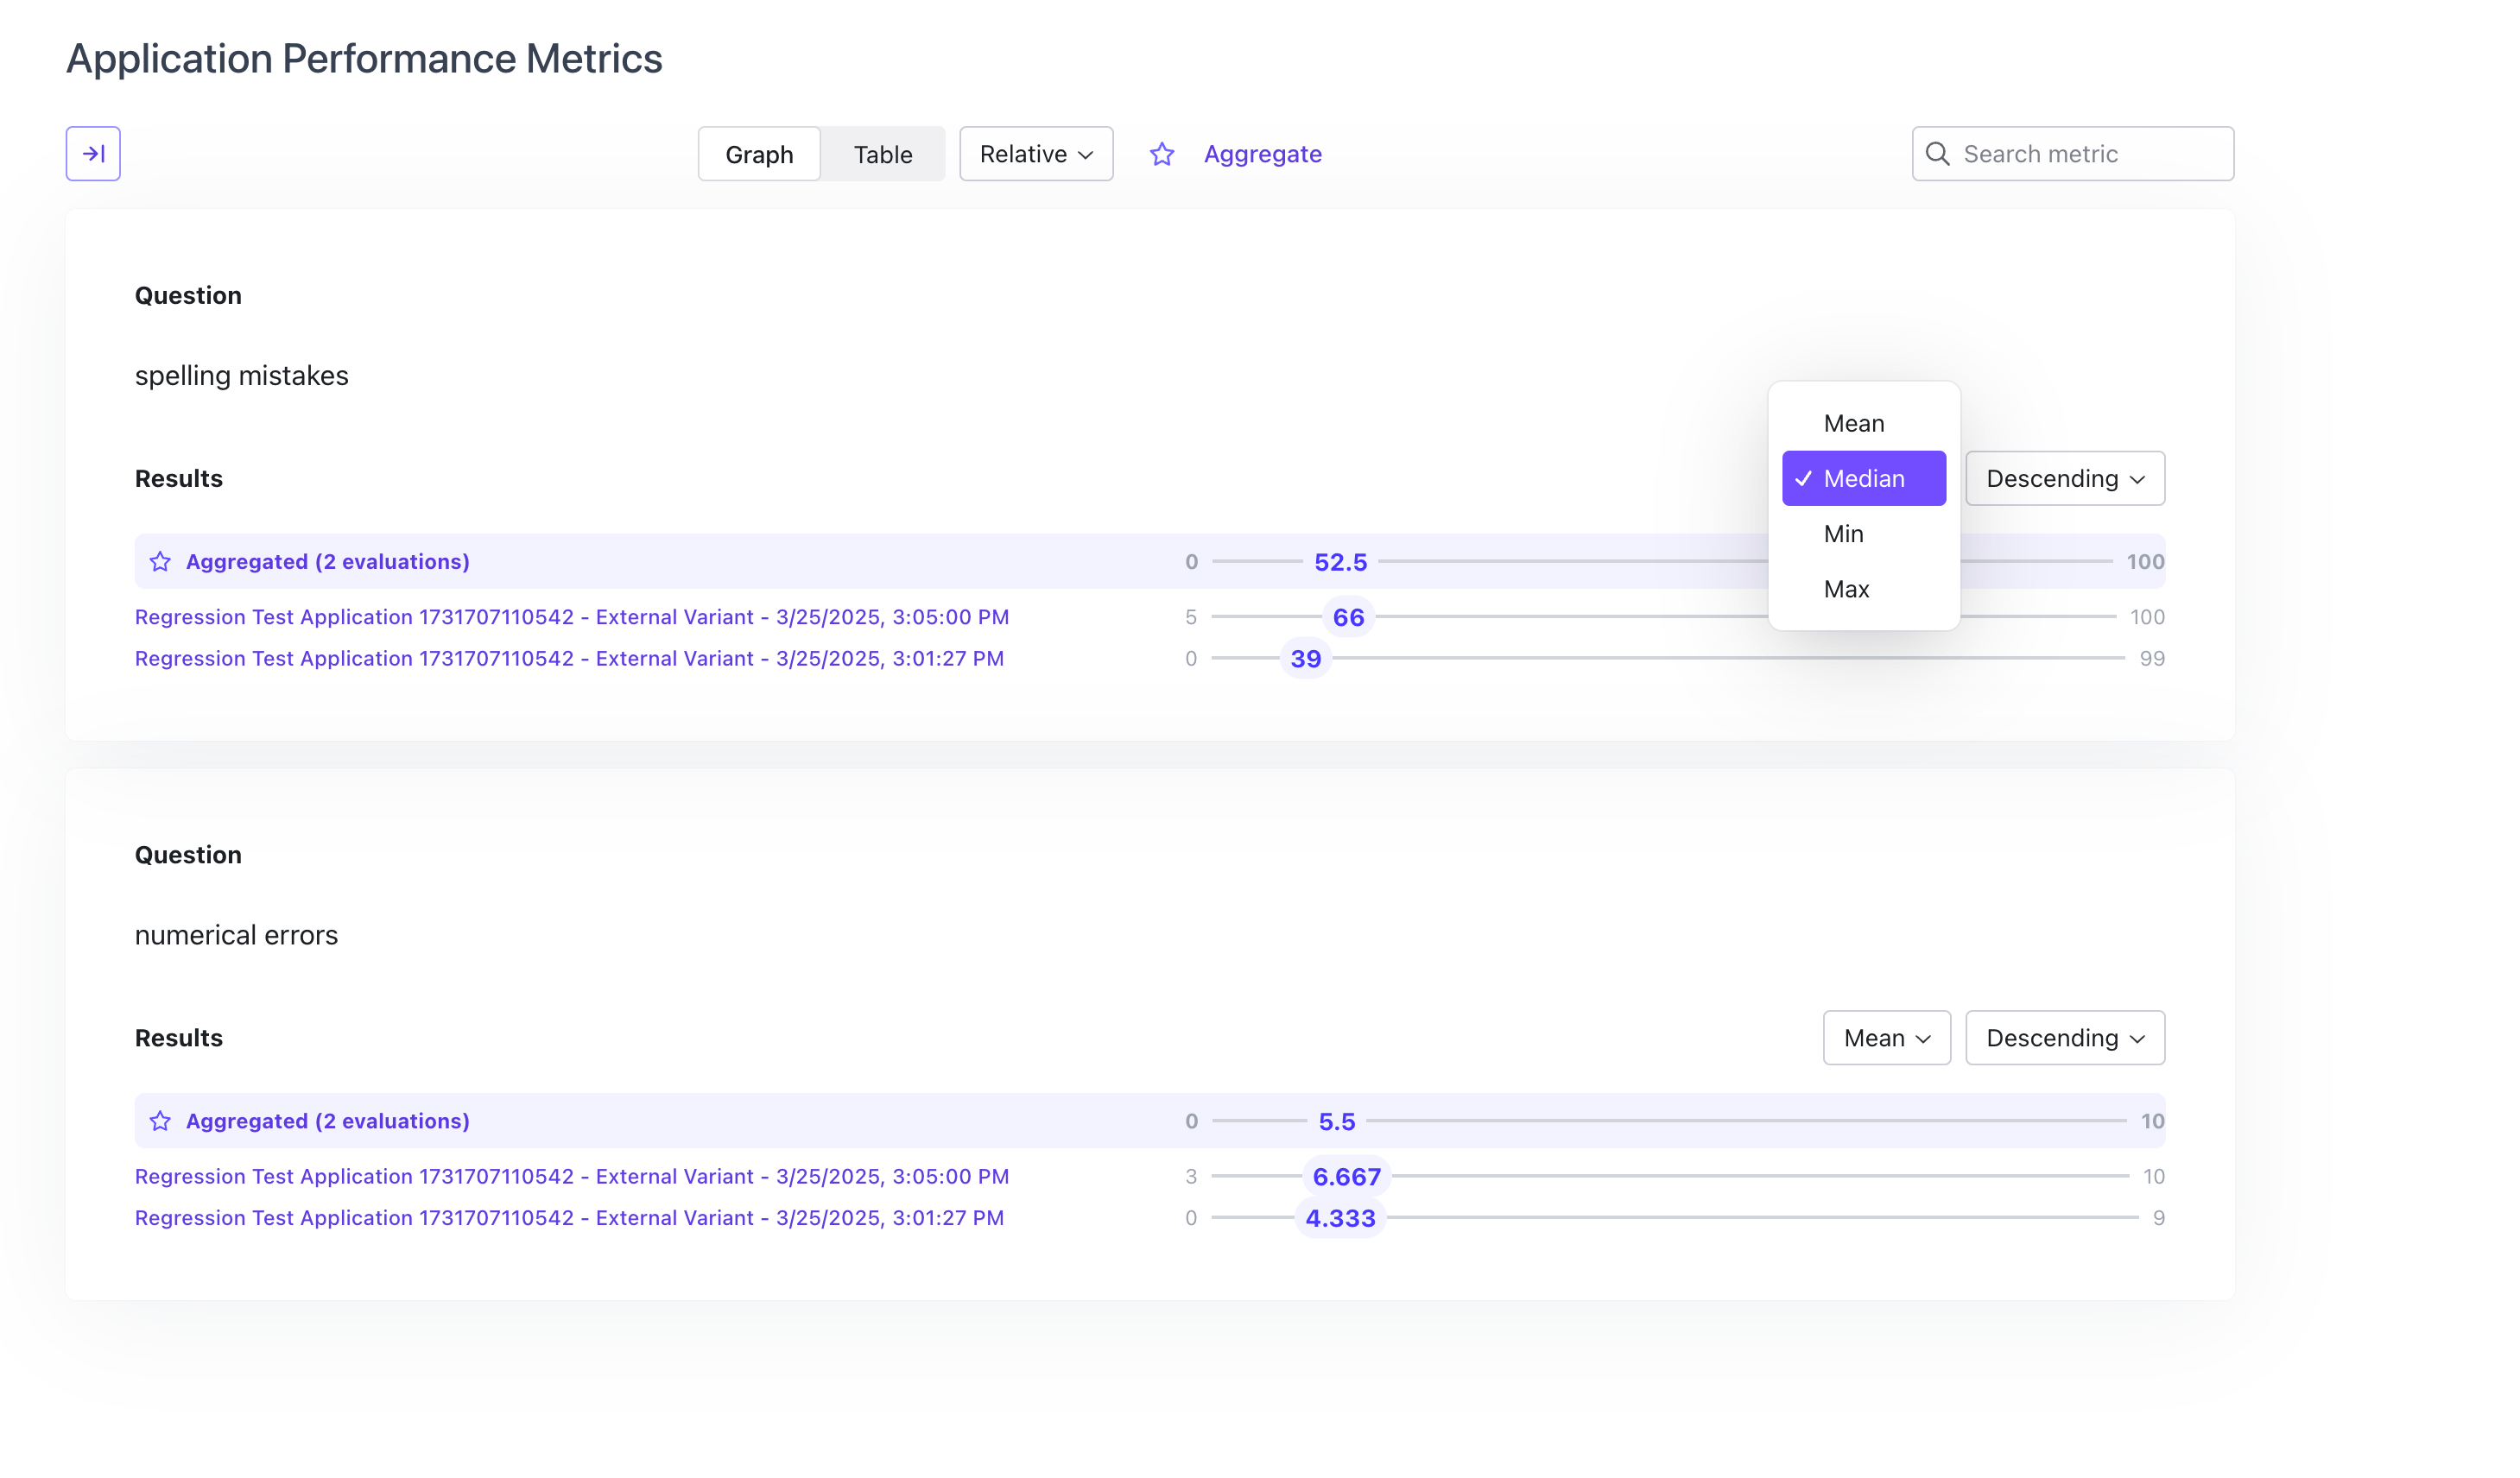
Mandate Comment by Annotator for Flagged Tasks
Annotators will be required to add a comment explaining why if they choose to flag the task.User can add multiple conditional questions
Users can now add multiple conditional questions when configuring a rubric.UX Improvements
Contributor Metrics Graph
Contributor Metrics graph shows contributors by name instead of email, enhancing readability.Conditional Questions Display for Annotators
Conditional questions will show up in the same box for annotators, making the relationship more clear to users.Default Value for Questions
When configuring a question, users can select a default value for questions. If the human or LLM annotator leaves the question blank, the question will have the default value. This default value will also be used for all aggregate displays and calculations.Set Character Limit
Users can set a character limit for text questions when configuring the question. Annotators will not be able to type more than this character limit when answering the question.Annotation Task List is Automatically Refreshed
The annotation task list is now automatically refreshed after a task is completed. This way, the status of tasks are automatically updated without the user having to do a refresh.Bug Fixes
API Validation for Numerical Questions
Added API validation that requires users to select min and max values when creating numerical questions.Aggregate Metrics View Shows Both Auto-Evaluation and Manual Evaluation Results
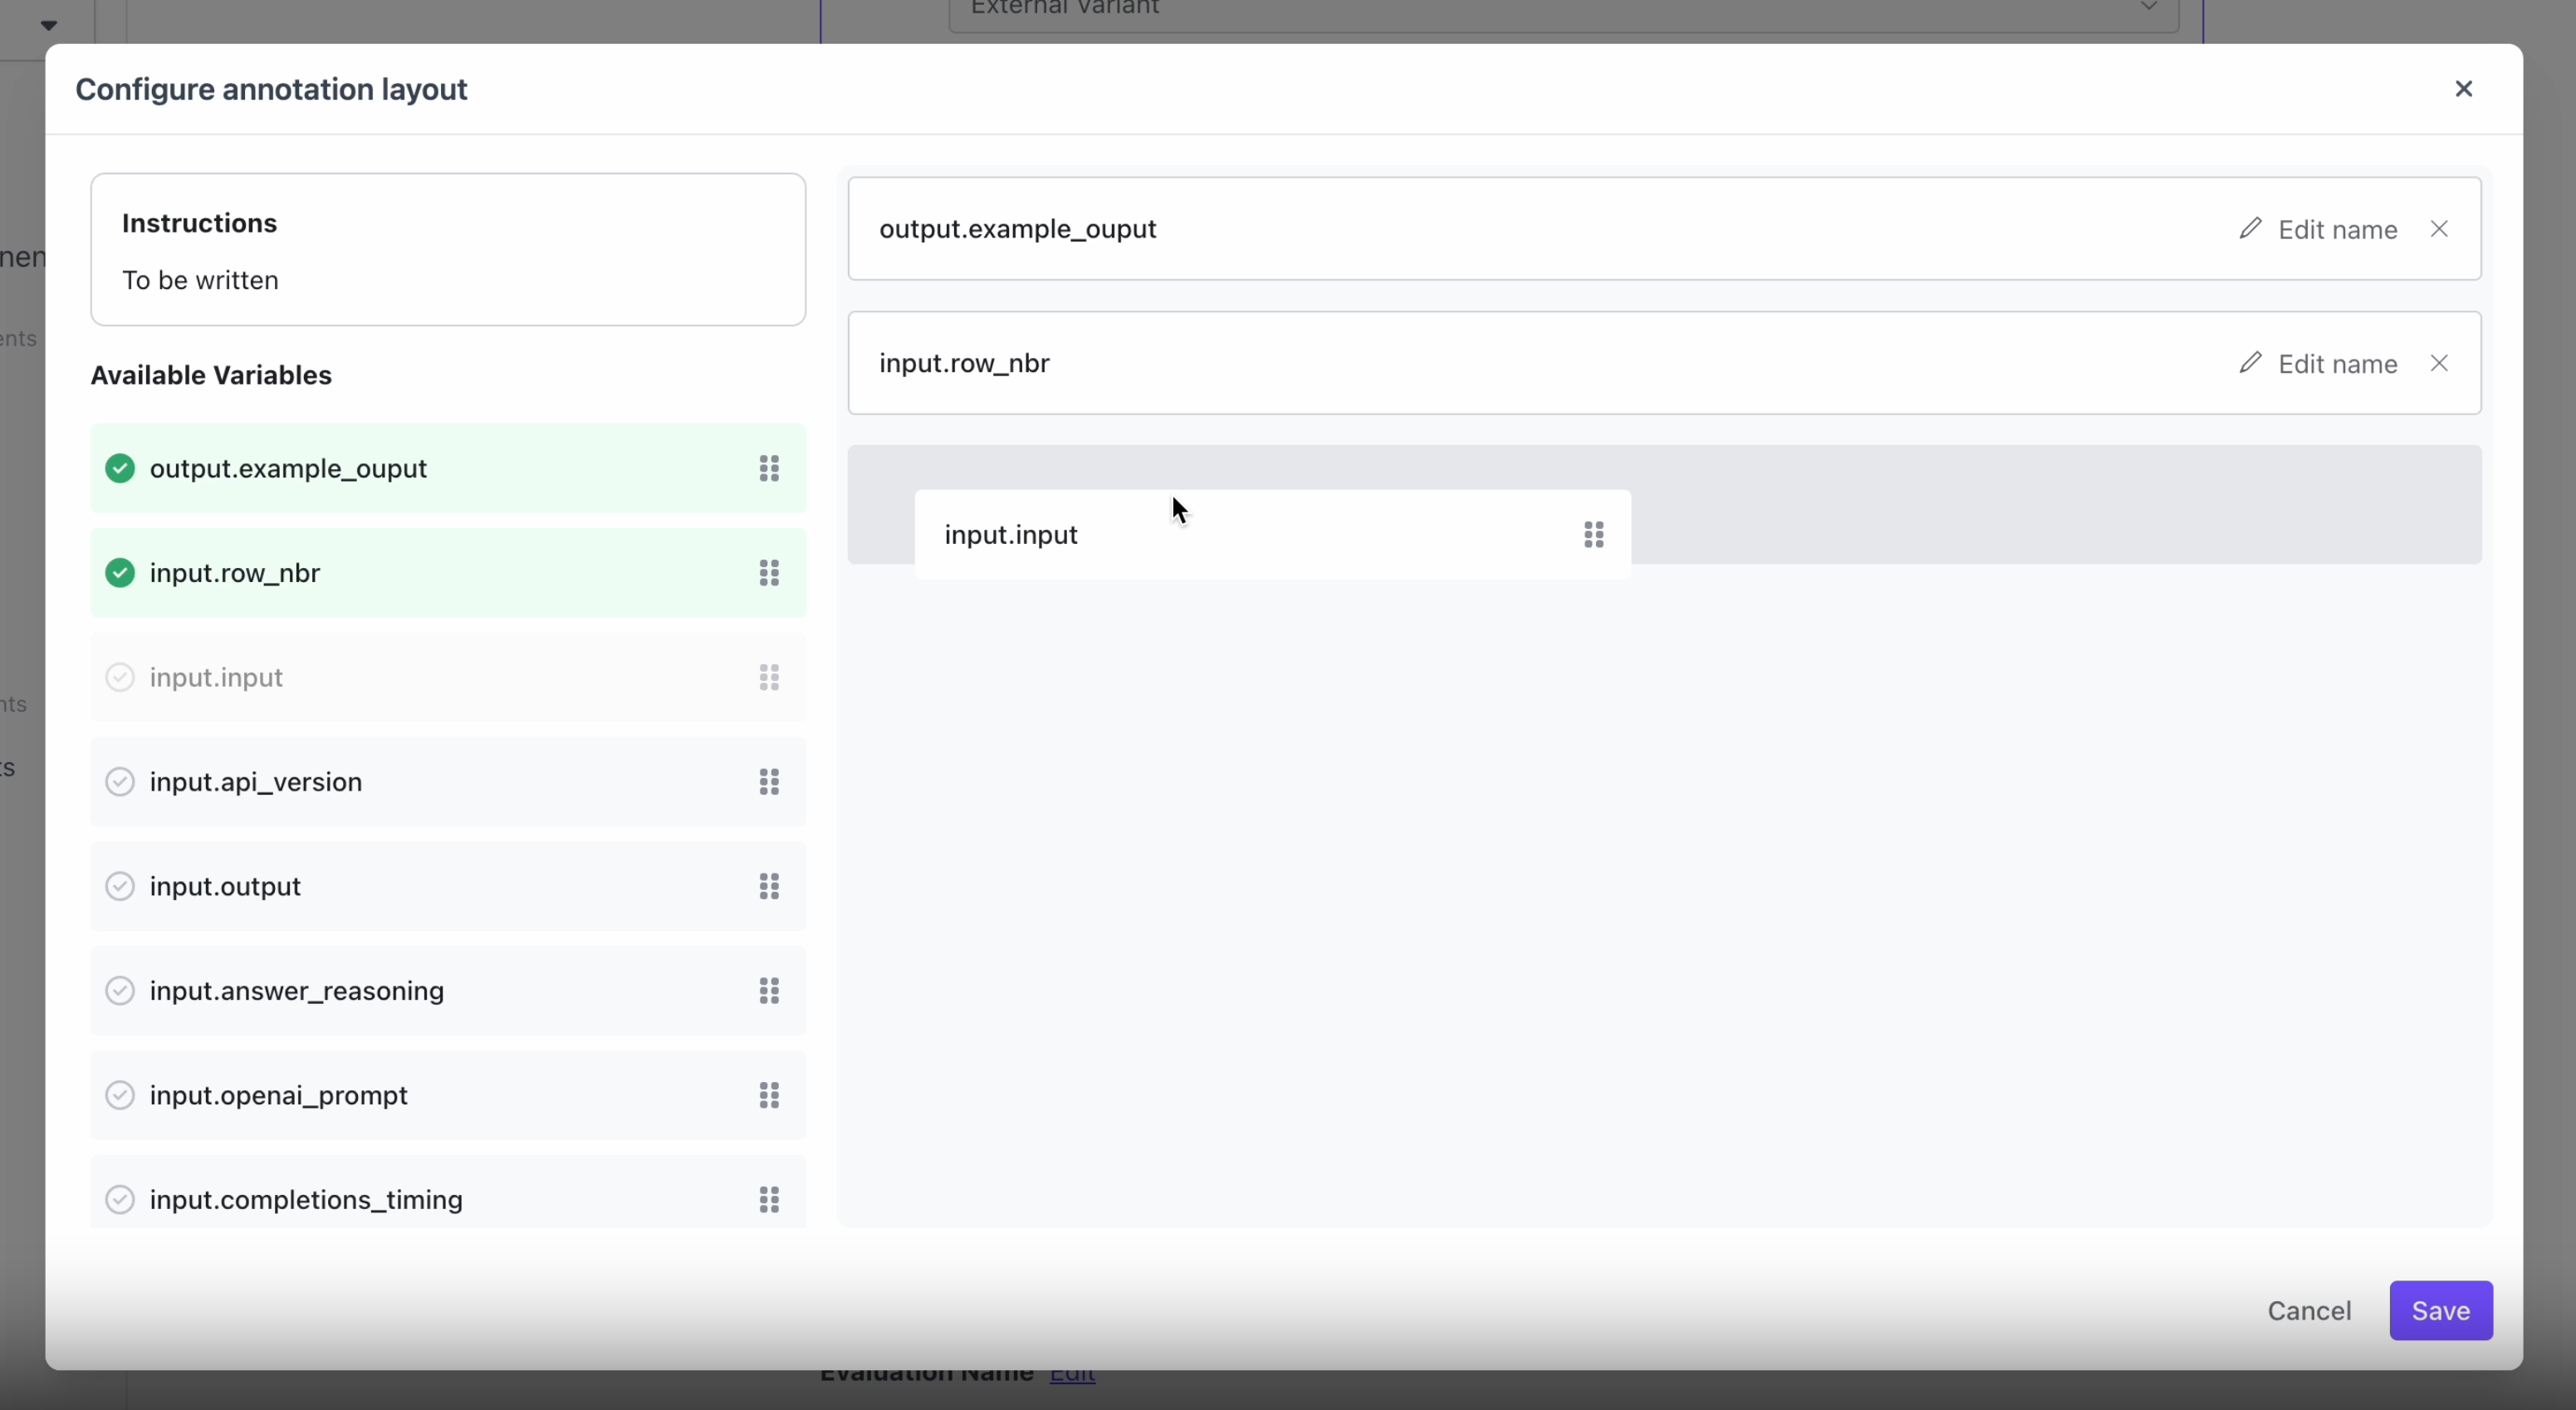
For hybrid evaluations, the aggregate metrics view now allows users to toggle between auto-evaluation and manual evaluation results.Overflow Issues on Annotation Configuration
Fixed two overflow issues on the settings page where users configure the Annotation layout.Toggle to Split Chunks in Annotation View is Back
Fixed bug that caused the toggle that allows annotators to split the chunks in the Annotation view disappear. The toggle is now back.v25.2.1
Version 25.2.1
03/05/2025Bug Fixes
Text Overflow Issues
The “Inline LaTeX” toggle on the test case results page now works as expected. Additionally, test cases containing long words break in-line instead of overflowing in the test case results page and annotation UI.Table CSV Export
The task dashboard and contributor metrics tables now export properly formatted headers. Additionally, the “Time Spent” columns are now exported in HH:MM:SS format instead of seconds.Application Variant Creation
External variants are now filtered out from selection in the “Start from existing variant” dropdown when creating a new variant from the application page. This option is completely hidden if all variants are external.Annotation UI Configuration
Users can now configure the annotation UI for flexible datasets without selecting “Contributor” as an evaluator.Empty Columns
Columns that previously had an empty title in the “Customize Columns” popovers now display the actual column header.v25.2.0
Version 25.2.0
02/28/2025New Features
Flexible Evaluations Through the UI
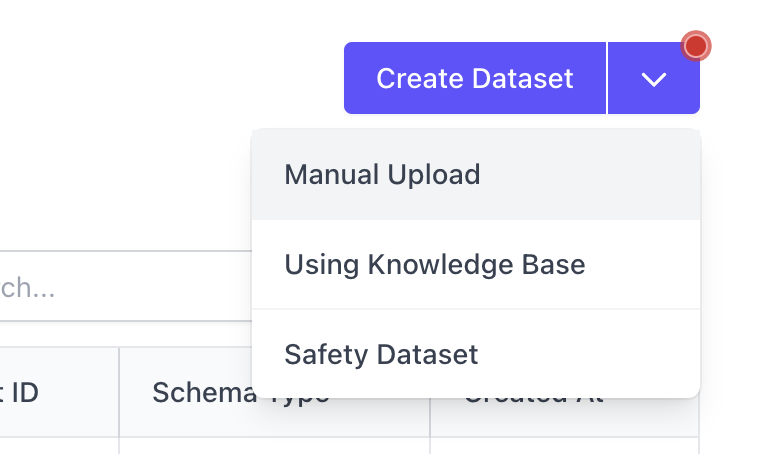
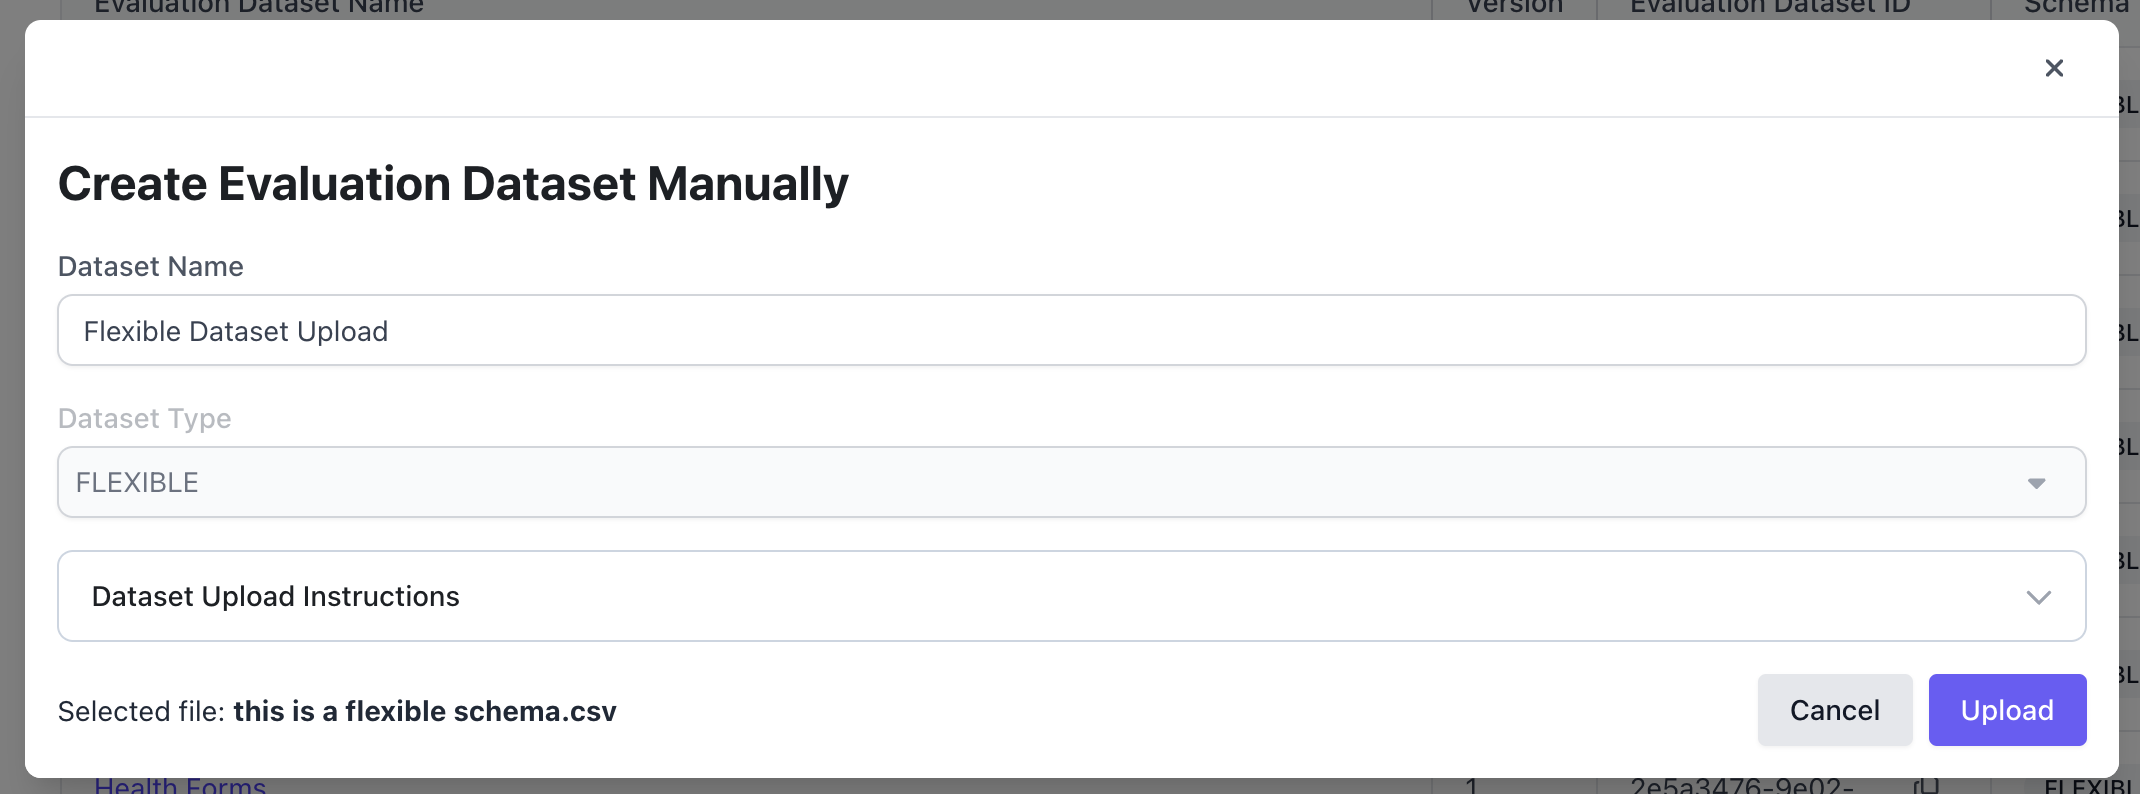
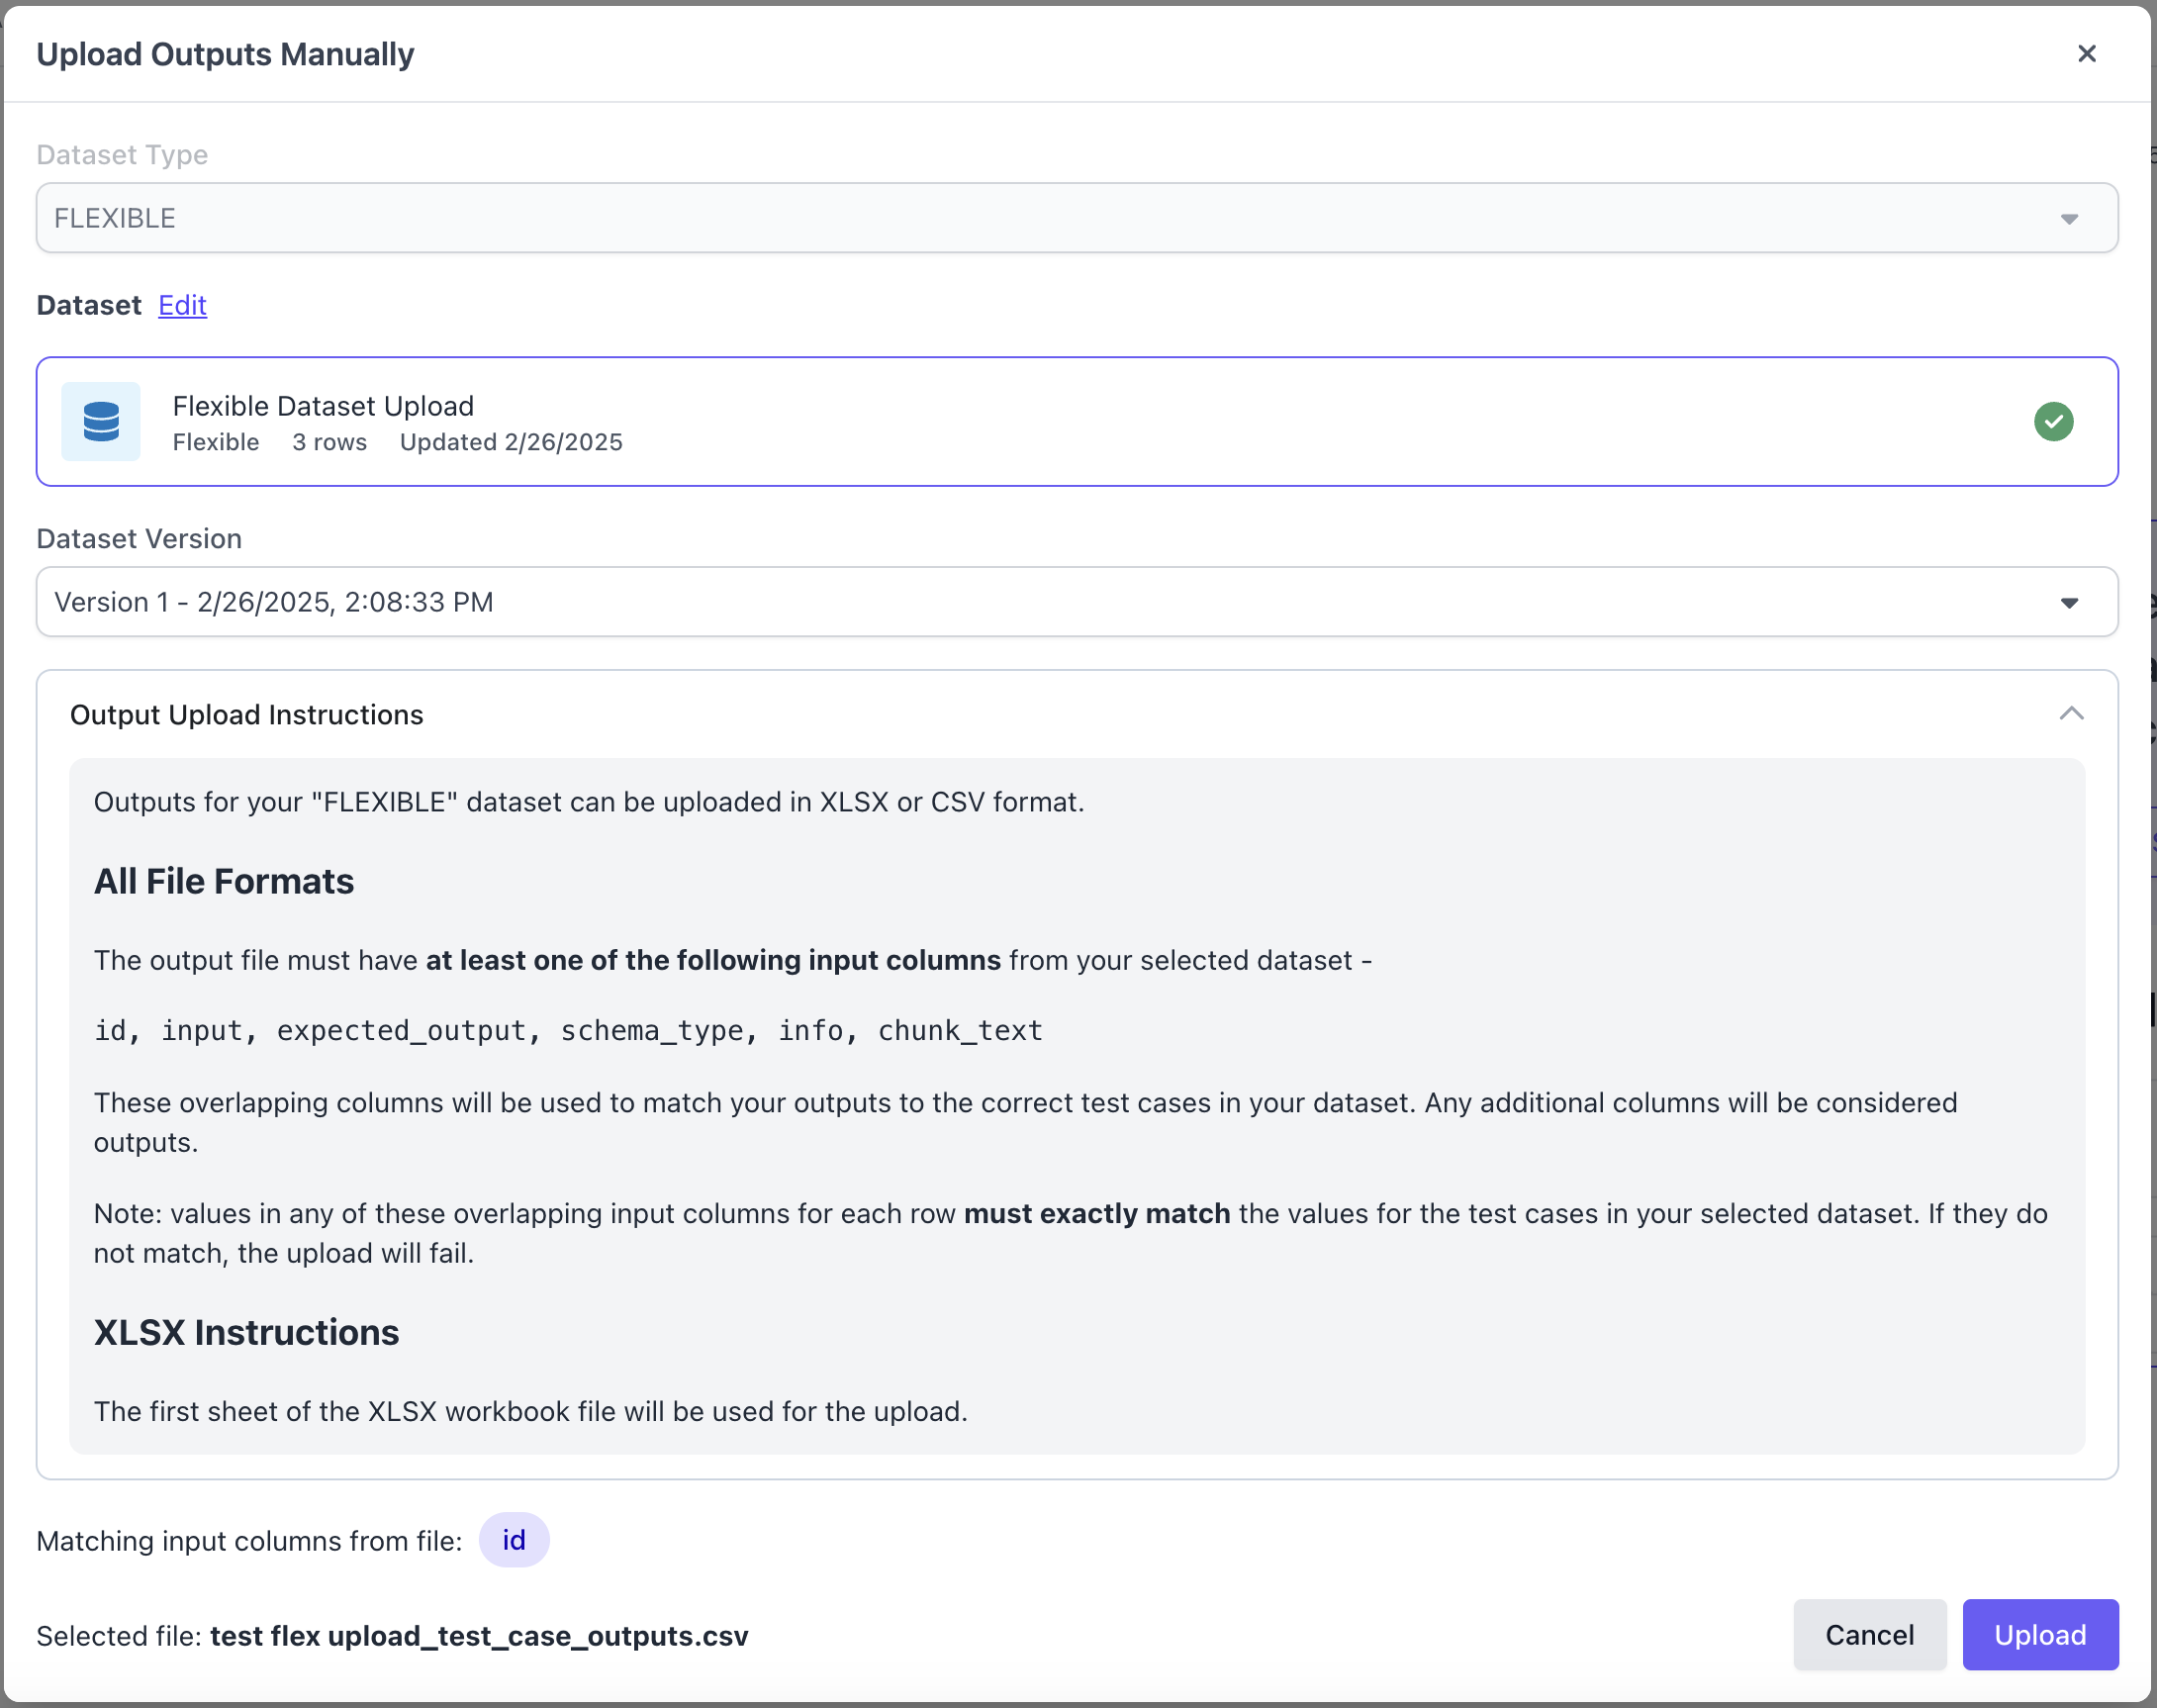
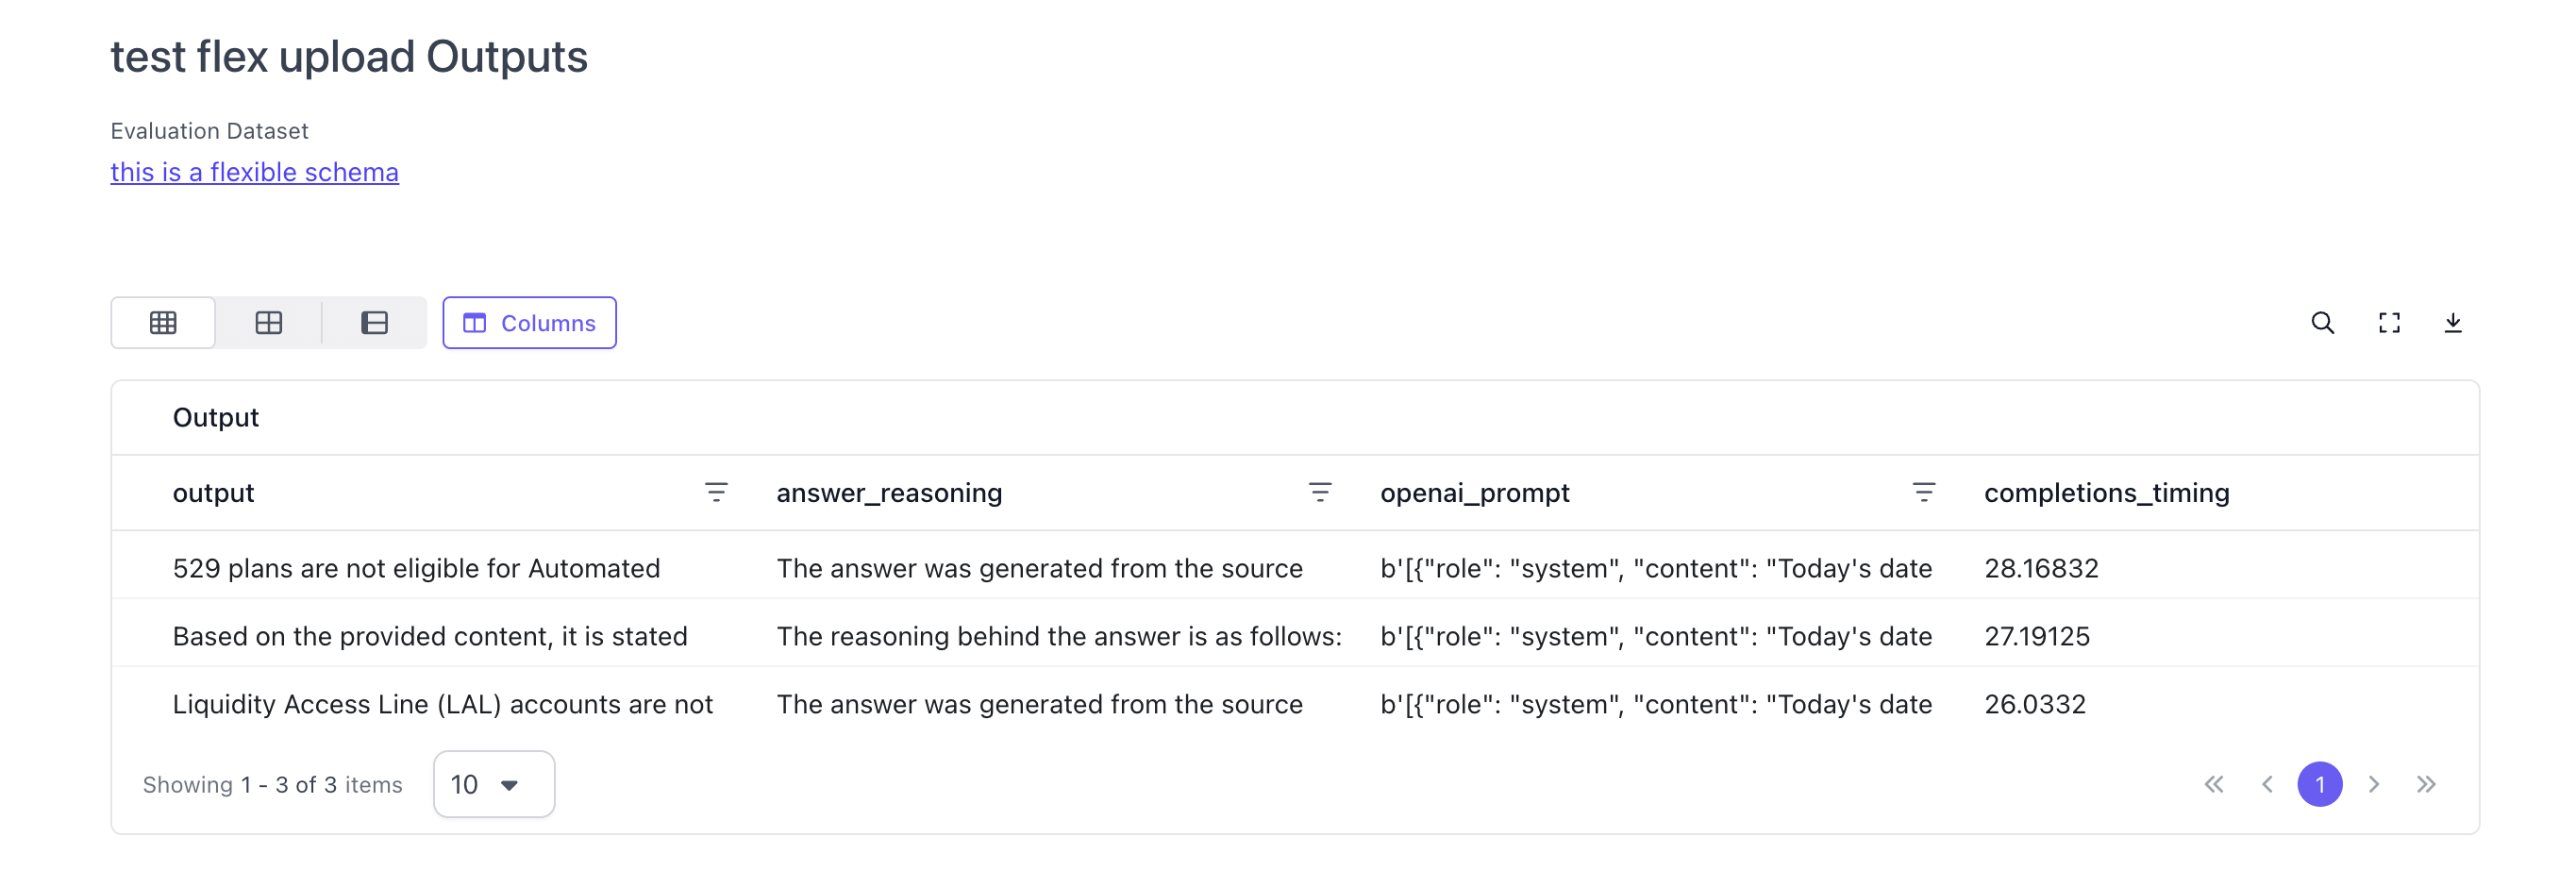
Users can now configure and run flexible evaluations through the UI. This also means that all evaluations can be done through the UI. See below for how to run a flexible evaluation through the UI.Upload Flexible Datasets and Outputs
First, navigate to the Evaluation Dataset page in order to create a dataset.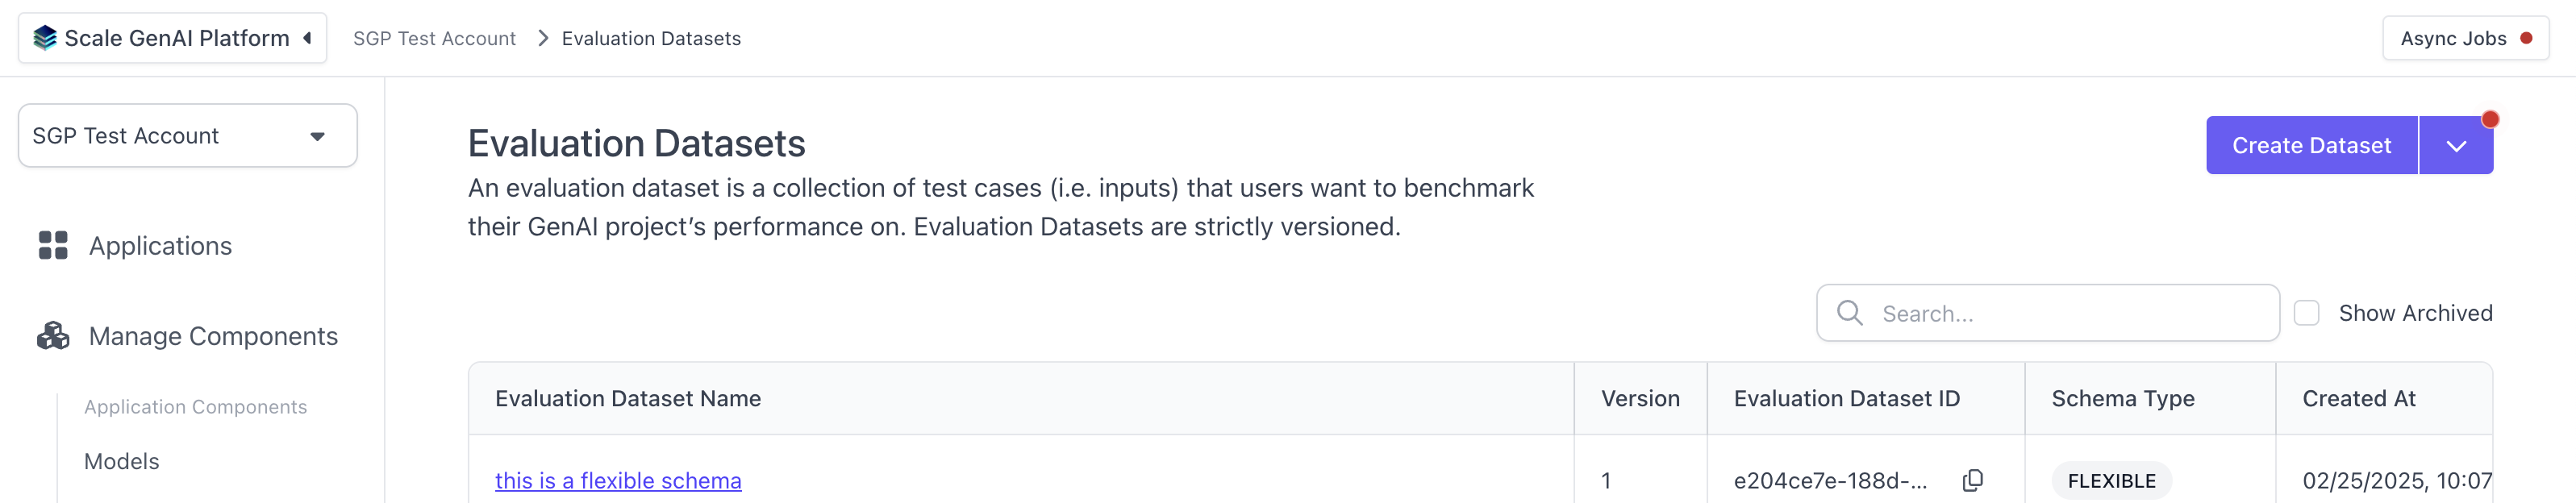
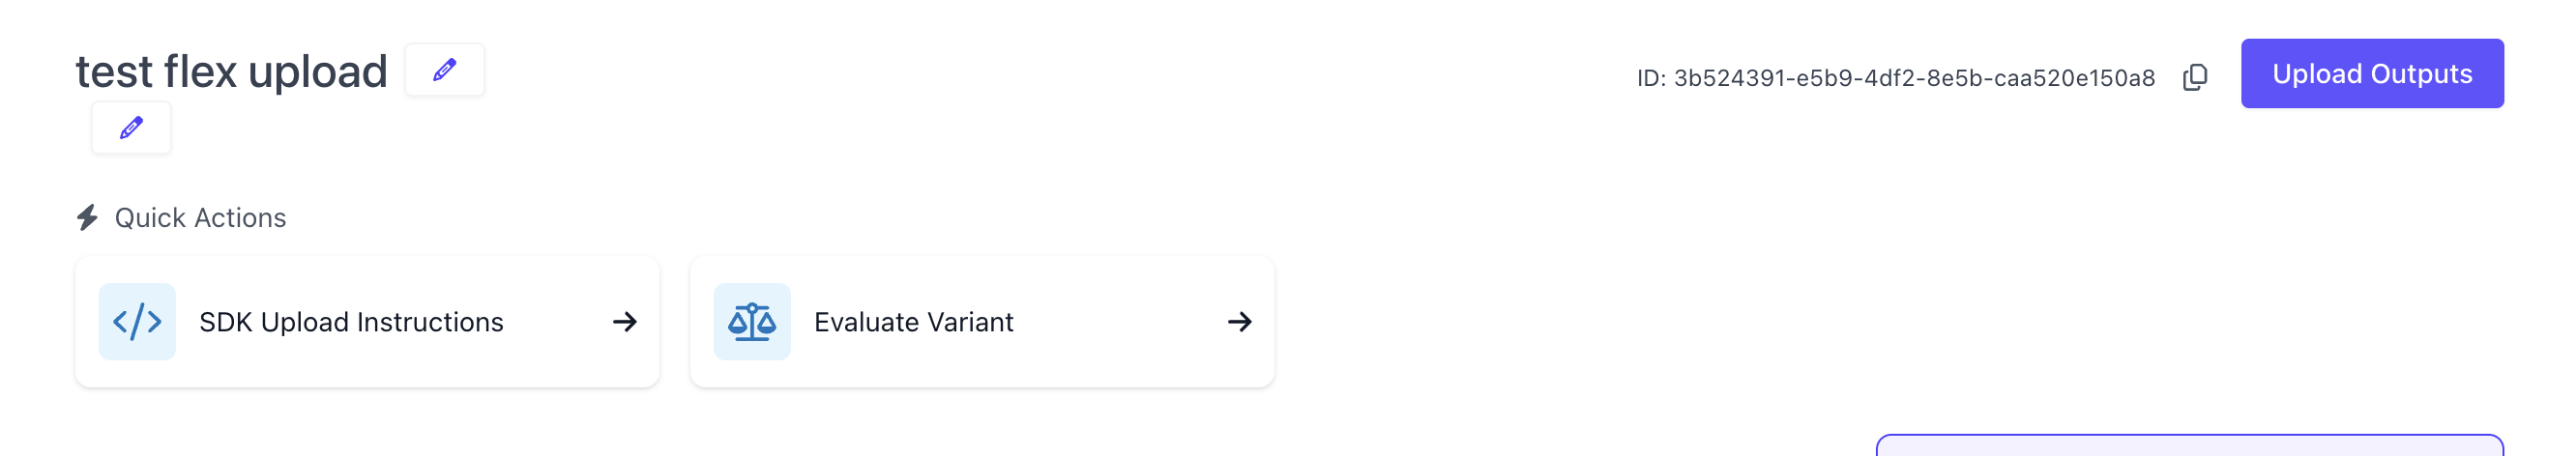
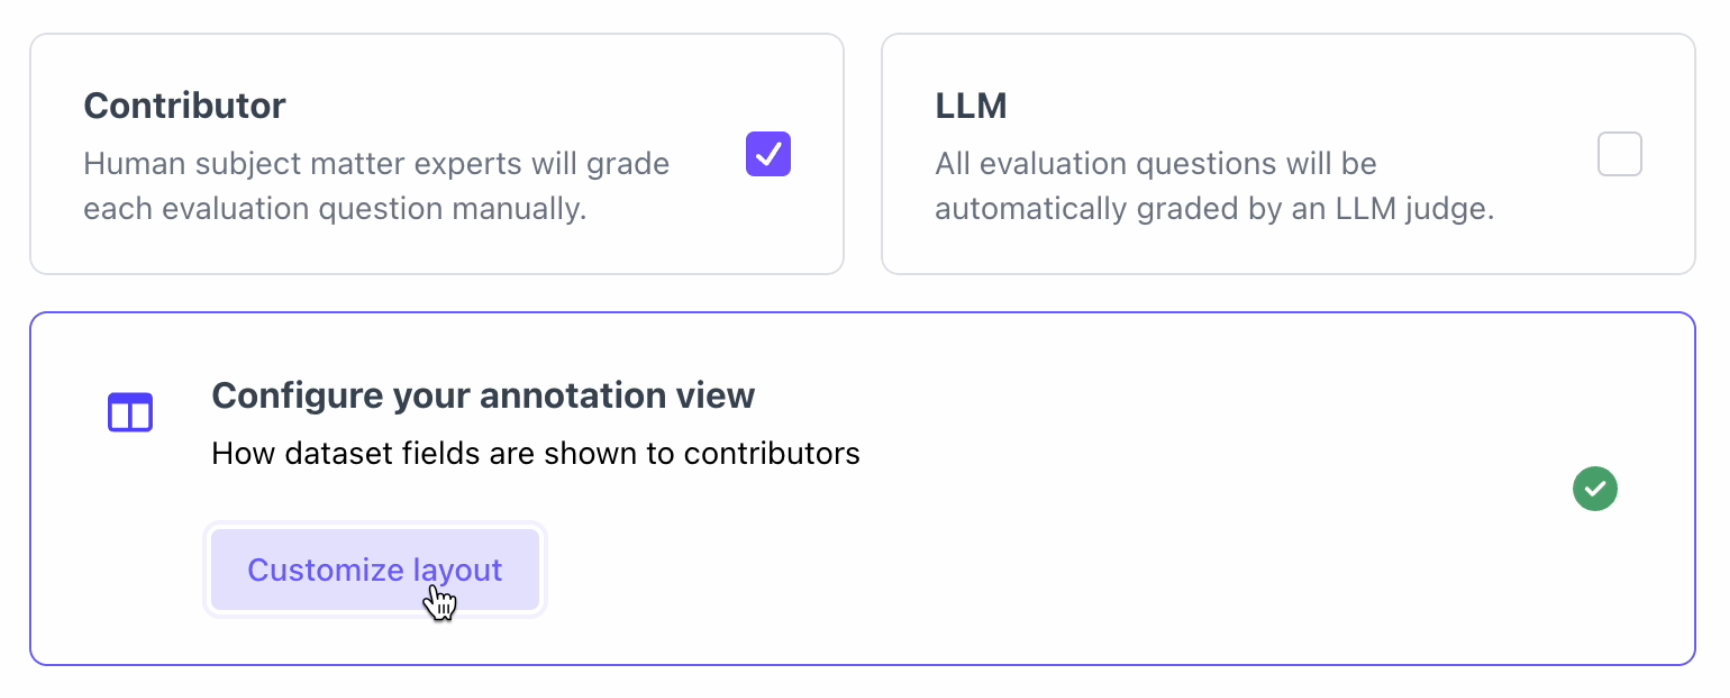
Configure the Annotation Configuration and Run Evaluation
After uploading the dataset and outputs, users can now run an evaluation through the UI as well for flexible datasets.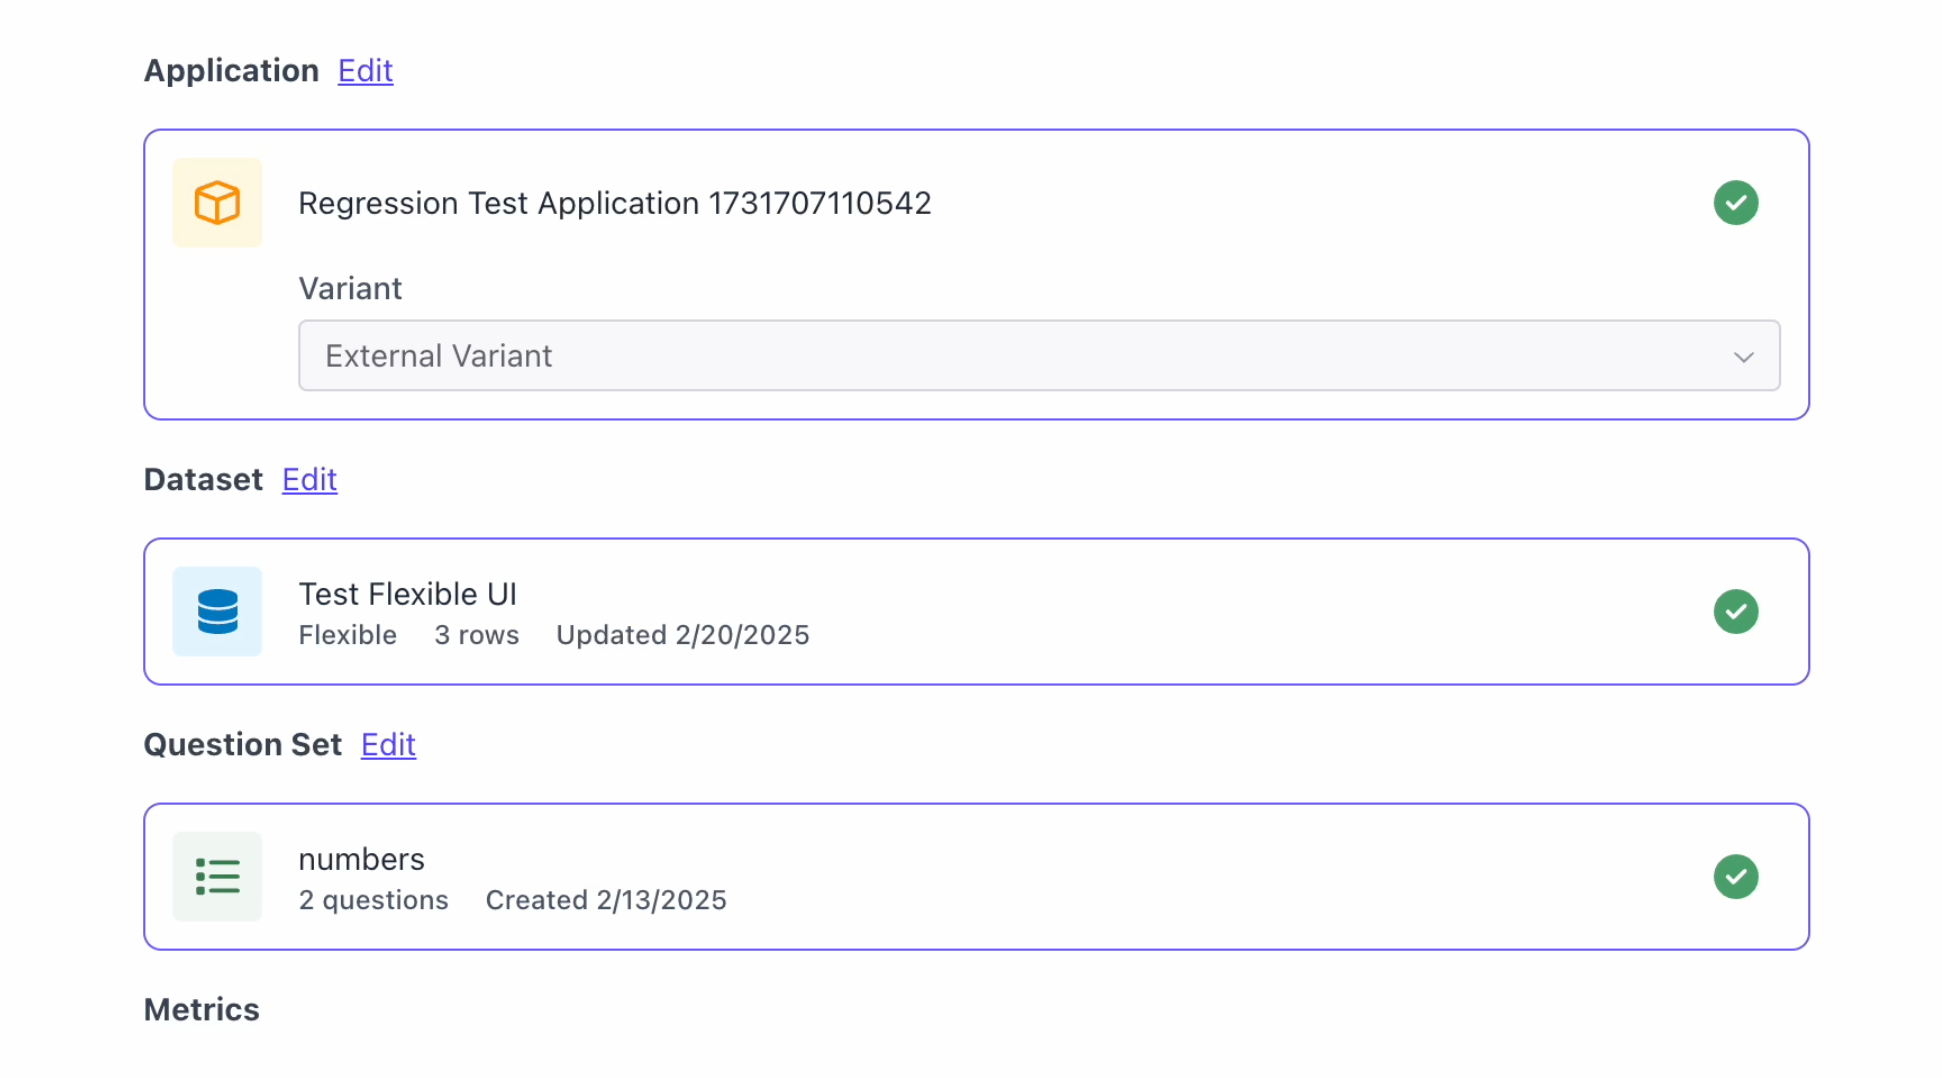
Select Multiple Metrics Calculated with Different Columns from the Dataset
Users can now select several different of the same evaluation metrics to compare. For example, users can select multiple Bleu scores for each evaluation run and indicate which data columns will be used to compute the Bleu score.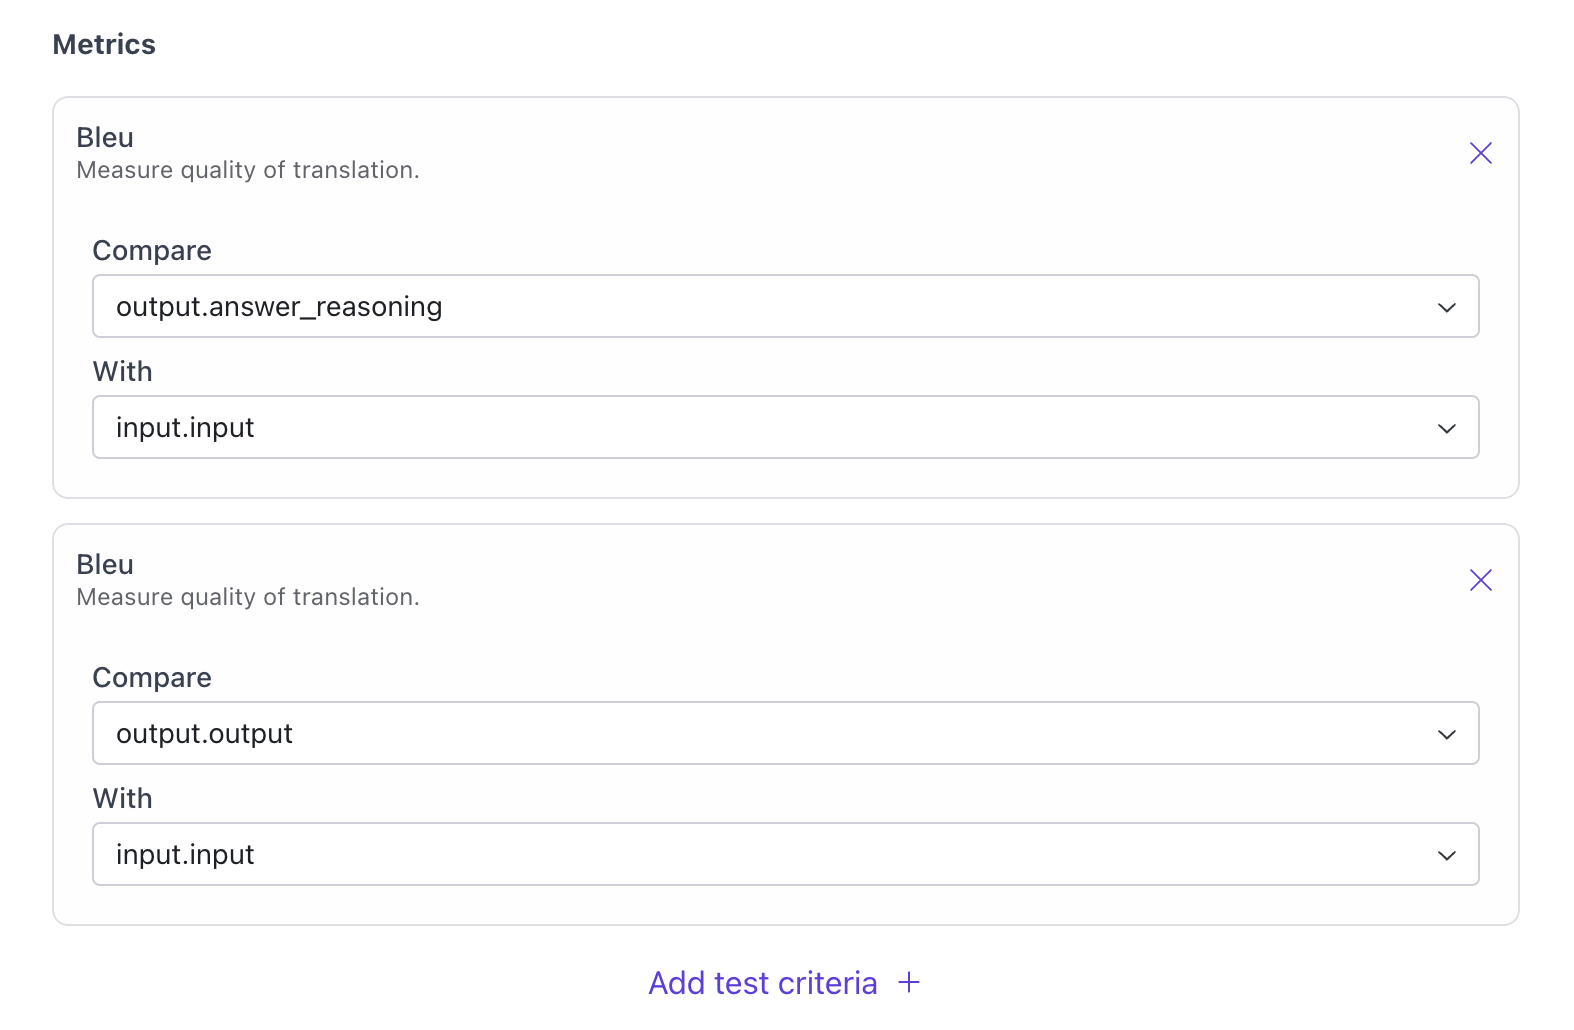
Minor Features
All columns in dataset schema is available on Task Dashboard as Hidden Column
Users can now search for task related data and filter the rows on the task dashboard based on the data in the test case of the relevant dataset. This simplifies the process of finding test cases based on their content in the annotation task dashboard.Task Queue and Contributor Metrics Can be Exported as CSV
Users can now export Task Queue and Contributor Metrics Can be Exported as CSV.Customizable Filters For Columns in Contributor Metrics
Contributor Metrics Table now has customizable filters for columns in the contributor task dashboard.Bug Fixes
Can now filter by “Needs Review” column in the Task Dashboard
Fixed an issue where the needs review column filter in the task dashboard was not working. Users can now filter by that column.Can now clear numeric values in annotation view
Fixed a bug where numerical question types could not be cleared by annotators.Fixed Test Case Results Page for Hybrid Evals
Fixed an issue where Autoevaluation results were not showing up on the test case results view for Hybrid Evals if the Manual evaluation was not yet done.Test Case Results View Works with Latex
Latex inline formatting shows up for test case results view now.Reasoning and Prompt Hidden for Human Evaluations
Since reasoning and prompt only apply to autoevaluations, they only show up for autoevaluations now. Previously was showing up as empty for Human Evaluations.v25.1.3
v25.1.2
v25.1.1
v25.1.0
Version 25.1.0
02/04/2025New Features
Select Metrics to Calculate When Configuring Evaluation Runs
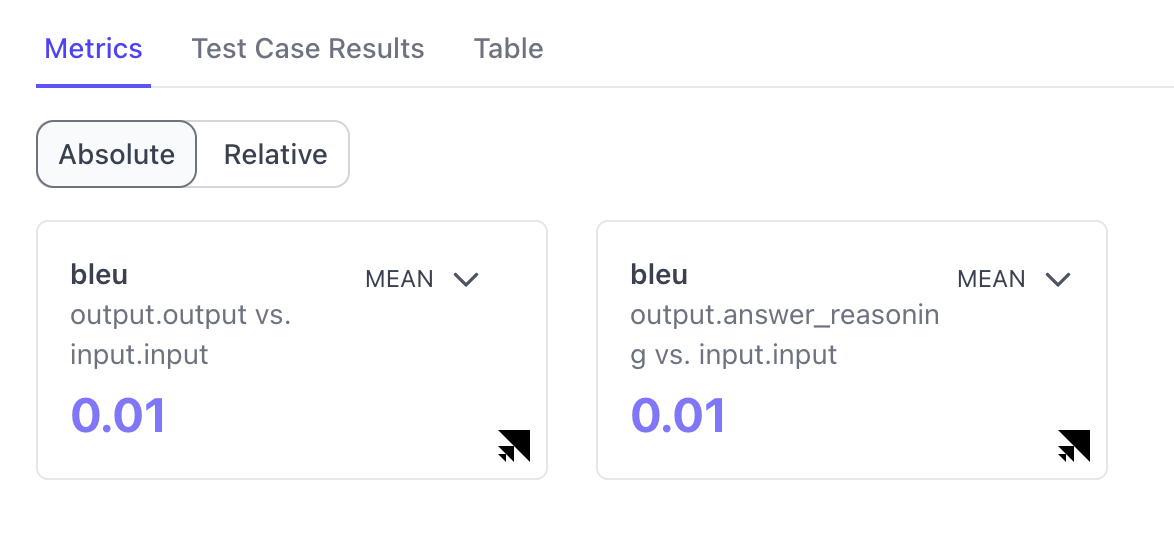
Users can now select preconfigured metrics to calculate during an evaluation in addition to the questions answered on the rubric.- Currently, users can select from Bleu, Rouge, Meteor, and Cosine Similarity.
- After running an evaluation, the selected metrics will show up in the metrics tab for evaluation results.
- The selected metrics will also show up in the table.
Expanded Auto Evaluation Capabilities
Auto Evaluation Support for all Flexible Evaluations
Users can now run auto evaluations for any flexible dataset. The prompt template is fully customizable and allows users to insert any variables defined in the dataset. Variables for the dataset will show up on the side of the prompt template.Modify Batch Job Size and Hyperparameters
Users can now modify the batch job size and hyperparameters when configuring autoevaluations.Other Improvements to the evaluations workflow
Tooltip explaining human versus LLM evaluators
Added a tooltip that shows the difference between human and LLM evaluators.Show tooltip for search matches in a hidden column
When a user searches for a keyword that has a match in a hidden column, a tooltip will let the user know that the search result is hidden.Show Modal with LLM Used and Prompt
Clicking on LLM for completed auto evaluation results will open a modal that shows the LLM used and the prompt used for the autoevaluation.Maintain Consistent use of Test Case ID
Maintain consistent use of “test case ID” across annotation task dashboard and evaluation results page. IDs can easily be used to compare and match tasks.Other Minor UI Fixes
Ability to edit application name, application description, variant name and description on the UI
Users are able to edit the variant name and description in the UI by clicking on the edit button.Tasking Improvements
Bulk Assign Users to Tasks
The platform now has the ability to bulk assign tasks to labelers.Filter Task Dashboard Based On Responses to Evaluation Questions
Users now have the ability to see the responses to evaluation questions on the task dashboard. These columns default as hidden, but can be shown and used to filter the table.Bug Fixes
Wrong timestamps for “Updated At” in task dashboard
Fixed an issue that populated “updated at” for all tasks of an auto evaluation with the time the overall auto-evaluation run finished. Now, each task shows the correct time it was last updated during an auto-evaluation run.Contributor metrics aggregation shows correct amount of time for auto evaluation to be run
Fixed the issue that the time taken by the LLM evaluator was wrongly aggregated. As the LLM evaluator executes tasks in parallel, the total time for the evaluation run is equal to the actual runtime of the model, instead of the sum of the individual tasks (which is the case for contributor evaluators)Show number of rows in the evaluation set
Fixed an issue where the number of test cases in a given dataset was showing 0 for all datasetsConsistent sorting algorithm on tables
The content of tables are now sorted by special characters first and alphabetically second.Table filters are displayed properly (overflow issue fix)
Fixed an overflow issue in the CSS so that table filters now show up on top of the table properly.Custom Prompts are Properly Executed
Fixed a caching issue in our custom prompt store for autoevaluations. Now all custom prompts are saved upon configuration and executed for autoevaluations.v24.12.0
Version 24.12.0
01/07/2025New Features
Auto Evaluation Support for Summarization and Translation Use Cases
Auto Evaluations are now available for summarization and translation use cases on the platform! Users can kick off an auto evaluation for summarization and translation evaluations through either the UI and SDK. Users can modify the prompt for autoevaluations, and then see the prompt and reasoning in the results page for the autoevaluation.- Kick off an auto evaluation.
- Configure the auto evaluation. Choose model and edit prompt.
- View Autoevaluation results in the test case results viewView Autoevaluation results in the annotations view
- For more information on how to kick off Auto-evaluations, check out our documentation.
Save Progress While Doing Annotations
Users can now save their progress on a task and come back to it. The timer will only count the time they worked on the task towards the total time of the task. When the user resumes a task they have saved, they will be able to see the questions they’ve already answered. If another user picks up the task, they will not be able to see any of the original user’s progress.Task Dashboard Improvements
- On the task dashboard, users now have the ability to search for tasks.
- Users can also filter by the user, task ID, date, and time for each column.
- Users can download and export contributor metrics.
- Users can filter the contributor metrics table by submissions, contributor, tasks fixed, time spent, and efficiency.
Application Variant Page Improvements
The Variant Description now shows up on the Application Variant Page.Annotation UI Improvements
We launched a series of improvements to the annotations UI for our annotators.- Checkmark icons will now only show up for completed questions. Before, we show green vs gray checkmarks on all questions with green indicating that the question is completed. This UX is challenging for color blind users.
- The UX for the previous and next questions has been improved. The “Previous” button will only show up if the current question is not the first question. The “Next” button will only show up if the current question is not the last question.
- URLs in the annotation view can now be clicked on.
Alerting and Paging
We have set up a healthcheck alert in SGP Azure VPC environments to enable quick turnaround for any service downtime. Upon failure of the healthcheck, an alert rule will trigger a PagerDuty action group, which can be connected to both Scale and customer PagerDuty services.Bug Fixes
Application Variant Shows Up After Creation
After creating an application variant, it now shows up immediately without refreshing.Search works for Raw View in Annotations View
Search now works for Raw View for Annotationsv24.11.3
Version 24.11.3
12/06/2024New Features
OpenAI MSAL support
VPC deployments can now use the MSAL confidential client application authorization flow for OpenAI proxy/gateway credentials.Bug Fixes
Audit view state updates
Tasks completed by the current user are now auditable through the Task Dashboard without requiring a browser refresh.v24.11.2
Version 24.11.2
11/26/2024Bug Fixes
Task Dashboard state updates
Updates to the current user’s in-progress and completed tasks are now properly synced on the Task Dashboard without requiring a browser refresh.Evaluation run comparison
The “Evaluation Comparison” page for an evaluation run no longer surfaces itself as a comparison option.v24.11.1
Version 24.11.1
11/20/2024Bug Fixes
Evaluation run table view
Evaluations that use rubrics with a “Free Text” question type now render the table view without error.Task ID rendering
The ID rendered on the annotation view (from the “Start Labeling” flow) now properly reflects the value in the “Test Case ID” column on the task dashboard. Additionally, the truncated IDs on the task dashboard are now searchable using the fully qualified ID in browser search.v24.11.0
Version 24.11.0
11/15/2024New Features
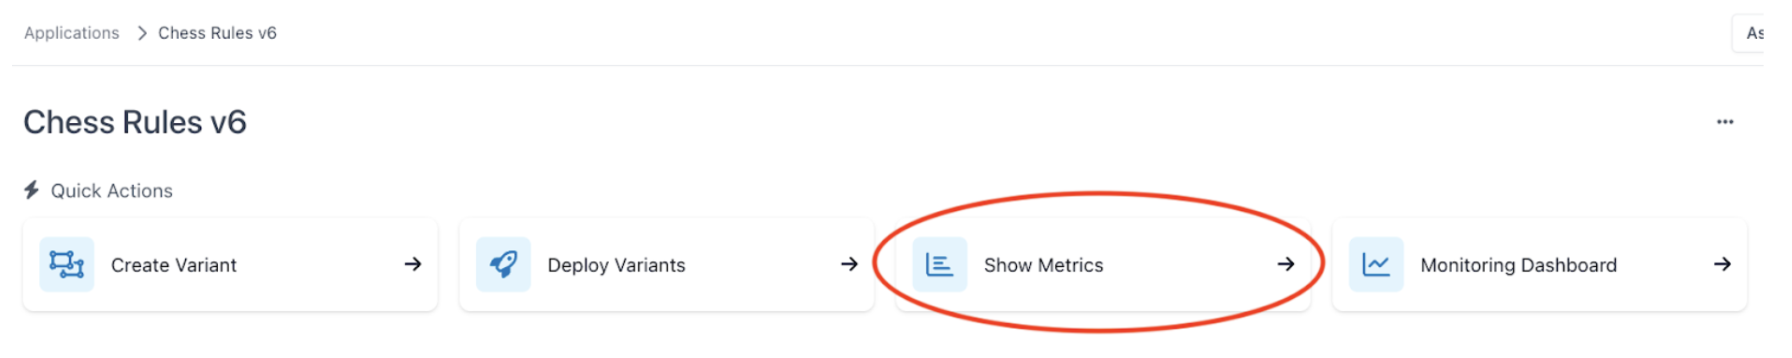
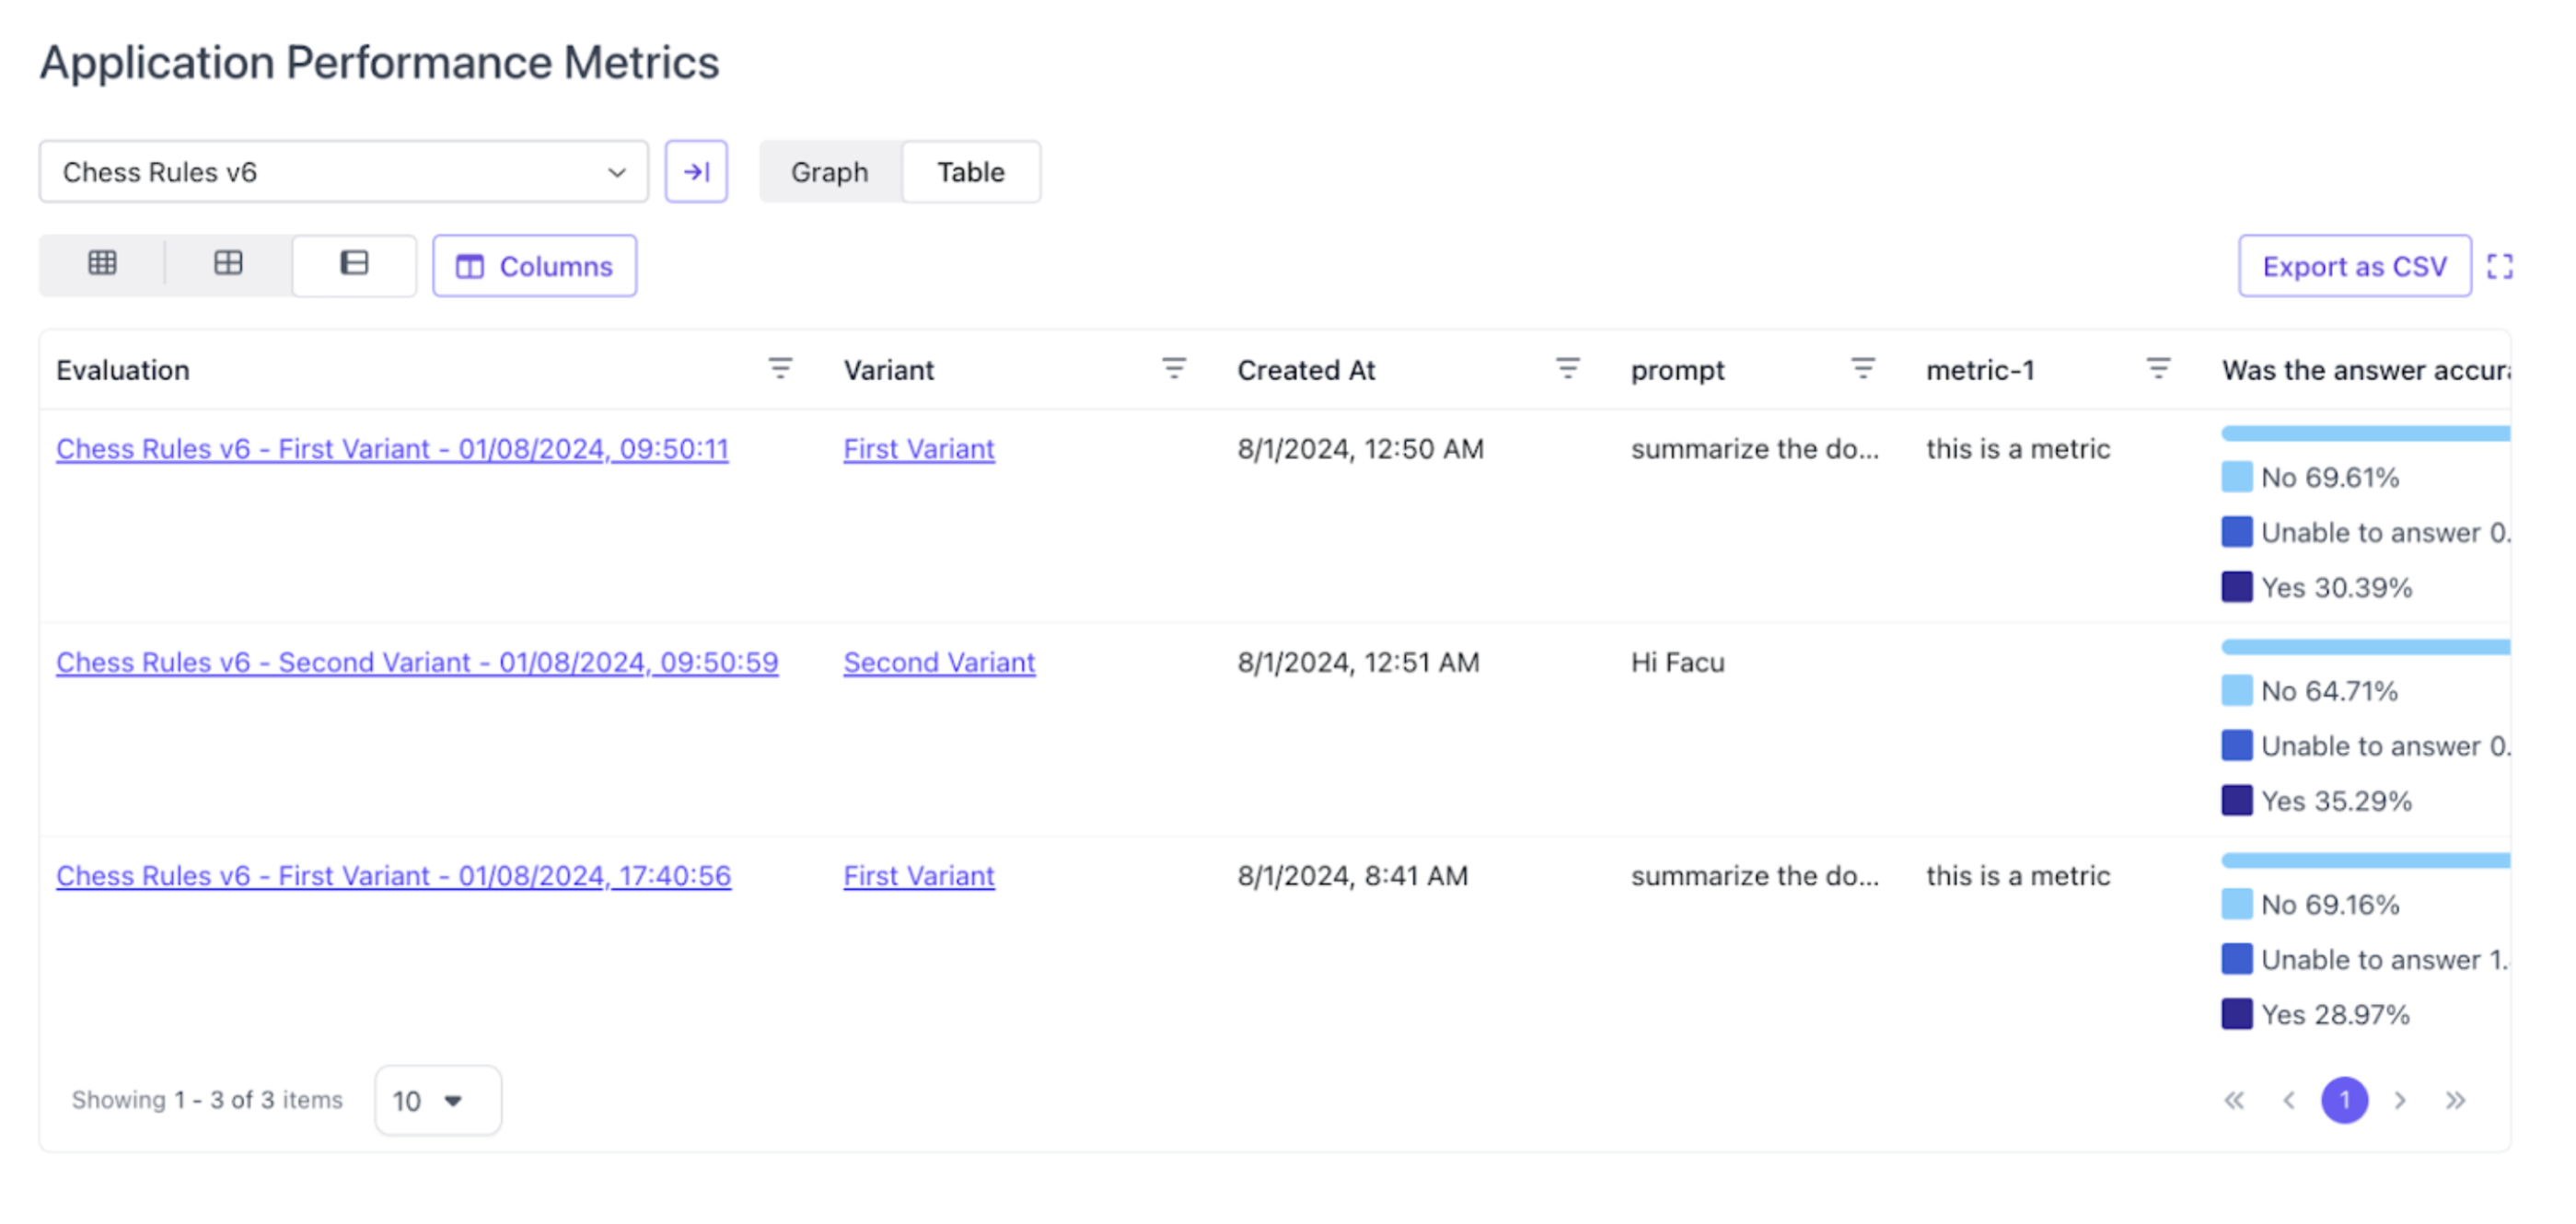
Aggregate Metrics View
Users now have the ability to compare application performance across all variants inside the SGP platform through the Aggregate Metrics View.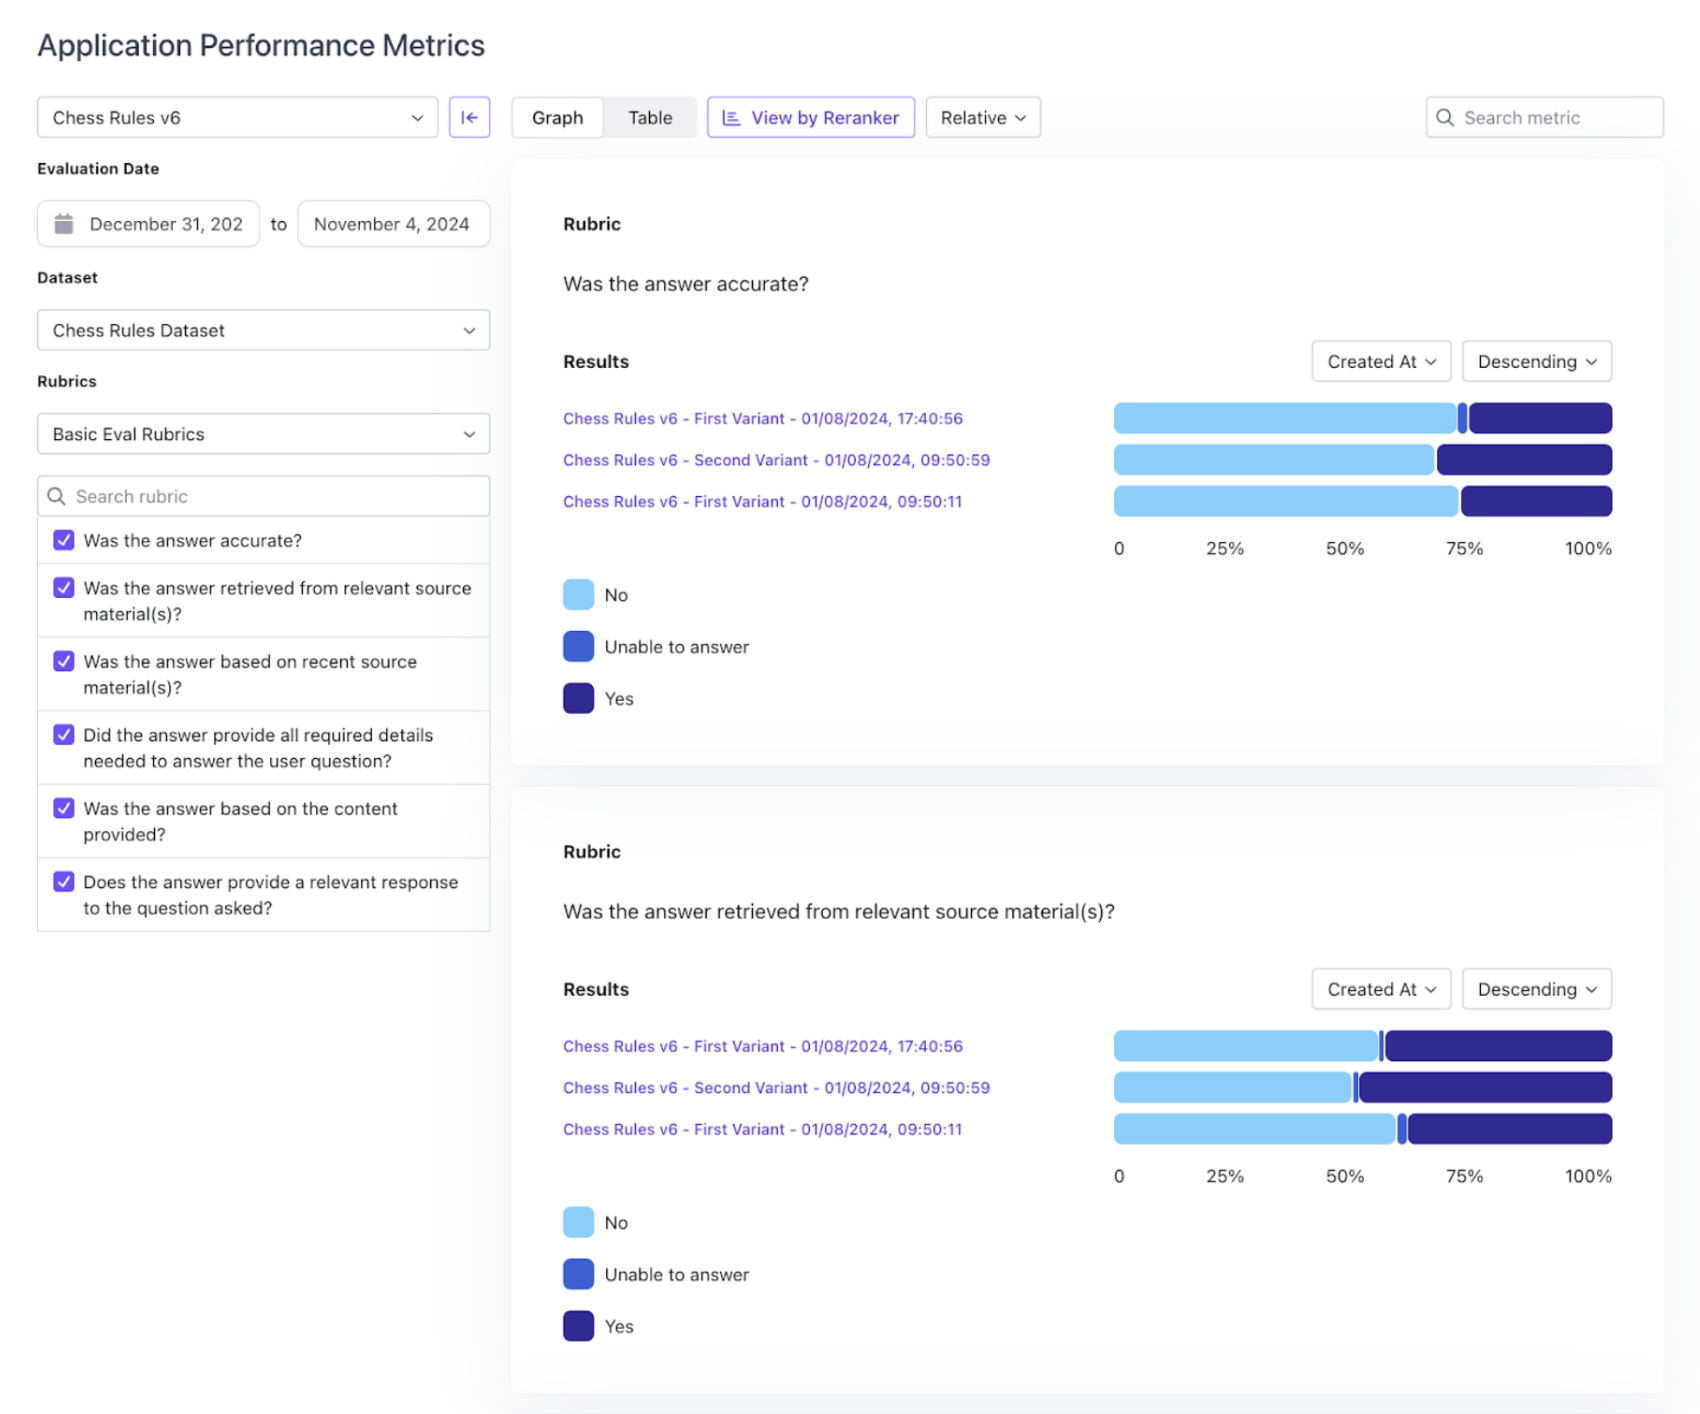
Assign Tasks to Specific Labelers in UI
After an evaluation is kicked-off, users with admin permissions will be able to assign tasks to contributors through the UI on the task dashboard!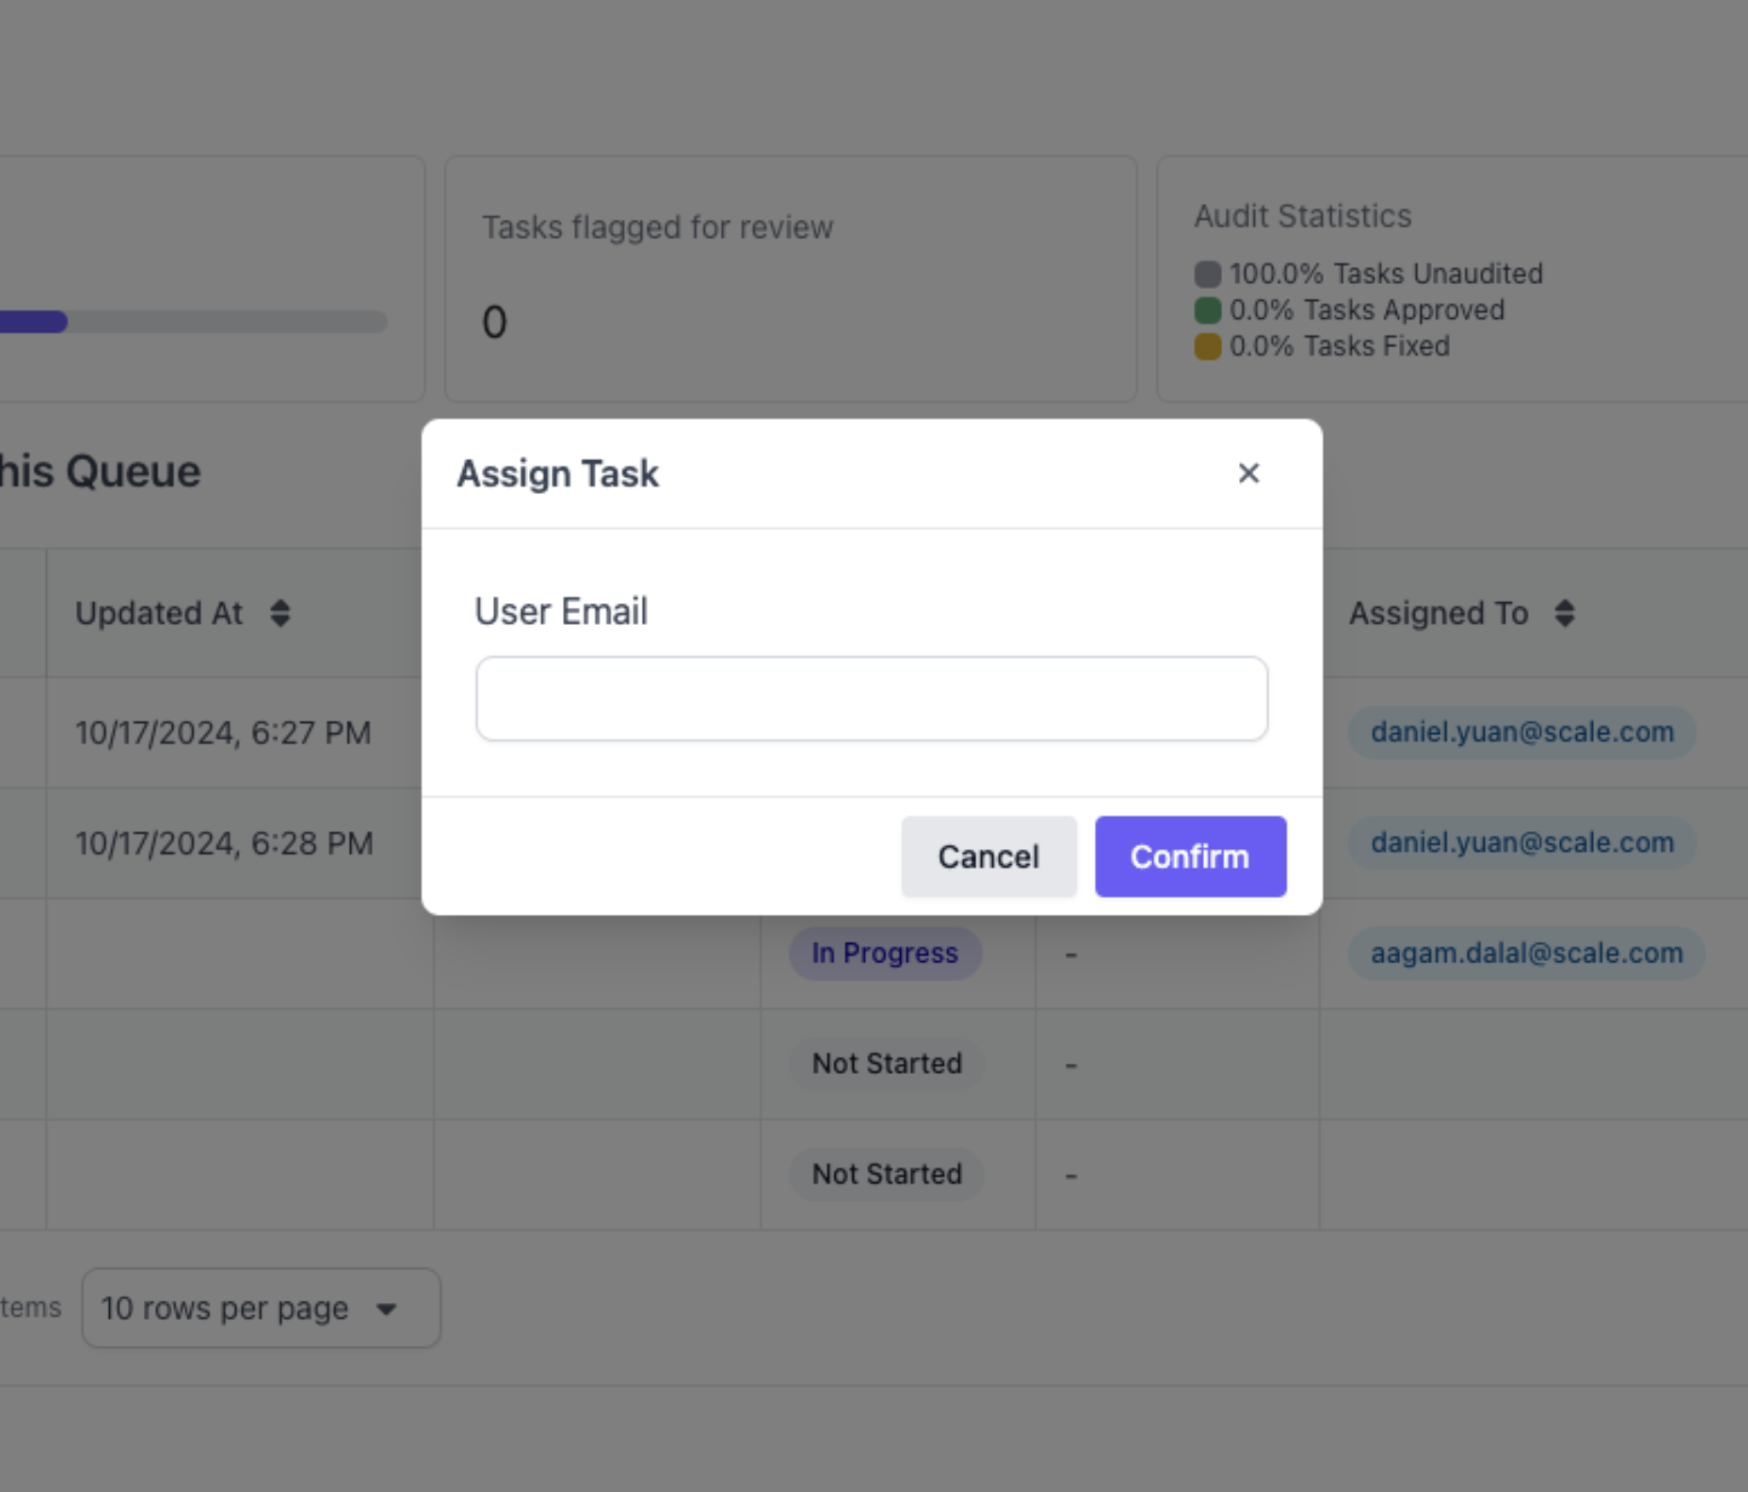
Removed Unused Filter Options from Annotation Project Overview
Removed unused options for “Studio” and “Scale GP” to filter Annotation projects, which were artifacts of previous versions of the platform. This avoids user confusion.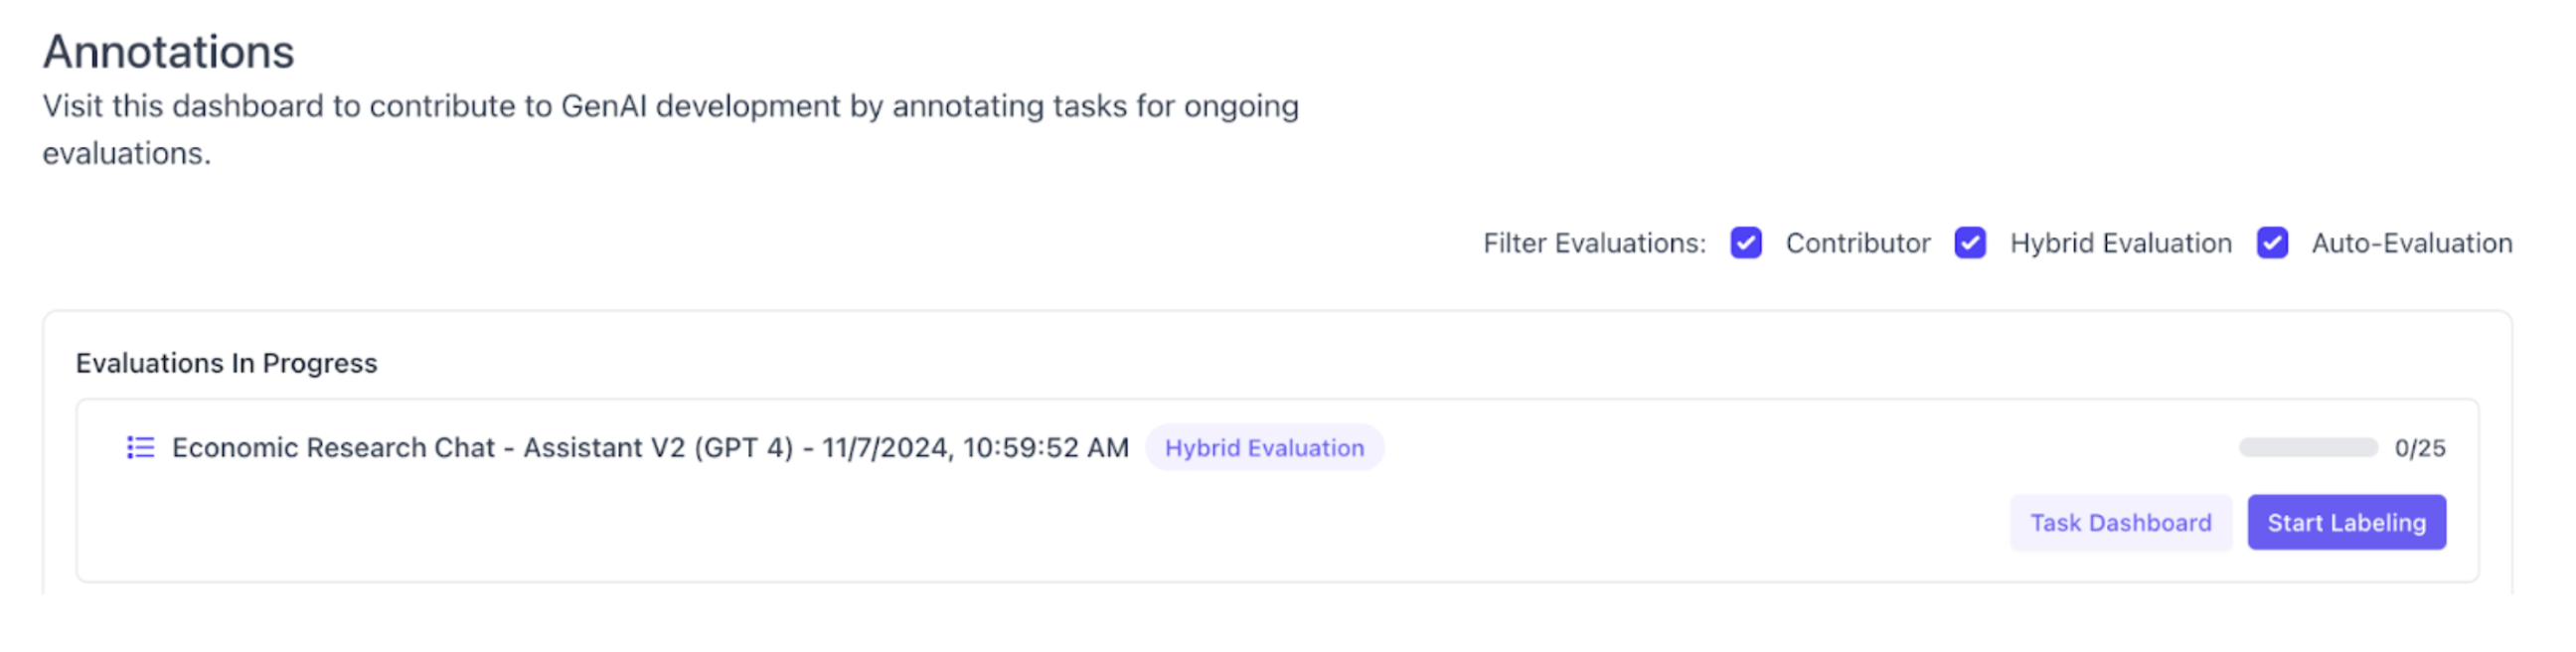
Version Numbering
SGP will now display the software version in the platform UI. You can see the version by opening the bottom left context menu.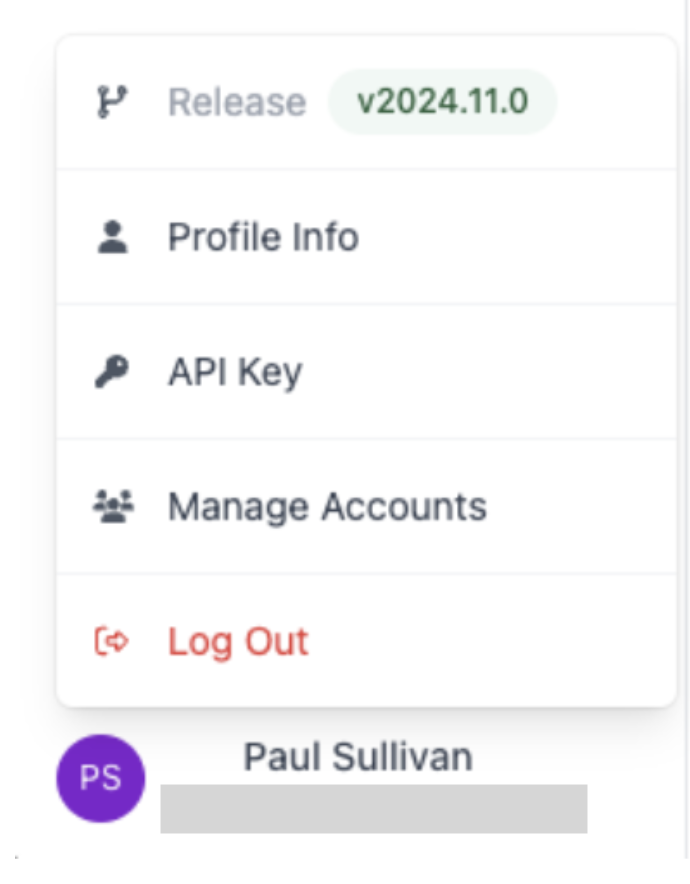
Bug Fixes
Claimed Tasks not refreshed
After a task is claimed it was not immediately showing up as such in the task dashboard without a refresh of the page. With this fix, the task shows as claimed immediately when clicking the button.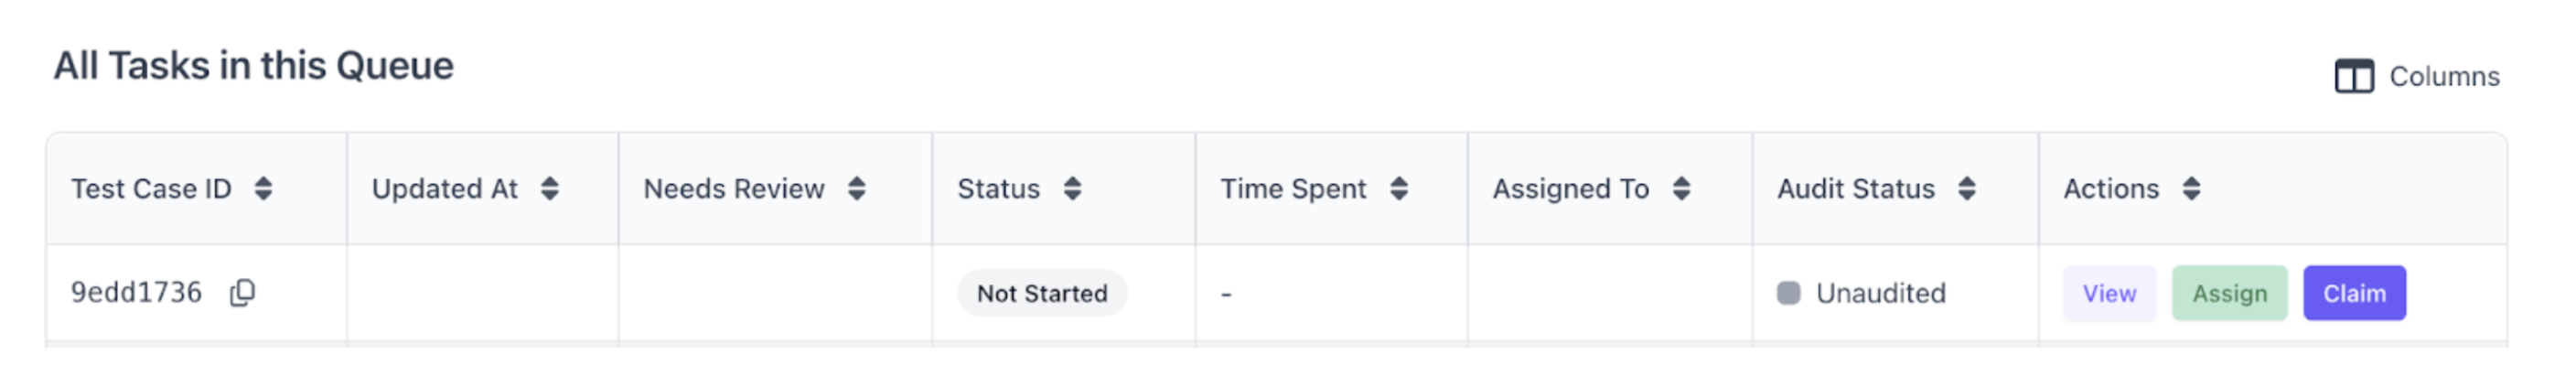
Task Dashboard Loading Time
The Task Dashboard previously had long loading times if more than a few hundred tasks were included in a project. After optimizing frontend queries and introducing pagination, loading times have been reduced significantly.v0.9.1
Version 0.9.1
02-23-2024New Features
1. End to end Annotation Functionality in ScaleGP
Users now have the ability to conduct human-expert evaluations entirely within Scale GP, eliminating the need to switch to Scale Studio as previously required. This capability is made possible through the implementation of a new task queuing backend and a user interface designed to facilitate the viewing and initiation of evaluation tasks. Features allowing users to prioritize annotation projects and assign annotators to those projects are scheduled for release in the near future.To facilitate seamless annotation workflows, Scale GP offers role based access control with three user roles: Admin, Manager and Annotator. Managers and Admins will be able to interact with the entire Scale GenAI Platform and manage evaluation runs, including assigning annotation projects and priorities, while annotators (typically SMEs) can focus entirely on the evaluation tasksHow to UseTo get started, users can switch to the new “Annotation” tab on the sidebar and view currently active annotation projects that are ready for labeling. The view also allows users to view legacy annotation projects which are executed using the external Scale Studio queuing system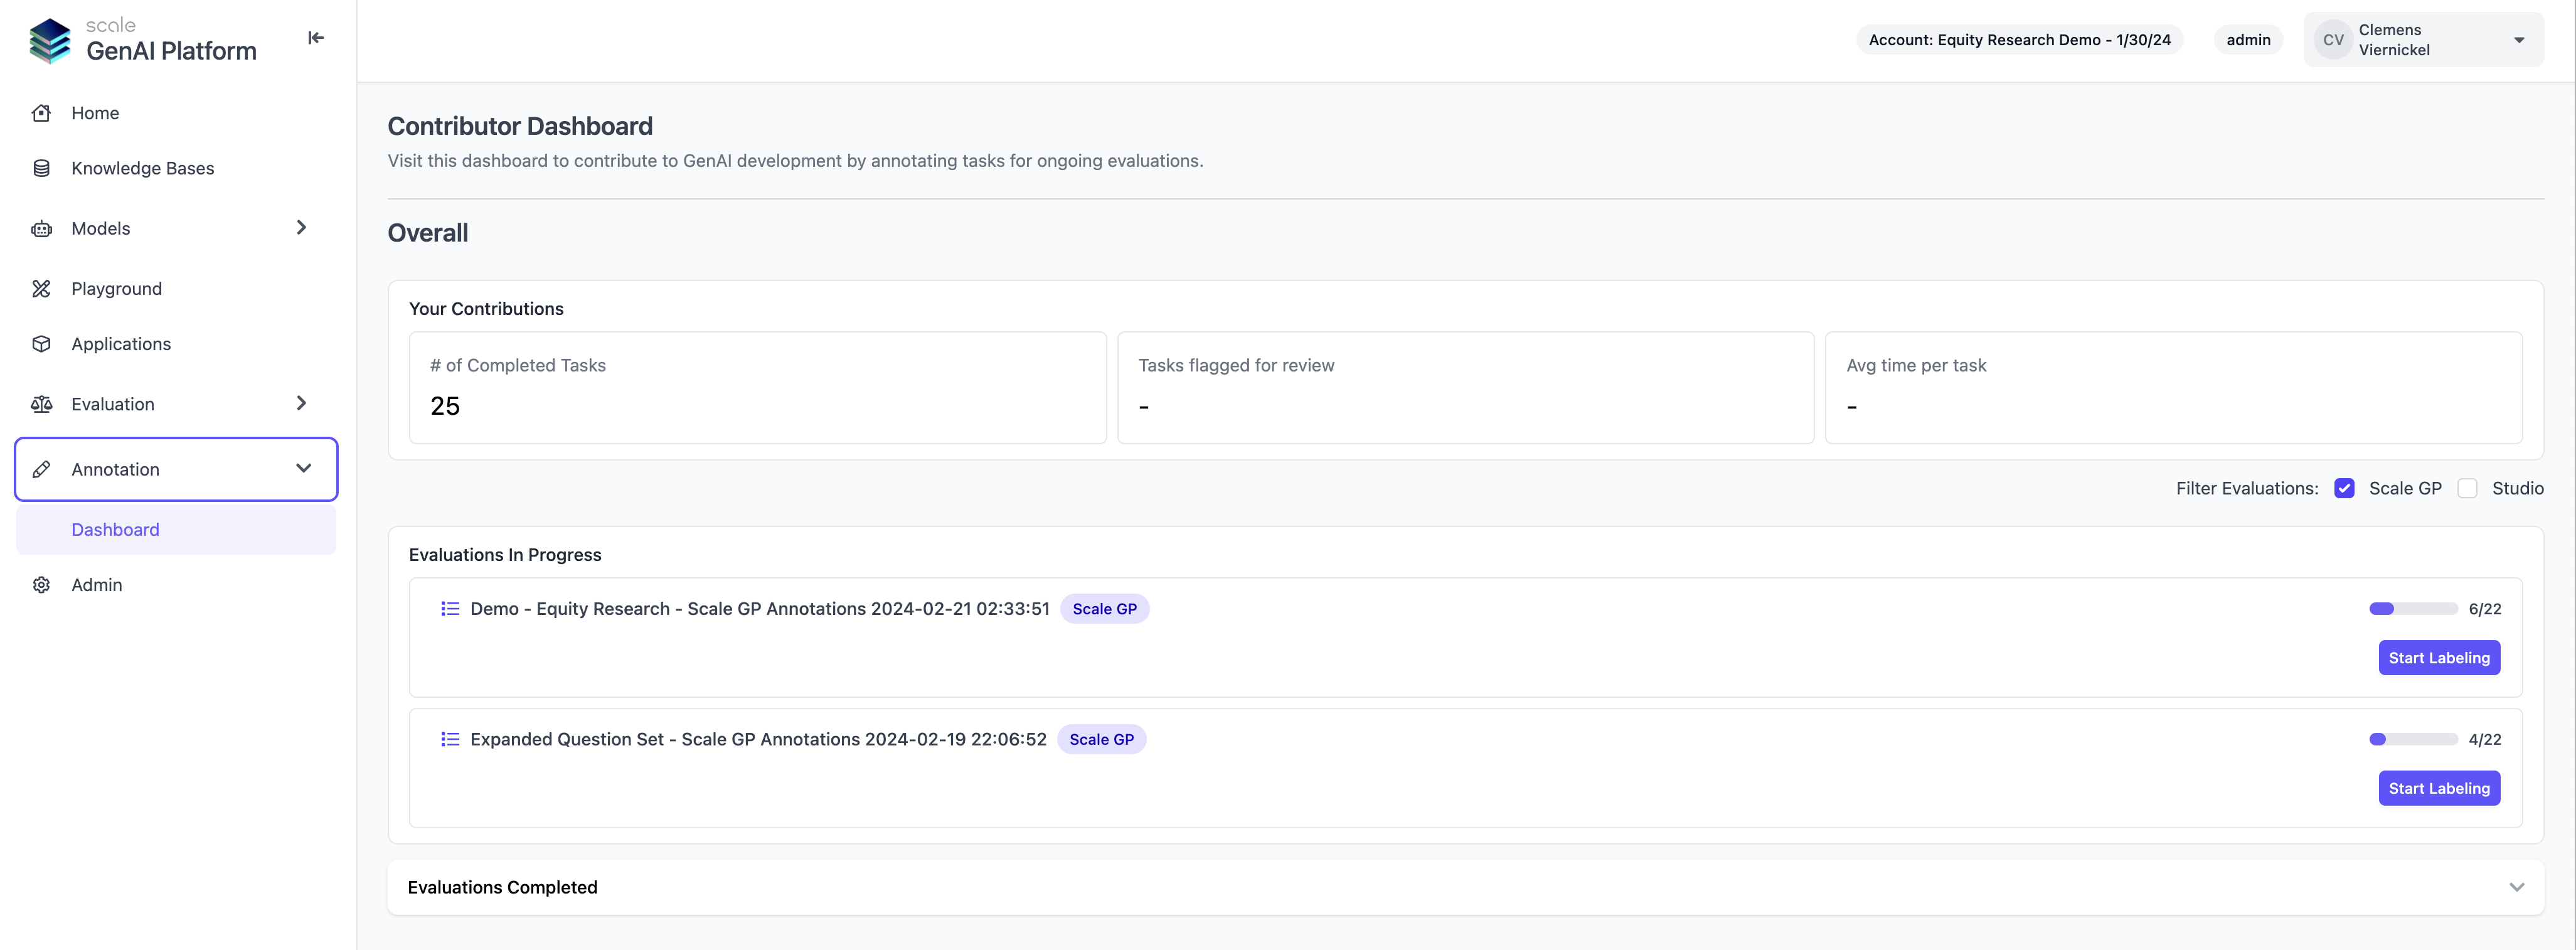
2. Knowledge Base Management
Users can now create and manage their Scale GP knowledge bases via the UI. This makes it significantly easier to monitor the assets uploaded in a knowledge base and to track longer uploads as they are progressing. It also enables users to quickly find and use a relevant knowledge base using the AI playground or when building a custom application with our SDK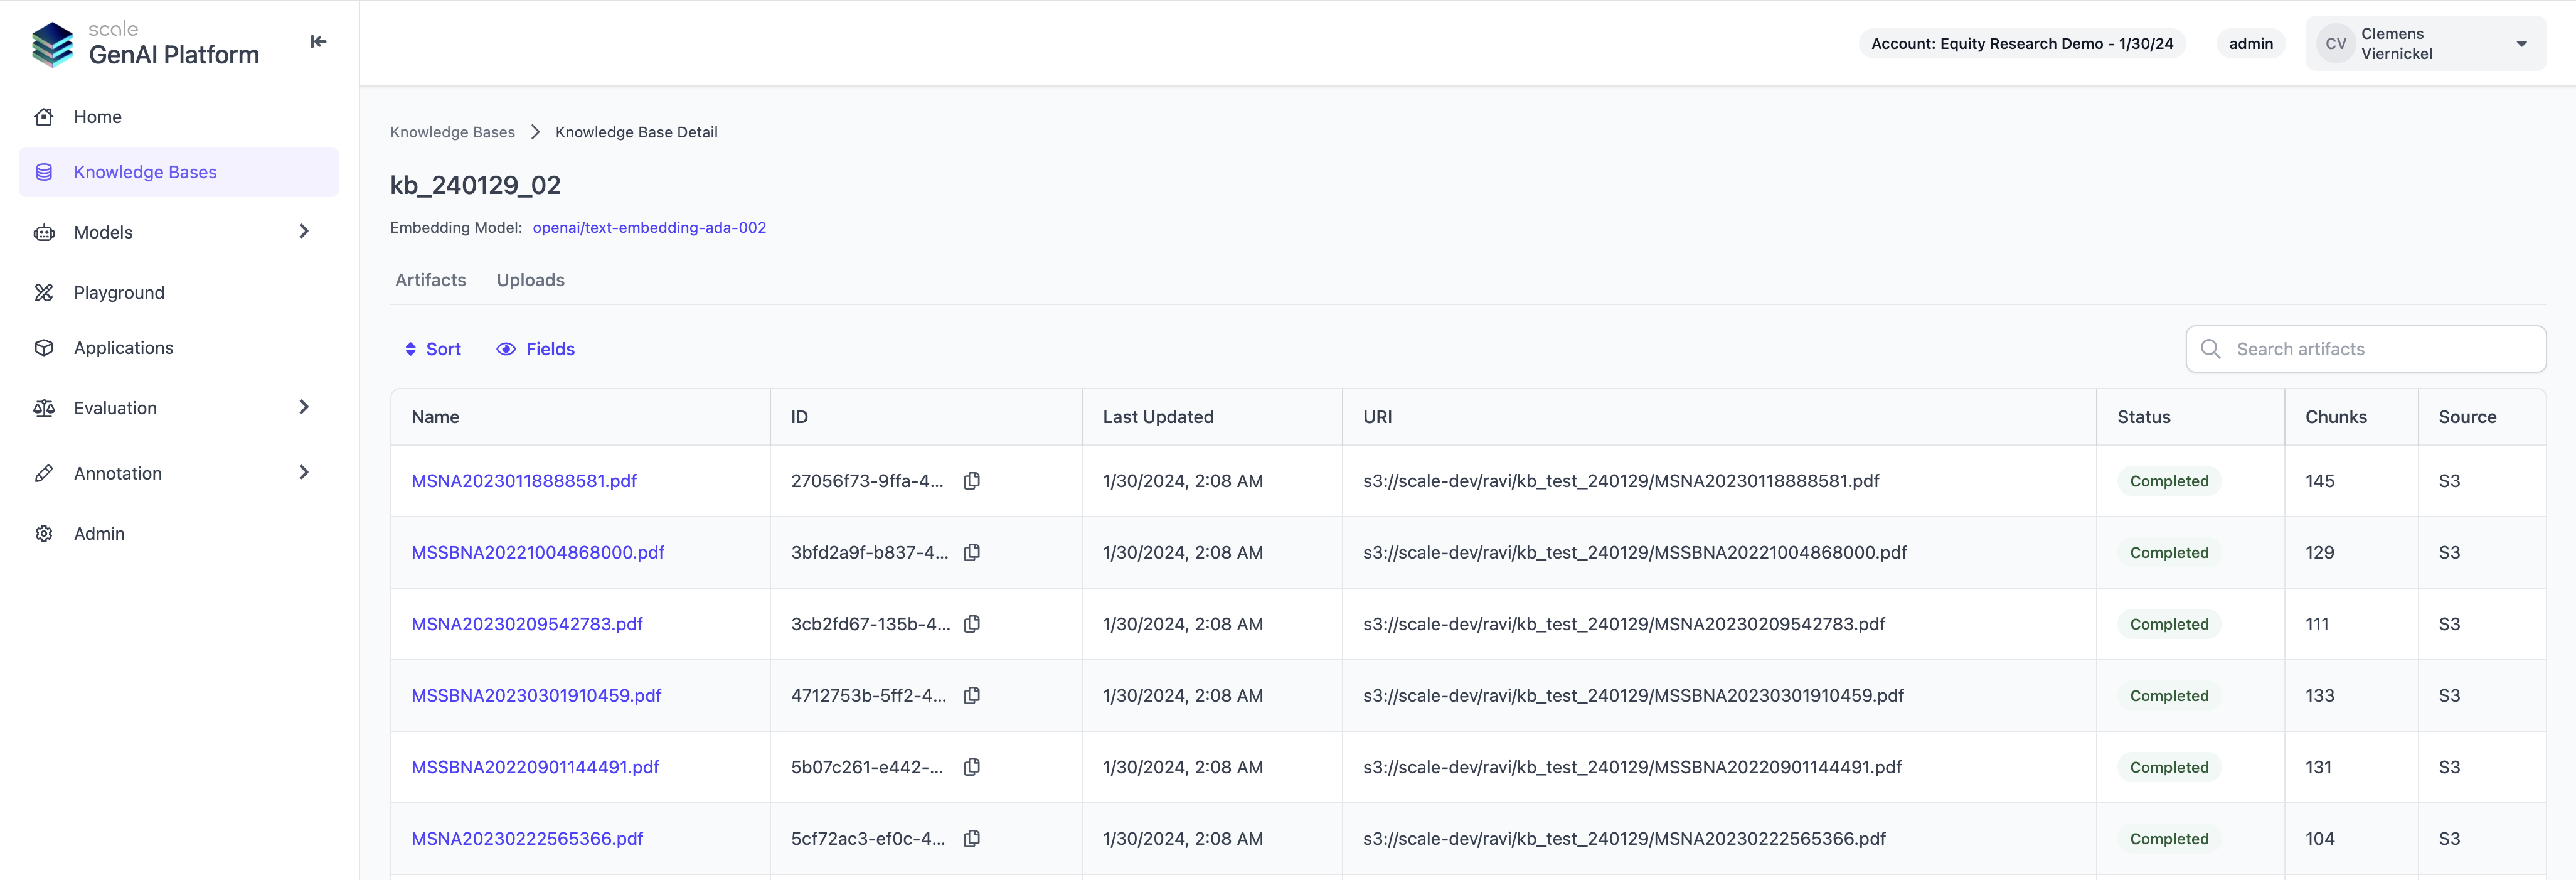
AI Playground
Users can now seamlessly build sample GenAI applications in Scale GP without writing a single line of code. The AI playground provides application templates for typical GenAI use cases such as Retrieval Augmented Generation (RAG), which can be configured in a no-code setup flow, selecting any of the knowledge bases and models that are available on the platform. After completing a setup, users can easily export the sample application for further customization or deployment.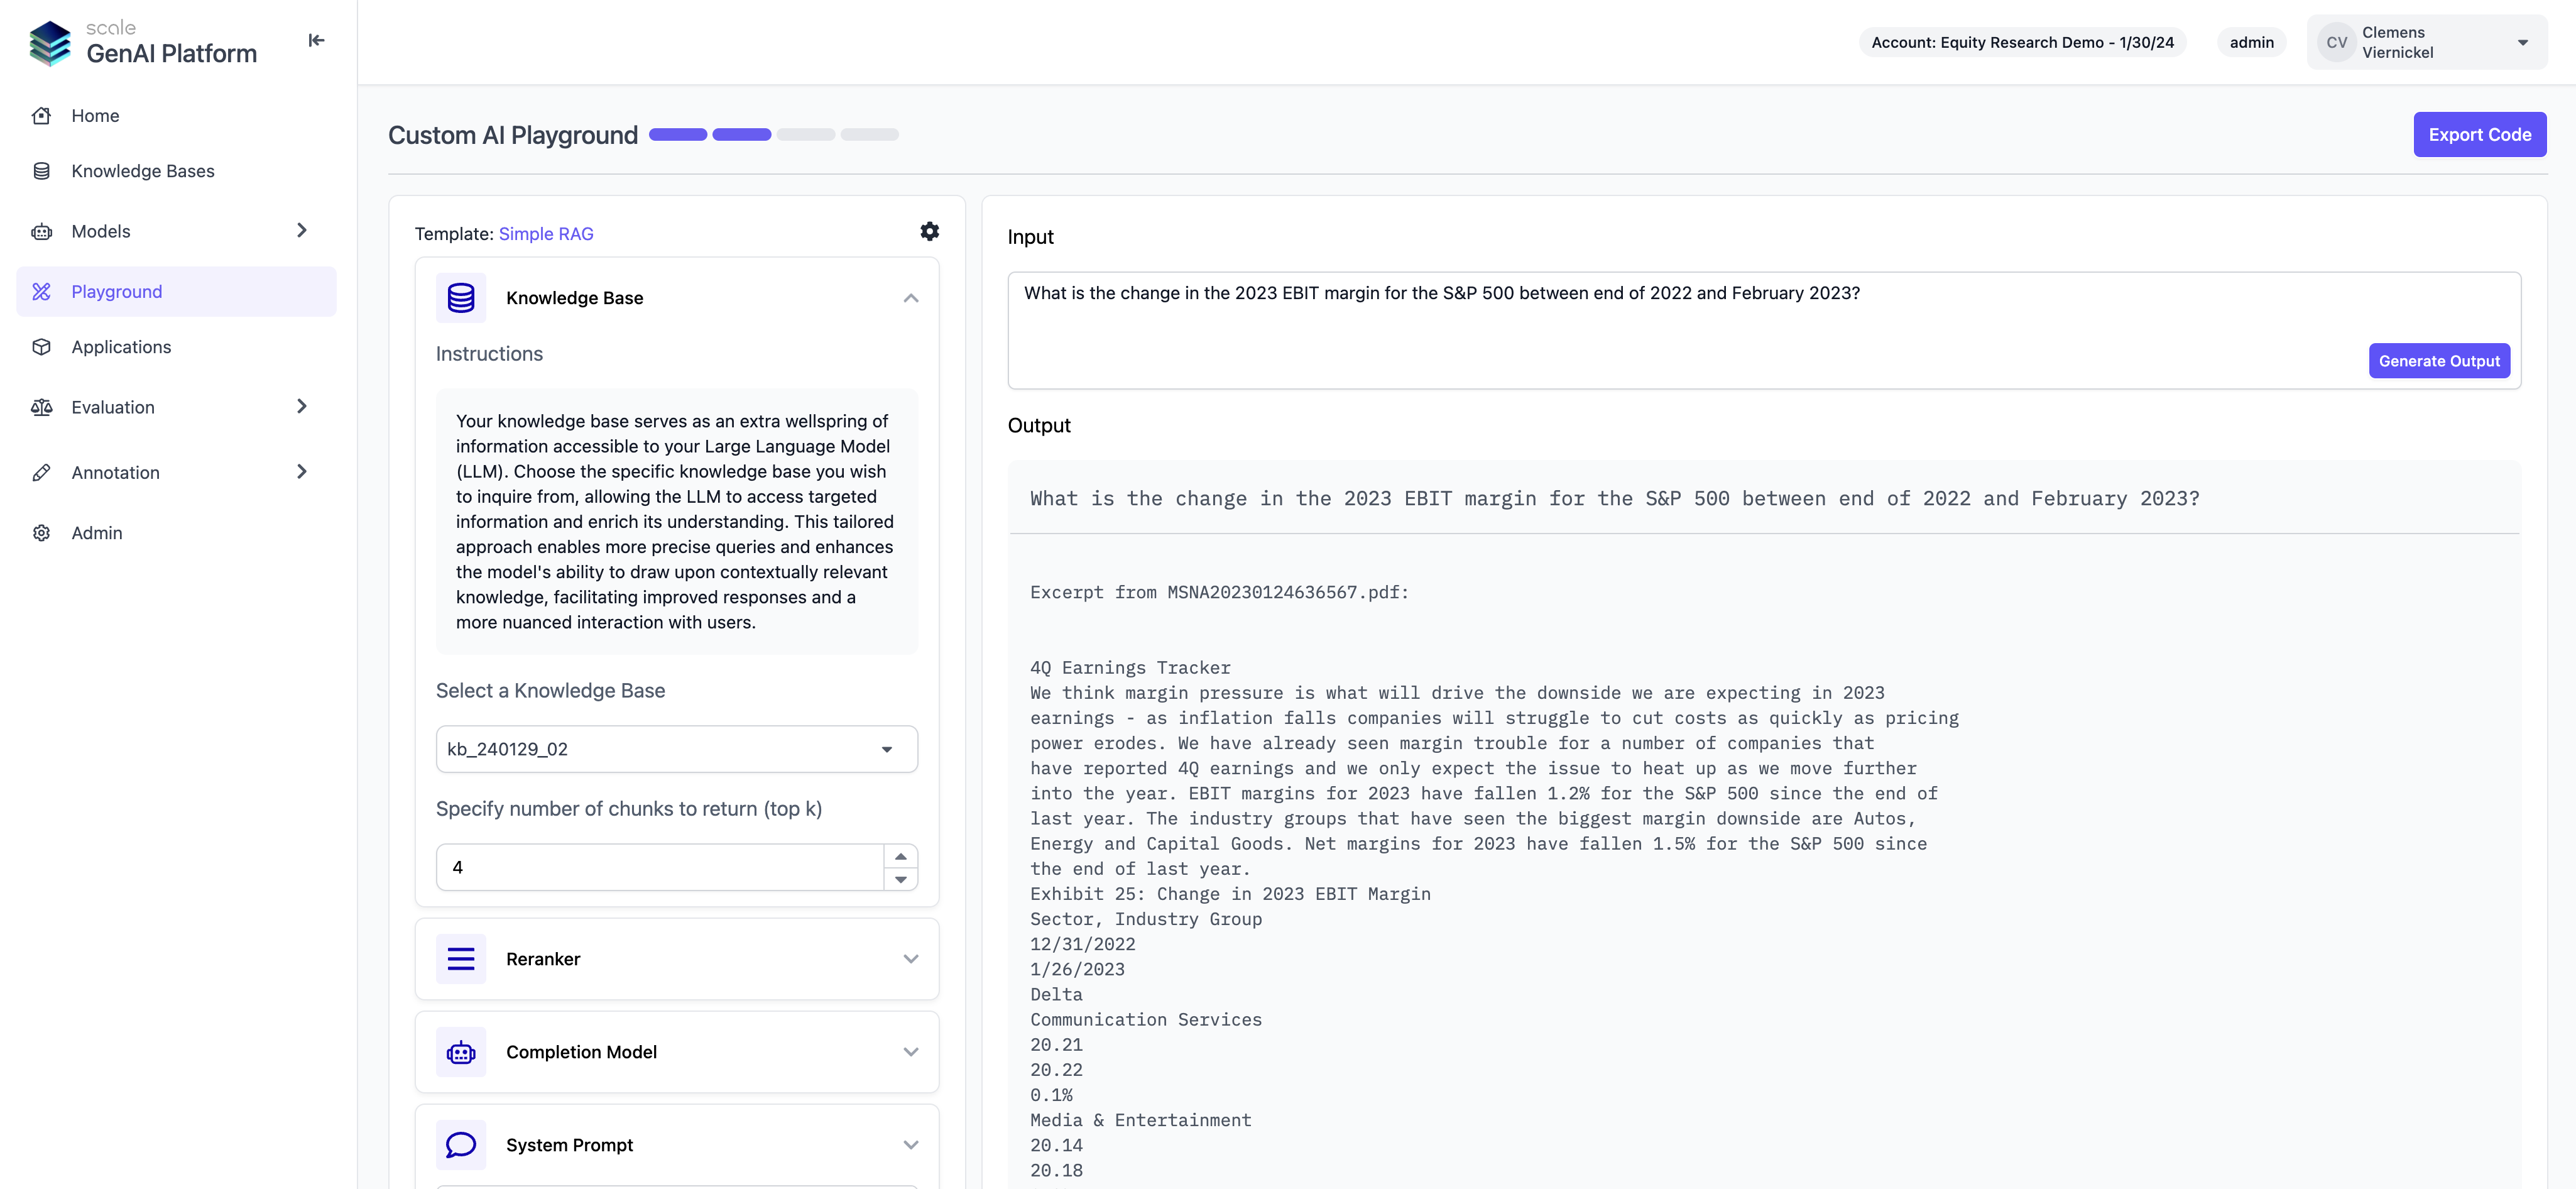
Self-Service Model Fine Tuning
Restructured the annotation view to show generated and expected output, as well as context side by side, which helps annotators compare results to ground truth more efficiently. We will also soon be adding functionality to better navigate retrieved context chunks and a simplified flow to copy sections from context into the evaluation form.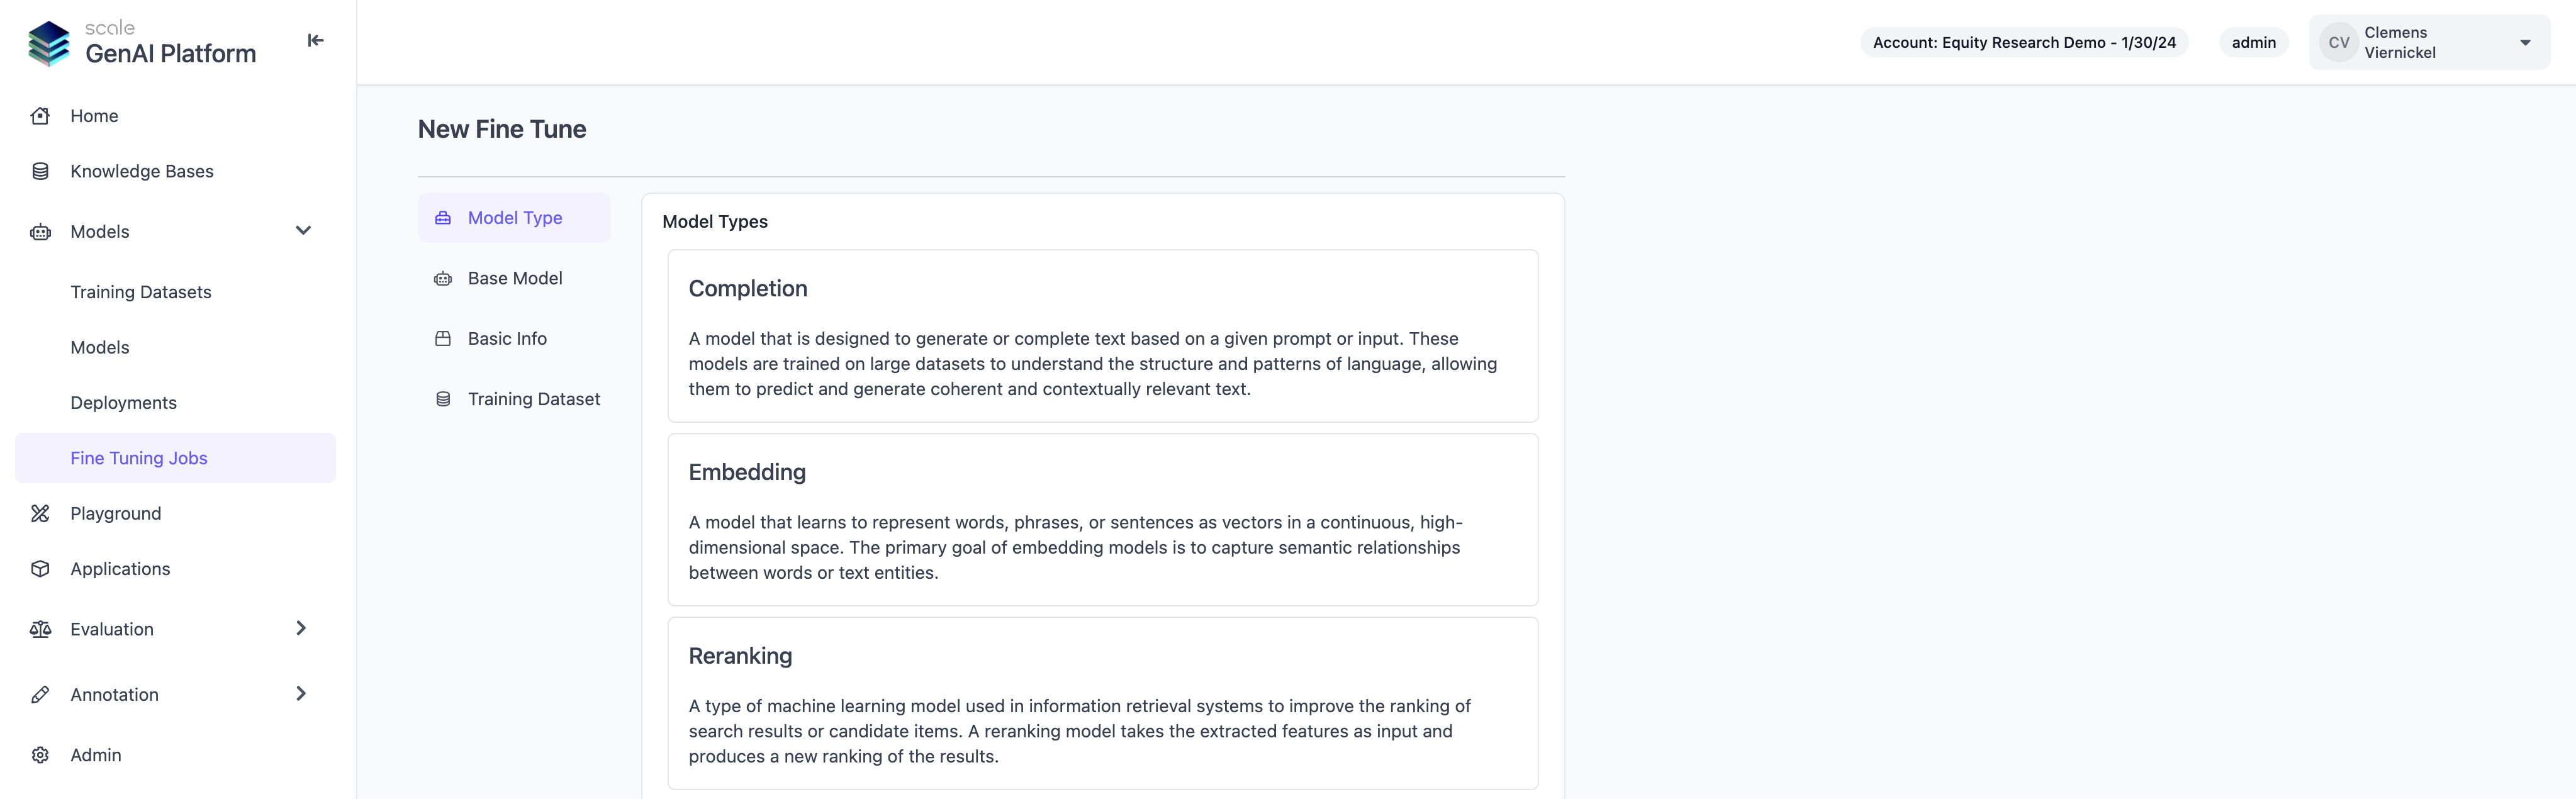
Enhancements
More Efficient Annotation Interface
Restructured the annotation view to show generated and expected output, as well as context side by side, which helps annotators compare results to ground truth more efficiently. We will also soon be adding functionality to better navigate retrieved context chunks and a simplified flow to copy sections from context into the evaluation form.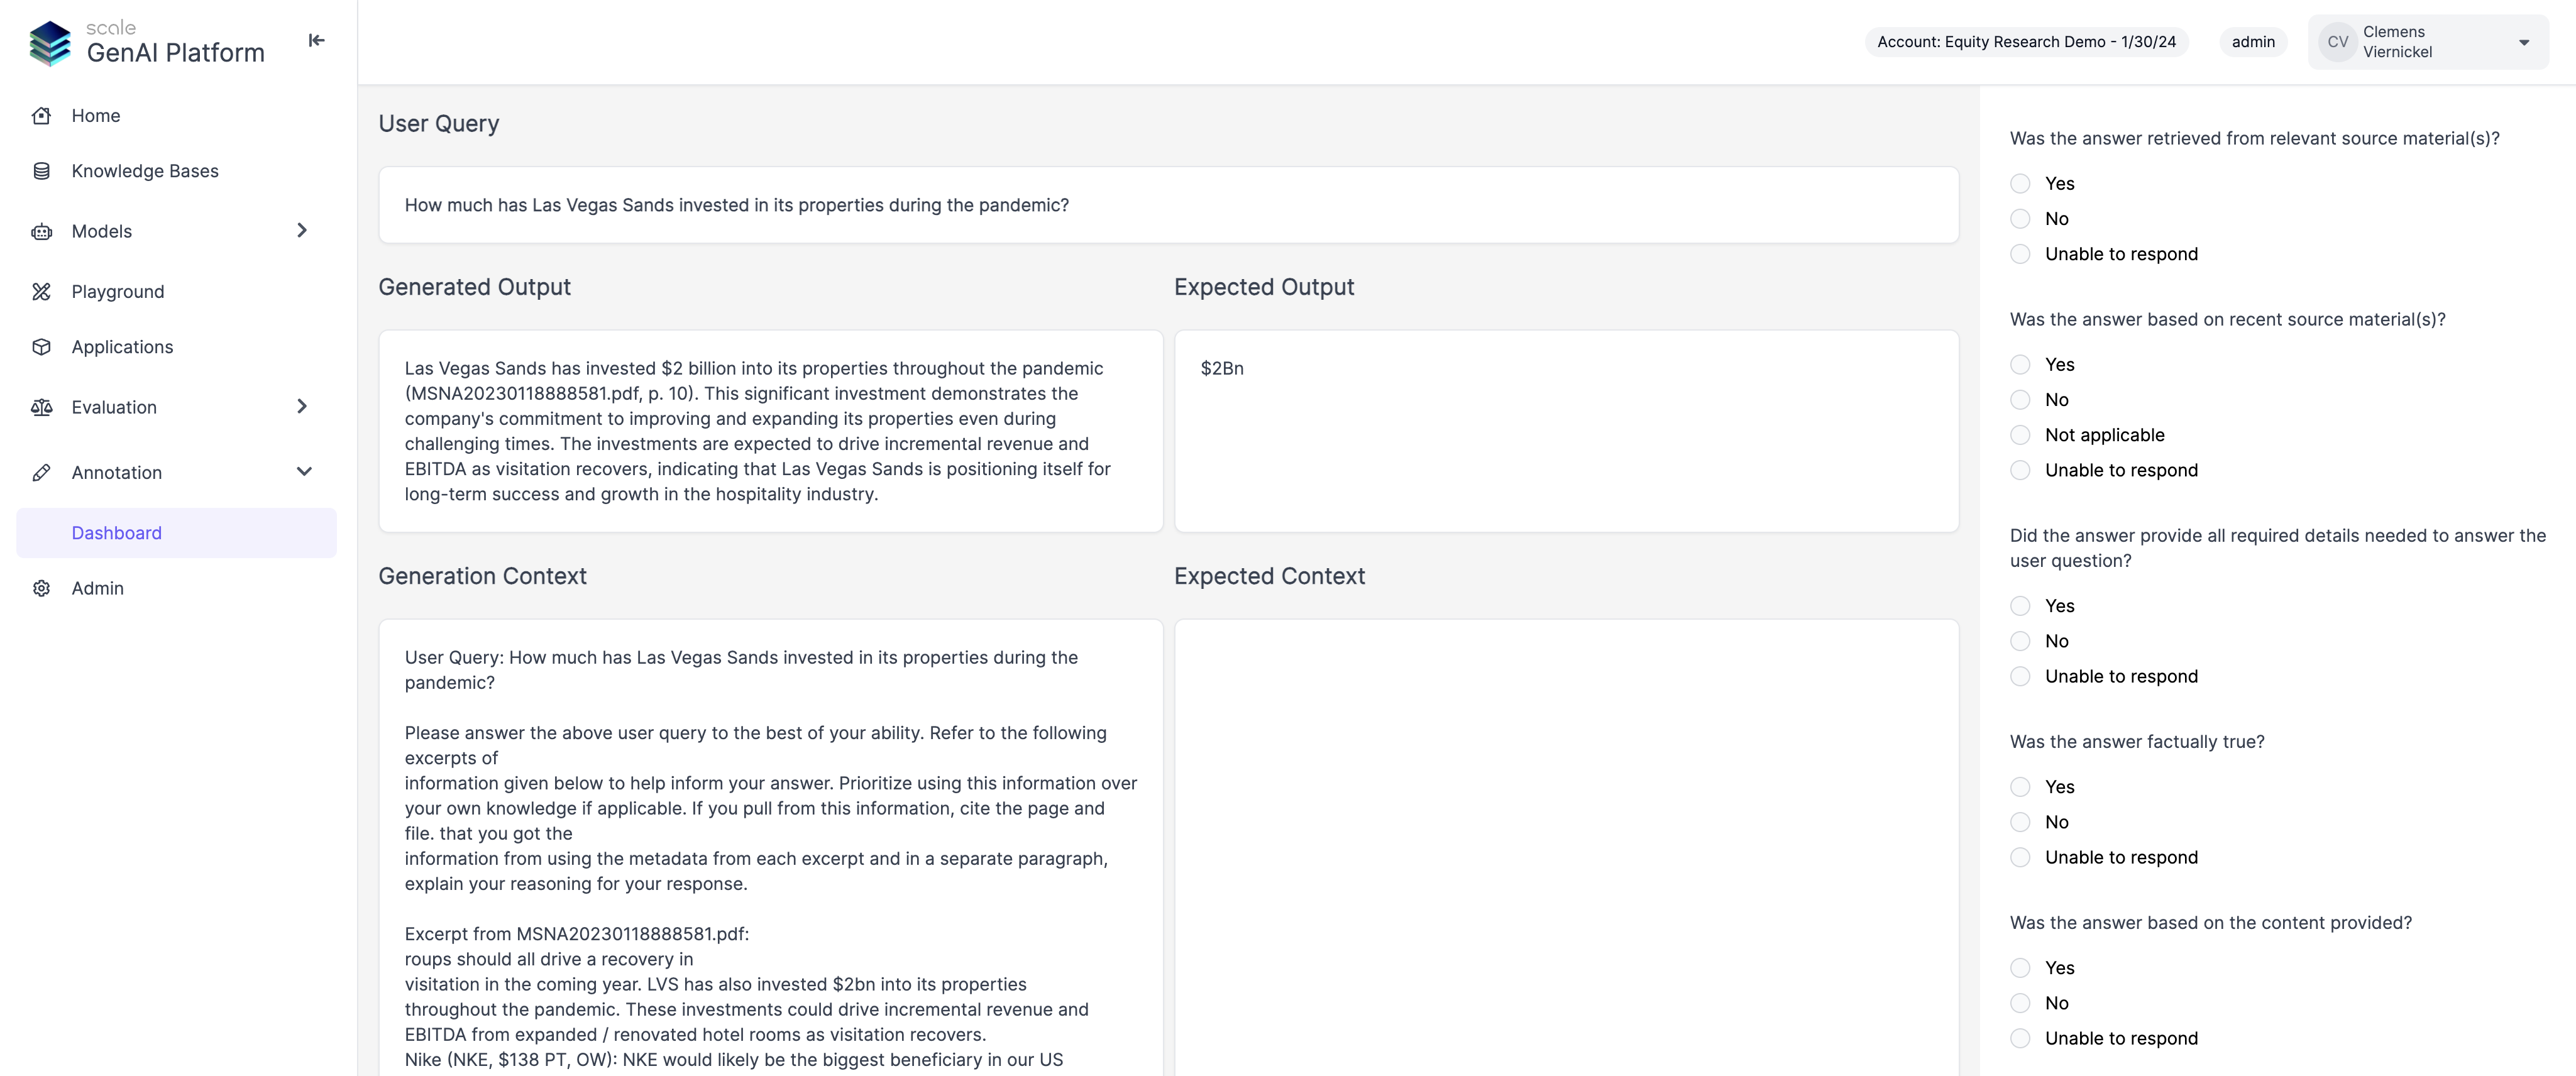
Reports for Evaluation Results and Annotator Performance
Users are now able to see metrics and charts for evaluation runs, which makes it significantly easier to analyze results, track progress and identify regressions. We currently support charts and metrics for each individual evaluation run, as well as for the collection of all evaluation runs of a single application over time. Admin and manager users can also download reports for further analysis and record keeping.