When to Use
Use timeseries widgets to:- Track metric trends over time across evaluation runs
- Compare performance across evaluations in an evaluation group
- Monitor score progression across multiple evaluation iterations
- Visualize how metrics change as new evaluations are added to a group
Configuration
Required Fields
Widget display name shown on the dashboard
Must be set to “timeseries”
SeriesQuery with at least one aggregation
Query Requirements
Timeseries widgets require a SeriesQuery with:- At least one aggregation in the
selectclause - The x-axis is determined automatically based on context:
- Evaluation group dashboards: Uses the evaluation creation date as the x-axis, plotting one line per evaluation
- Can include
filterto narrow the dataset - Supports per-aggregation
evaluation_idsfor eval group dashboards (see below)
Creating in the UI
1
Open Widget Creator
From your dashboard, click “Add Widget” and select “Timeseries”
2
Enter Title
Give your chart a descriptive name (e.g., “Average Score Over Time”)
3
Configure Aggregations
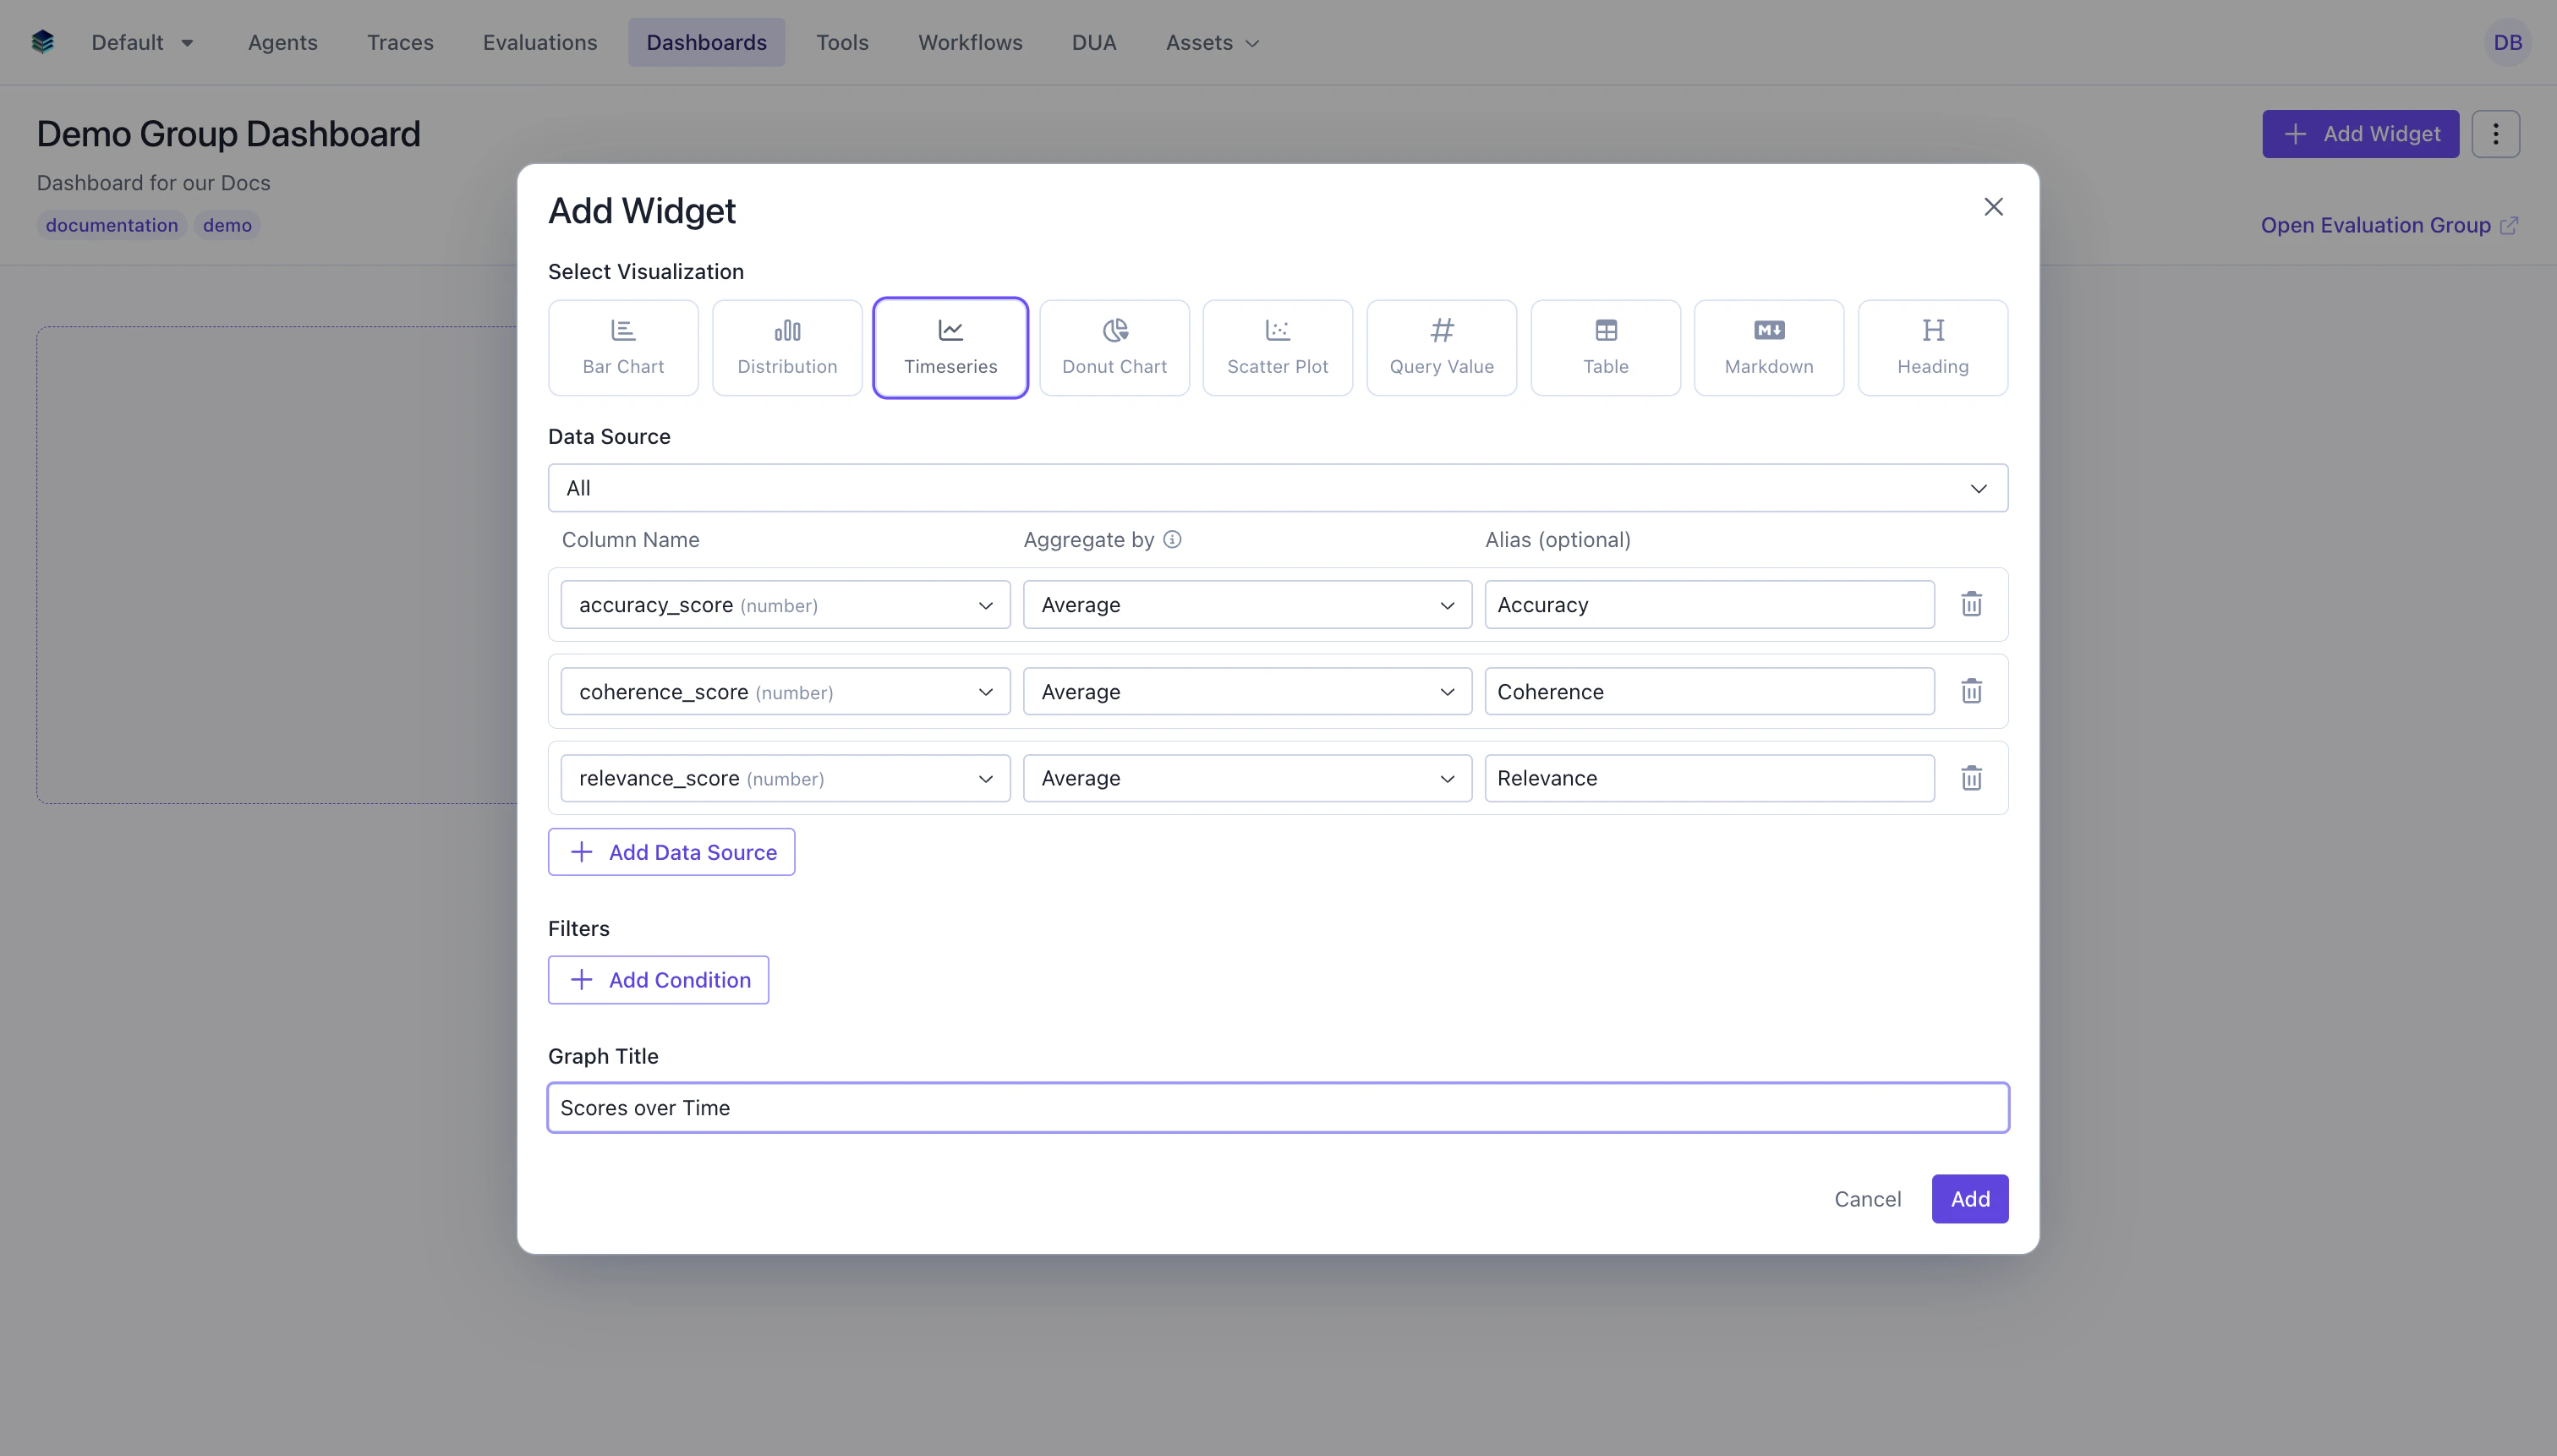
- Column: Select the numeric field to aggregate
- Aggregation: Choose the function (
AVG,SUM,COUNT, etc.) - Alias: Name for the metric line (optional but recommended)
- Evaluations: For eval group dashboards, select which evaluations to include per aggregation
4
Add Filters (Optional)
Add conditions to narrow the data before aggregation.
5
Create Widget
Click “Add” to generate the timeseries chart
Output Format
Timeseries widgets return data points for each time period:Evaluation Group Context
In evaluation group dashboards, timeseries widgets have special behavior:- One line per metric: Each metric in the query is plotted as a separate line on the chart
- X-axis: The evaluation creation date determines the position on the x-axis
- Per-evaluation selection: You can choose which evaluations to include per aggregation, allowing you to compare specific subsets
- Auto-update: When evaluations are added to or removed from the group, the timeseries automatically updates to reflect the new membership
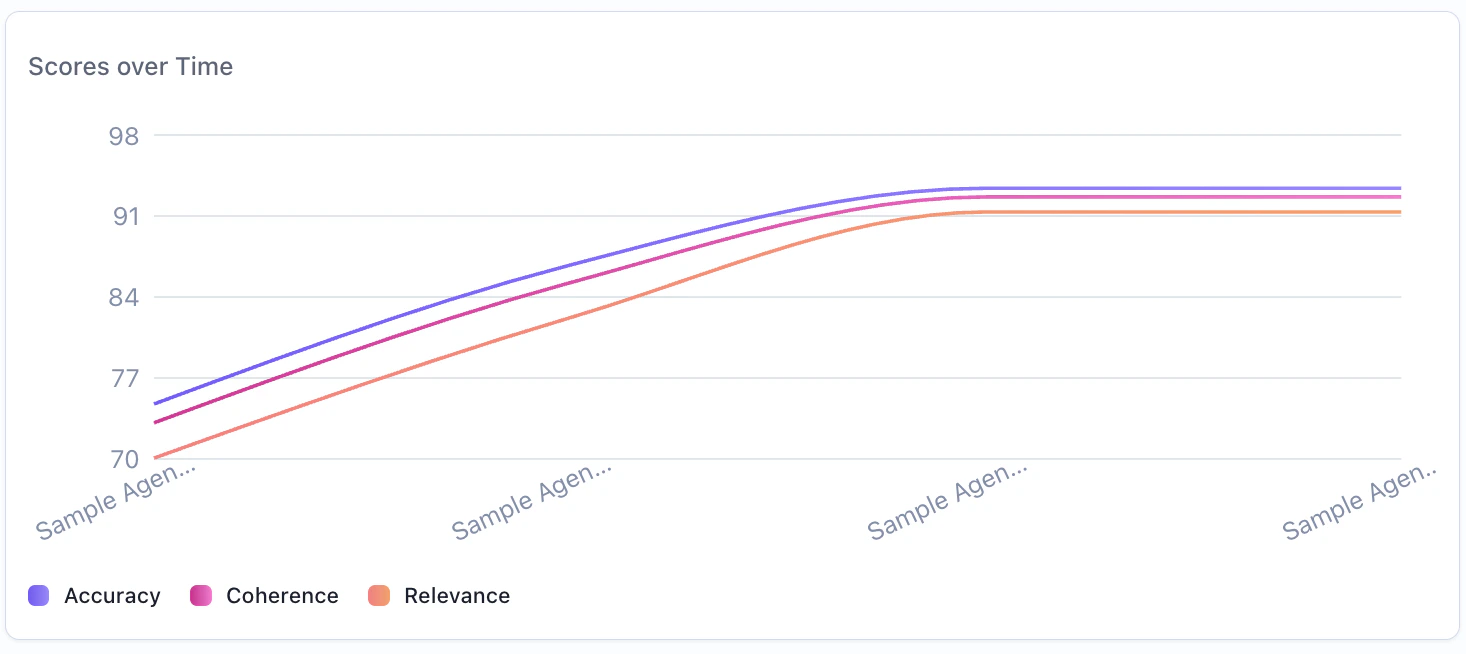
Example: Average Score Trend Across Evaluations
Track how average scores change across evaluation runs in a group.Example: Multi-Metric Comparison Over Time
Track multiple metrics across evaluations to see how different scores evolve.Related Documentation
- Evaluation Group Dashboards - Full guide on group dashboards
- Bar Chart Widget - For categorical comparisons
- Metric Widget - For single computed values
- Query Language - Aggregation and filter syntax
- API Reference - Programmatic chart creation