Using Sample Data: The examples on this page use fields from our sample dataset. Download it and create an evaluation with it to follow along with this tutorial.
When to Use
Use donut chart widgets to:- Show proportional distribution of categories
- Visualize percentage breakdowns at a glance
- Compare relative sizes of groups
- Highlight dominant categories in your data
Configuration
Required Fields
Widget display name shown on the dashboard
Must be set to “donut”
SeriesQuery with
GROUP BY for categorical breakdownX-Axis Configuration (One Required)
You must provide eitherx_column or x_column_group, but not both:
Single column name to group by for slices. Each unique value becomes a slice.Example:
"task_type" - creates slices for each task typeArray of column names for multi-dimensional grouping. Creates slices for each unique combination.Example:
["agent_name", "task_type"] - creates slices for each agent-task combinationQuery Requirements
Donut chart widgets require a SeriesQuery with:groupByfor categorical breakdown (required)- At least one aggregation for slice values (
COUNT,SUM,AVG, etc.) - Can include
filterto narrow the dataset
The donut chart automatically limits display to the top 10 slices. Any remaining categories are grouped into an “Other” slice.
Creating in the UI
1
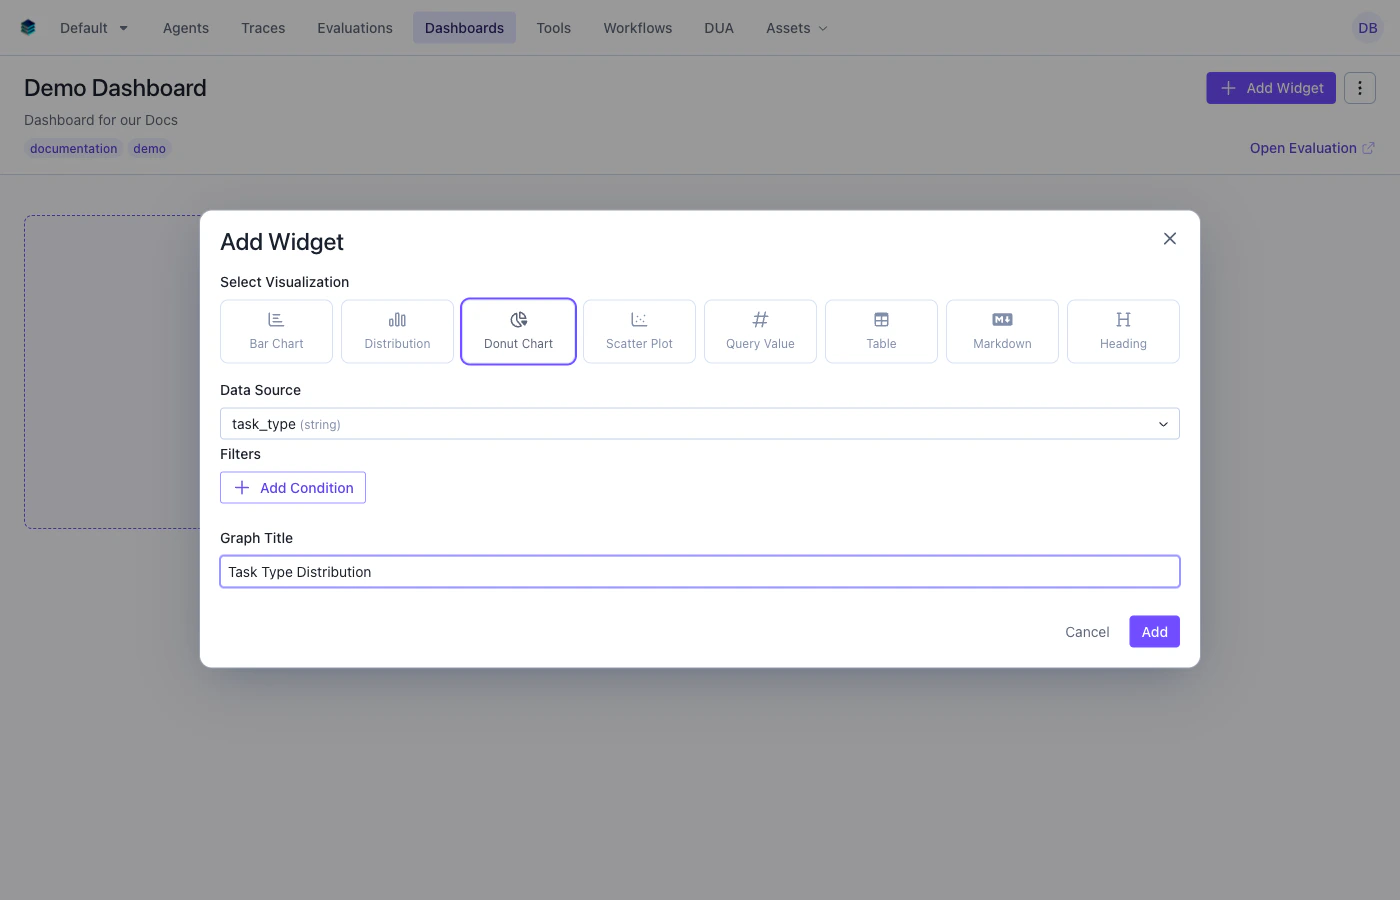
Open Widget Creator
From your dashboard, click “Add Widget” and select “Donut Chart”
2
Enter Title
Give your chart a descriptive name (e.g., “Task Type Distribution”)
3
Configure Query
- Group By: Select the categorical dimension - each unique value becomes a slice
- Aggregation: Add a count aggregation to the query. This will be used to size the slices and is handled automatically in the UI.
- Filter: Add conditions to narrow the data (optional)
4
Create Widget
Click “Add” to generate the donut chart
Output Format
Donut chart widgets use the same series format as other chart types:Example Use Cases
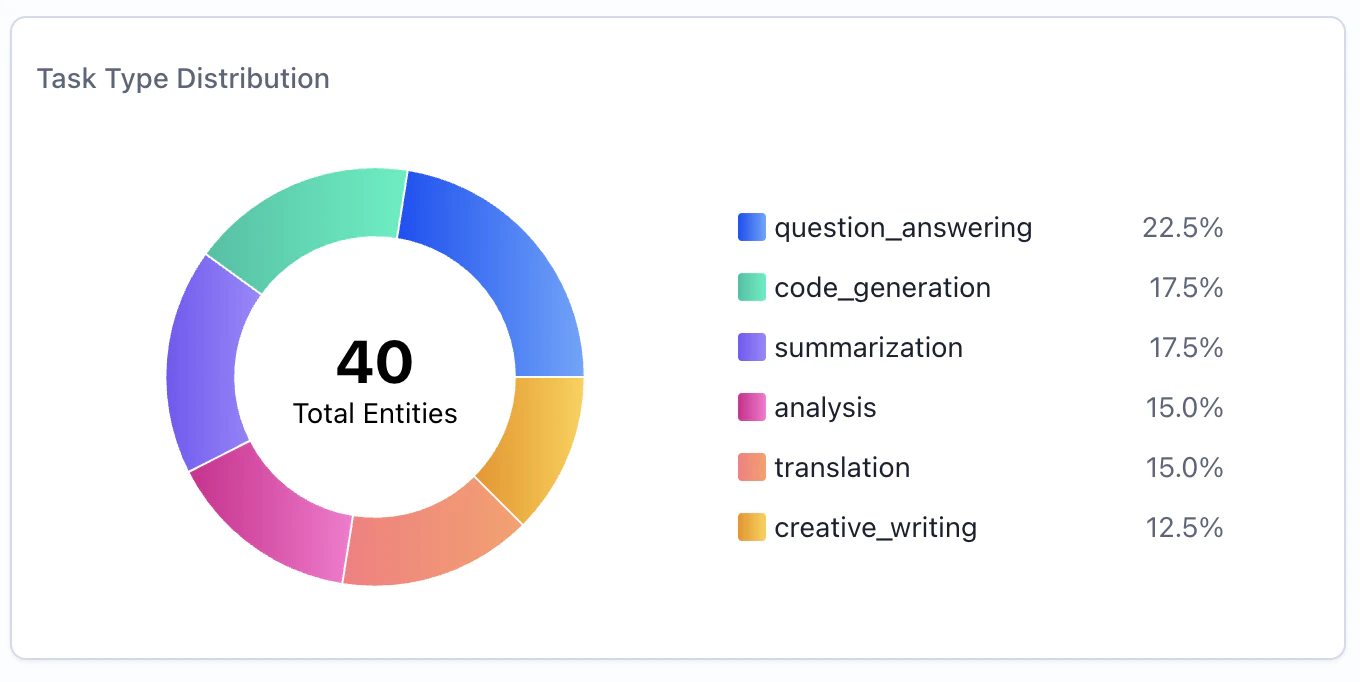
Use Case 1: Distribution by Task Type
Show how evaluation items are distributed across task types.Use Case 2: Agent Workload Distribution
Visualize how many evaluation items each agent has processed.Use Case 3: Prompt Category Breakdown with Filter
Show the distribution of prompt categories, filtered to only high-scoring items.Related Documentation
- Bar Chart Widget - For side-by-side categorical comparisons
- Table Widget - Detailed numerical breakdowns
- Query Language -
GROUP BYand aggregation syntax - API Reference - Programmatic chart creation