Overview
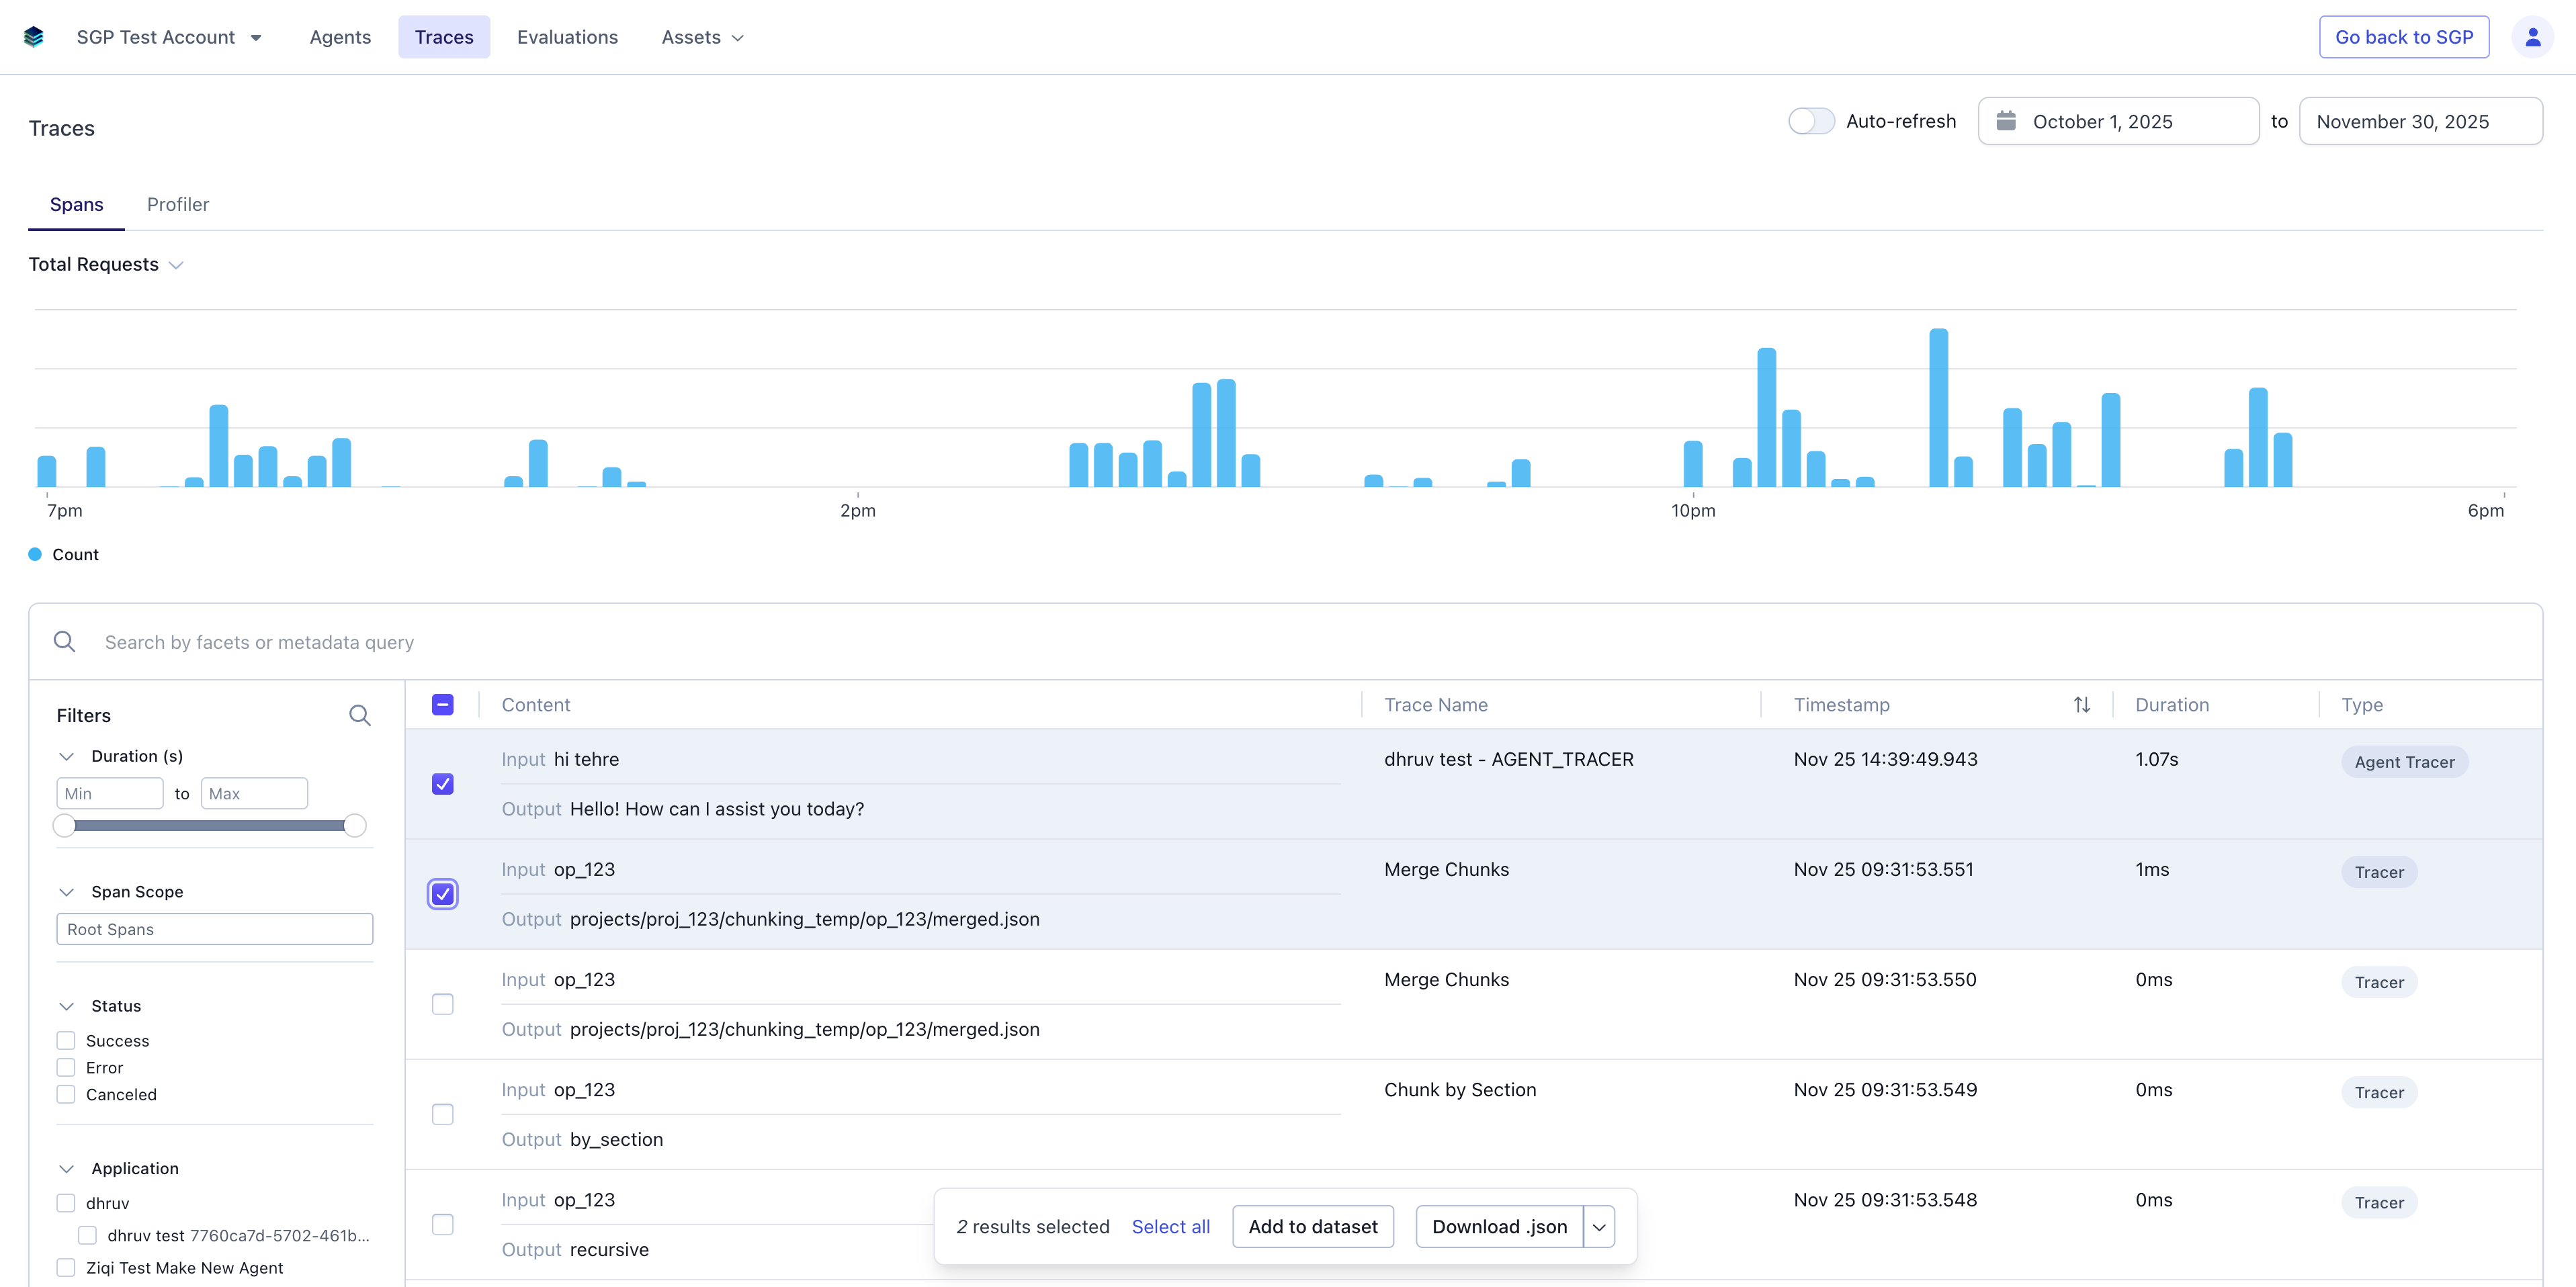
The Traces page provides a comprehensive interface for monitoring, filtering, and analyzing trace data from your instrumented applications. This dedicated UI gives you visibility into your workflows, allowing you to identify performance bottlenecks, debug errors, and understand the execution flow of complex operations. At the top right of the page, you’ll find a date range selector that allows you to filter traces by time period. Adjusting this date range updates both the overview metrics graphs and the traces table to show only data from your selected timeframe. You can also toggle auto-refresh to automatically update the view with new traces as they arrive.
Overview Metrics
At the top of the Traces page, you’ll find three interactive graphs that provide high-level insights into your trace data over time. You can switch between different views by clicking the tabs:Total Requests
The Total Requests view shows the volume of traces over time, giving you a quick overview of activity levels. Hover over any point in the graph to see the exact count of traces for that time period. This helps you identify traffic patterns, usage spikes, or periods of low activity.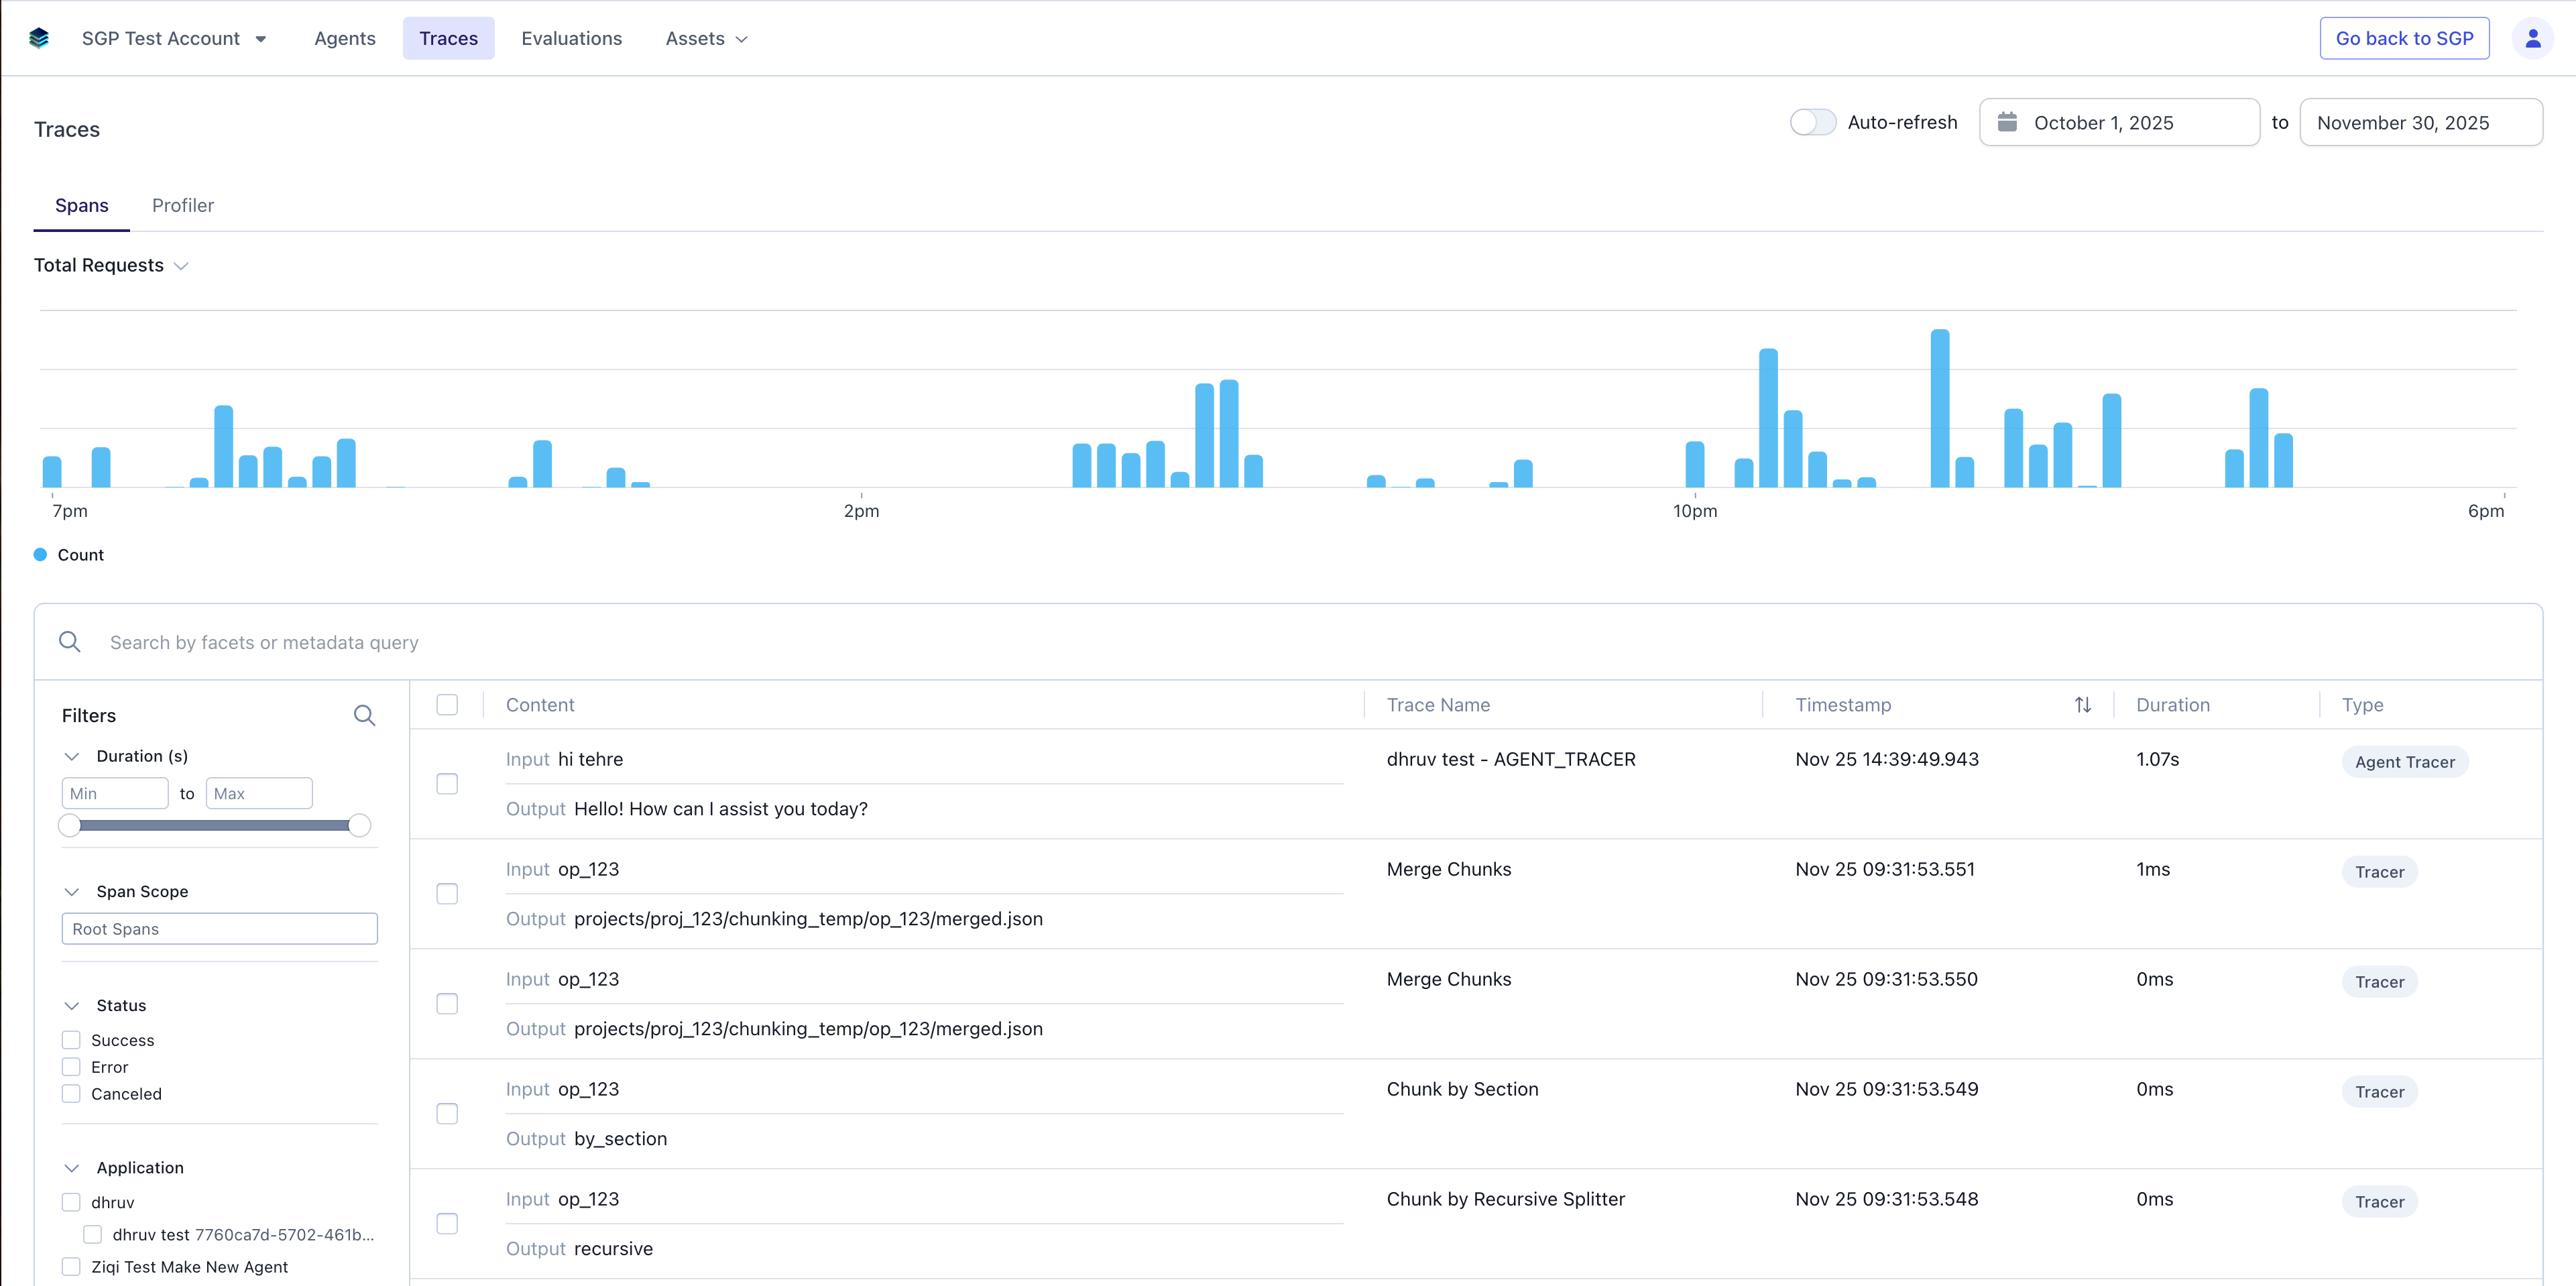
Latency
The Latency view displays performance metrics across your traces, showing p50 (median), p75, and p95 percentile response times. This multi-line graph helps you understand not just average performance, but also worst-case scenarios and performance consistency. Spikes in p95 latency can indicate performance issues affecting a subset of requests.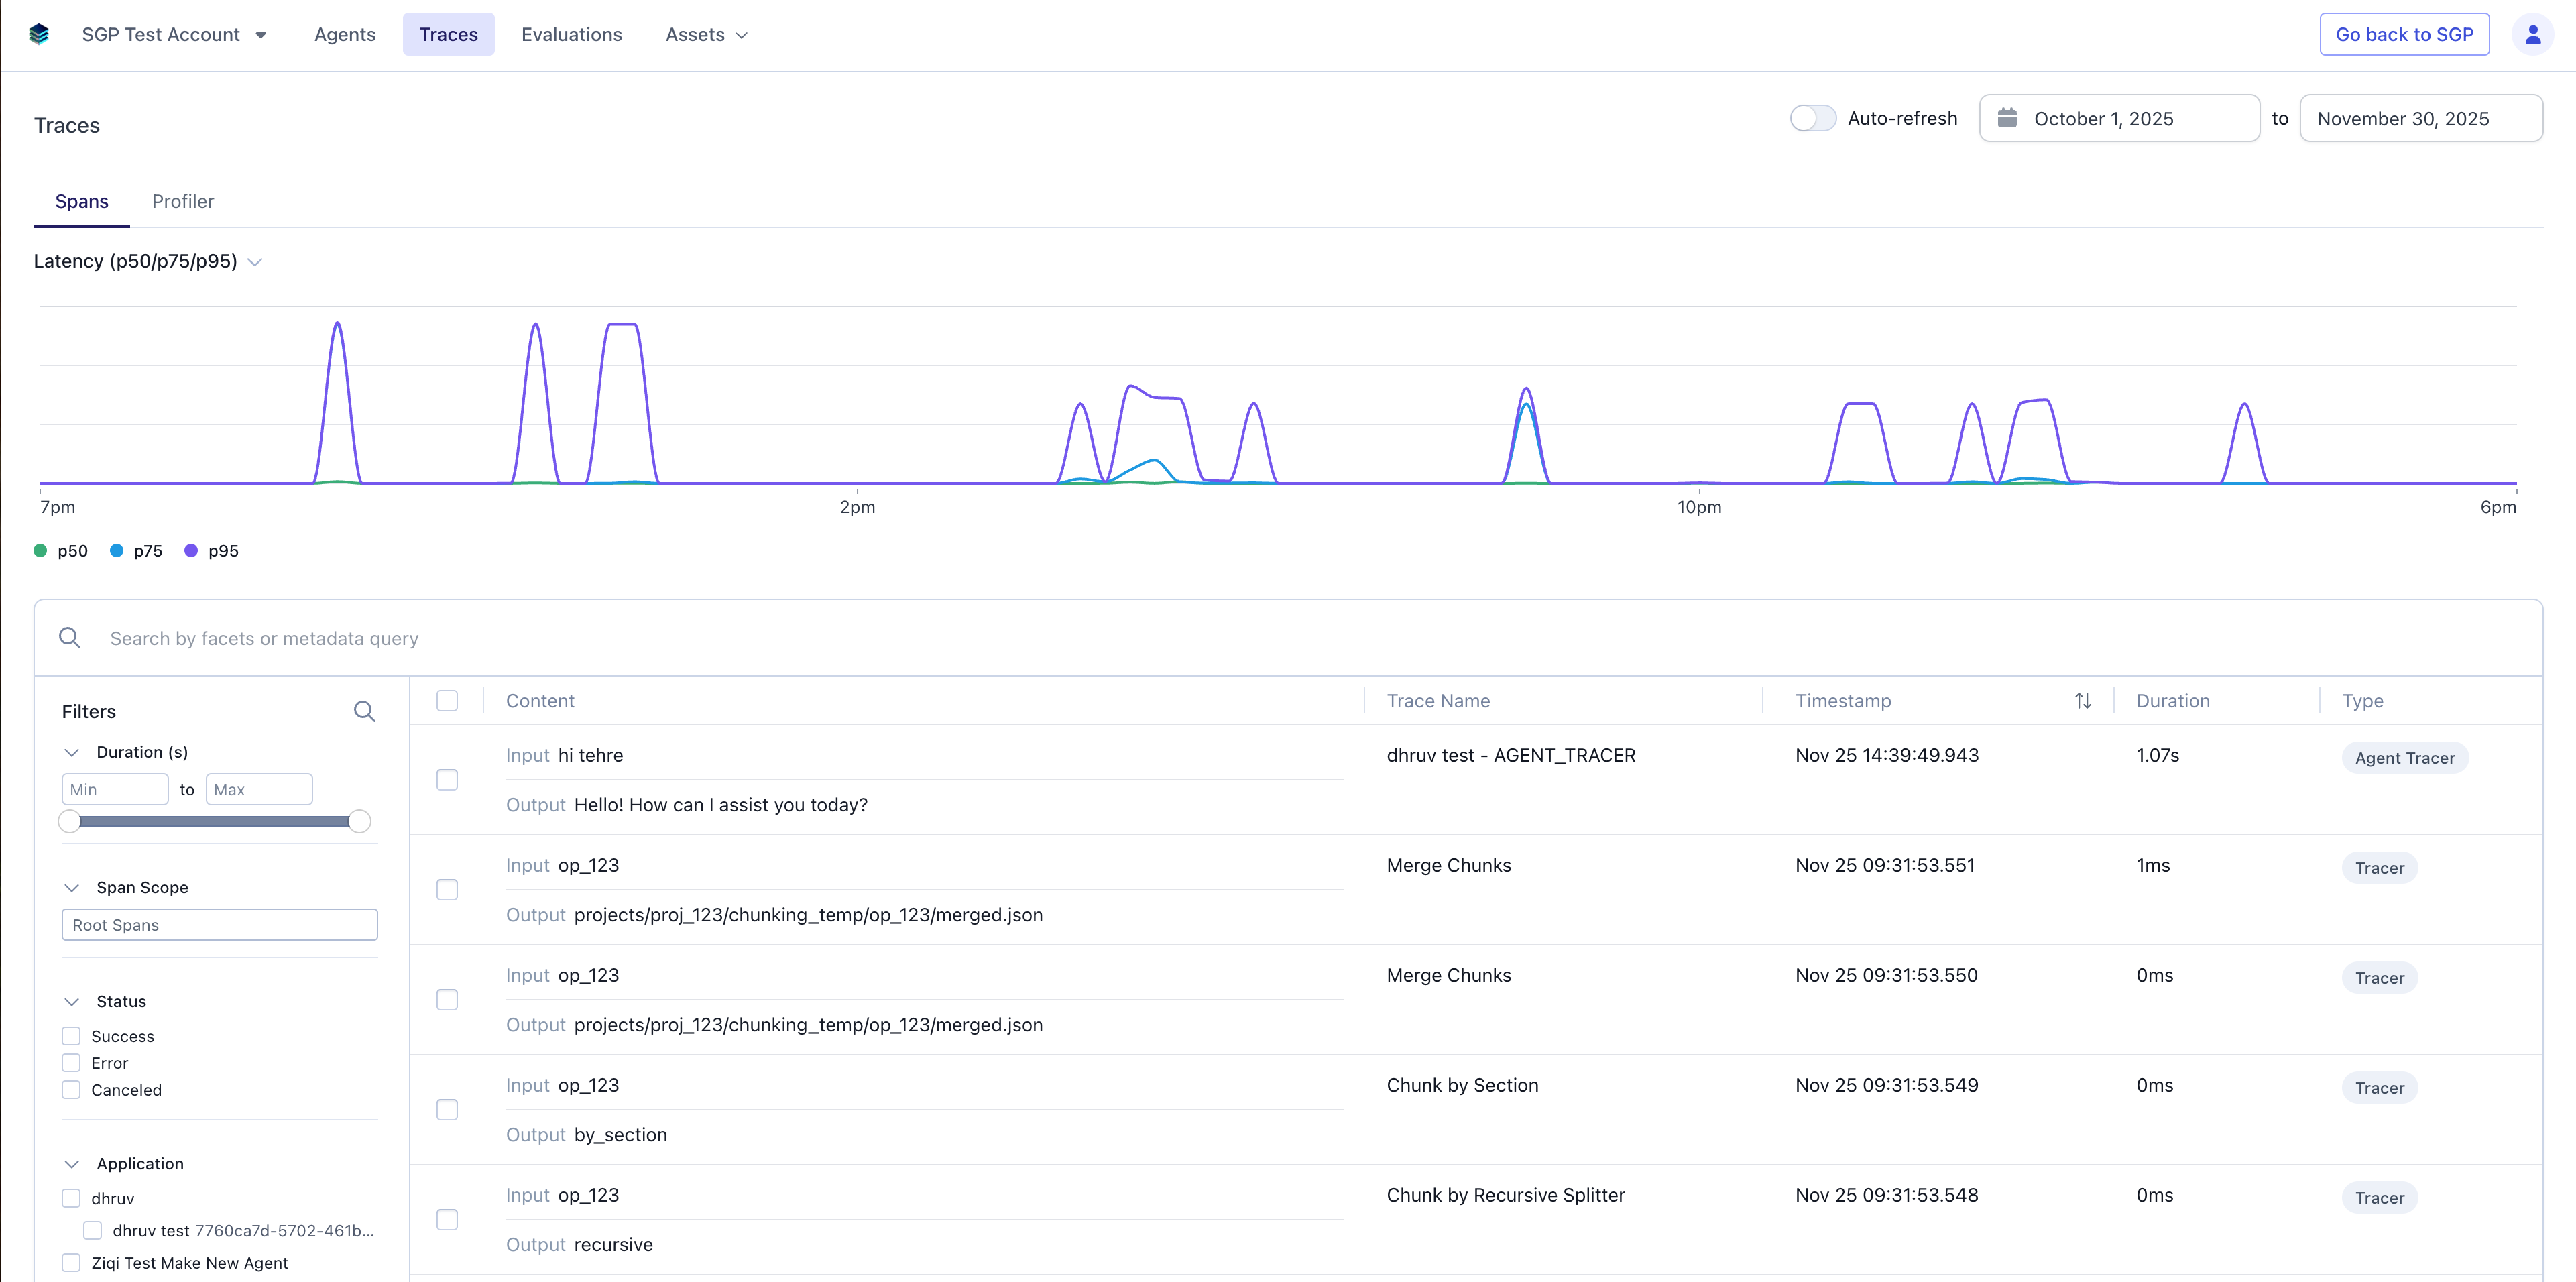
Errors
The Errors view tracks the rate of failed traces over time, allowing you to quickly spot error patterns or incidents. Use this view to correlate error spikes with deployments.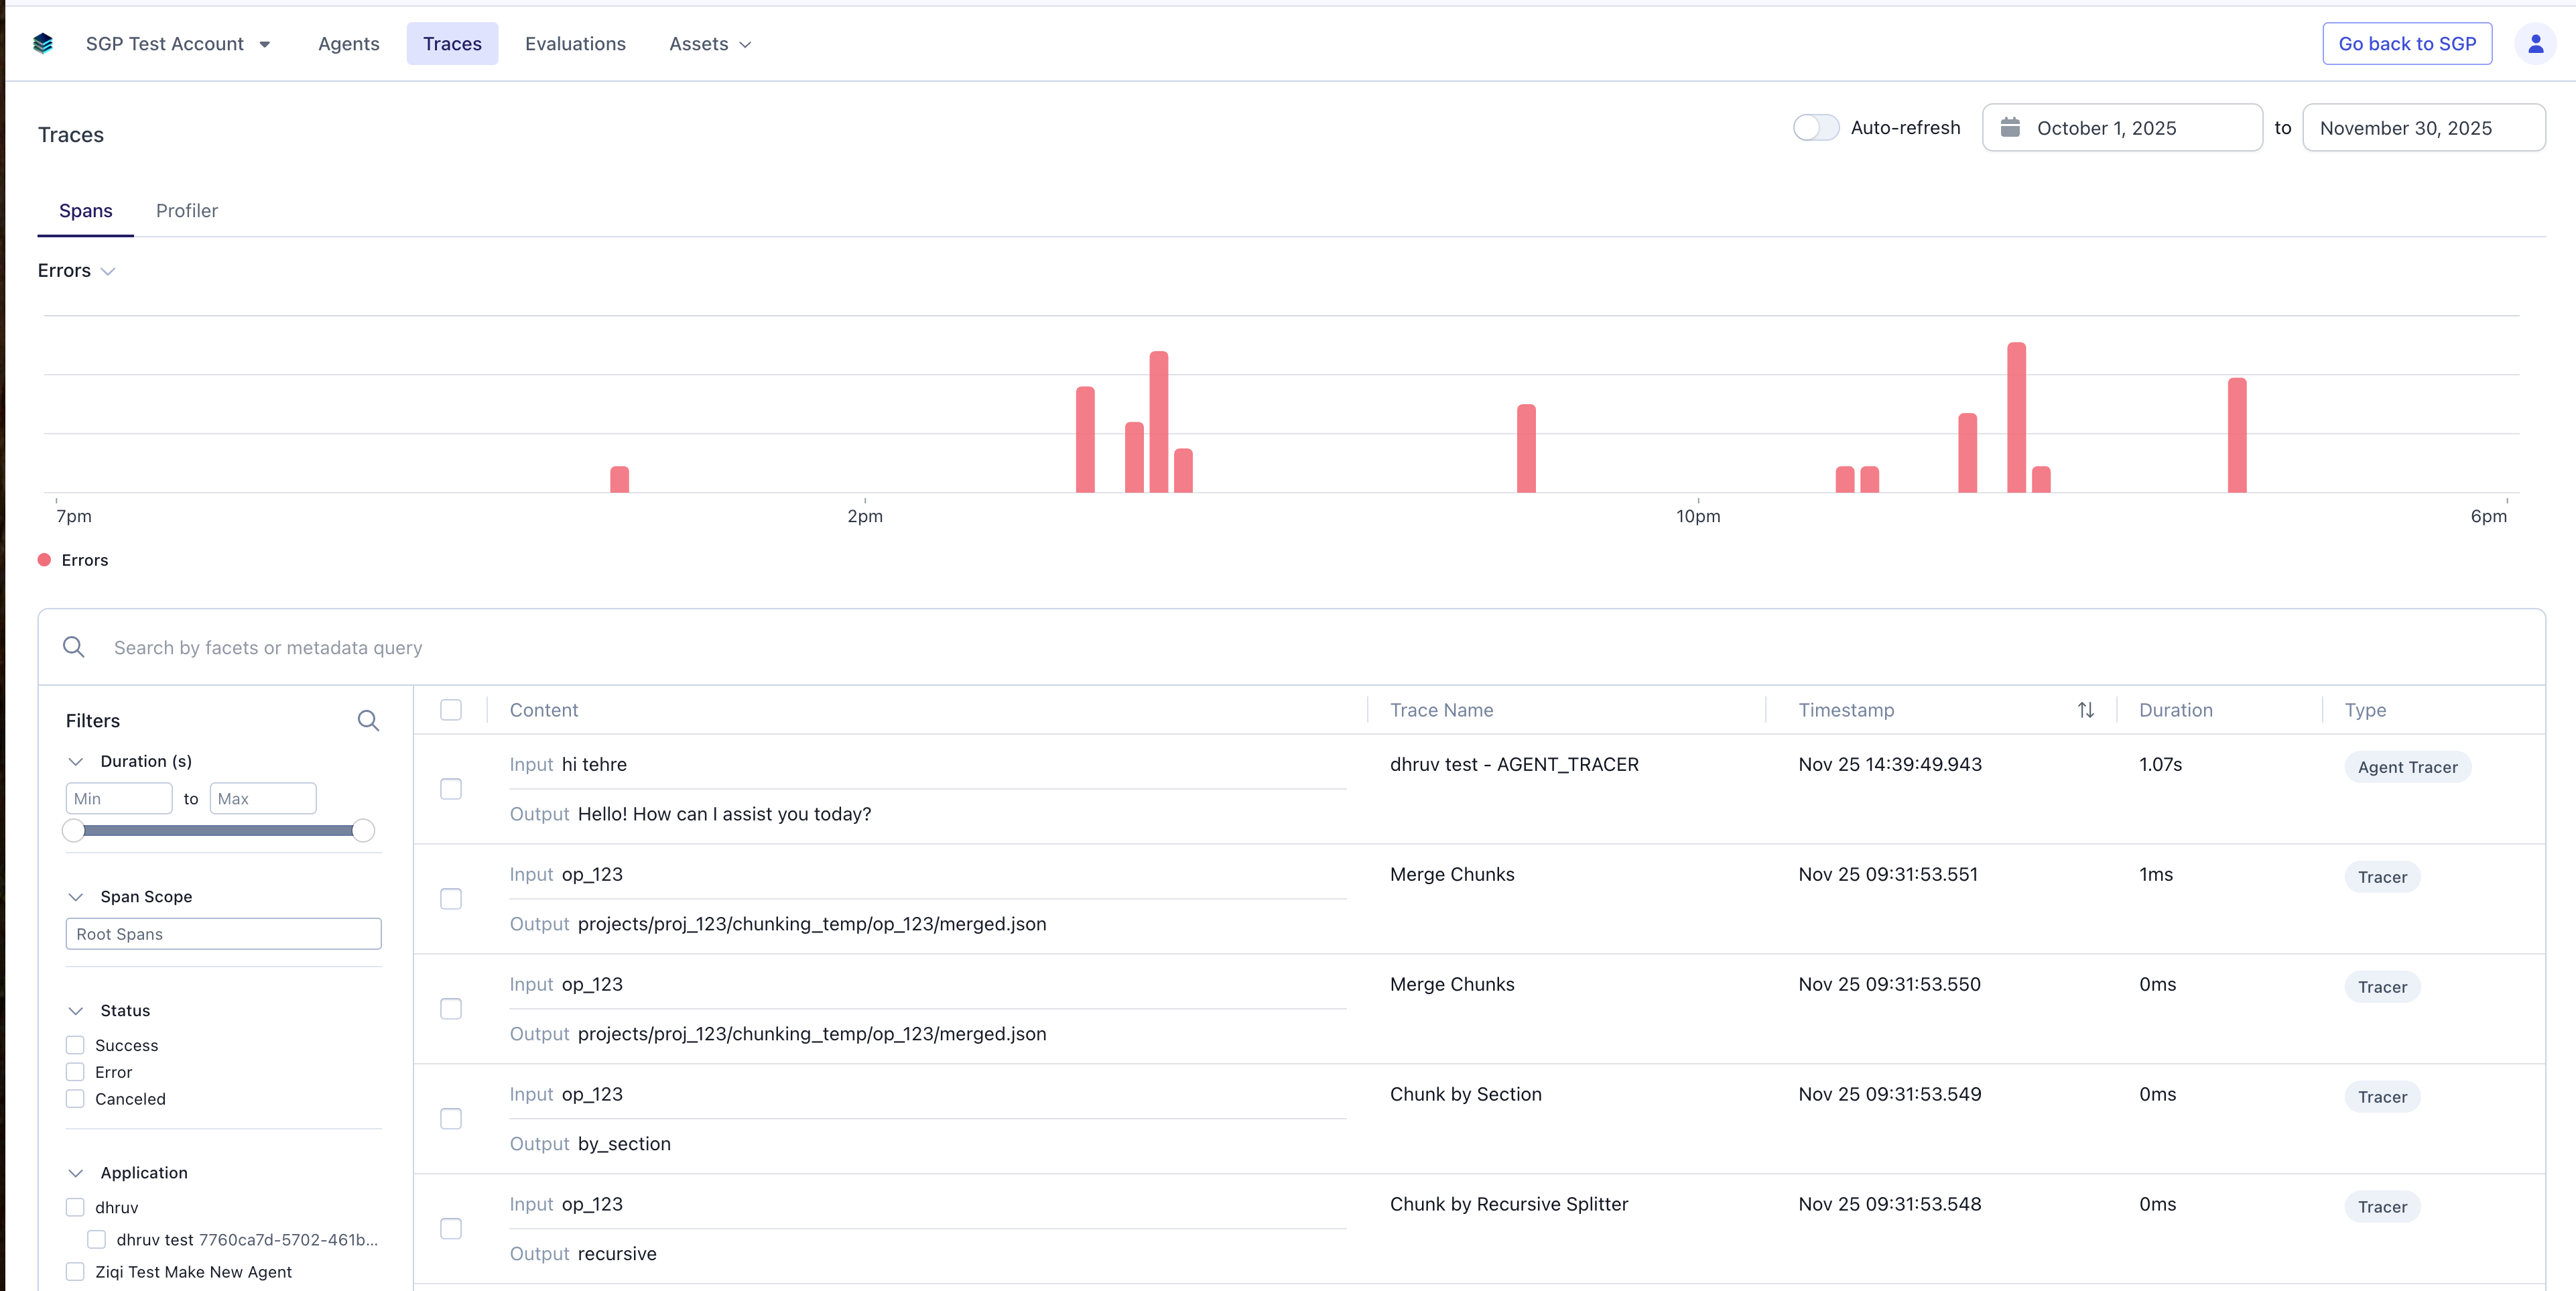
Traces Table
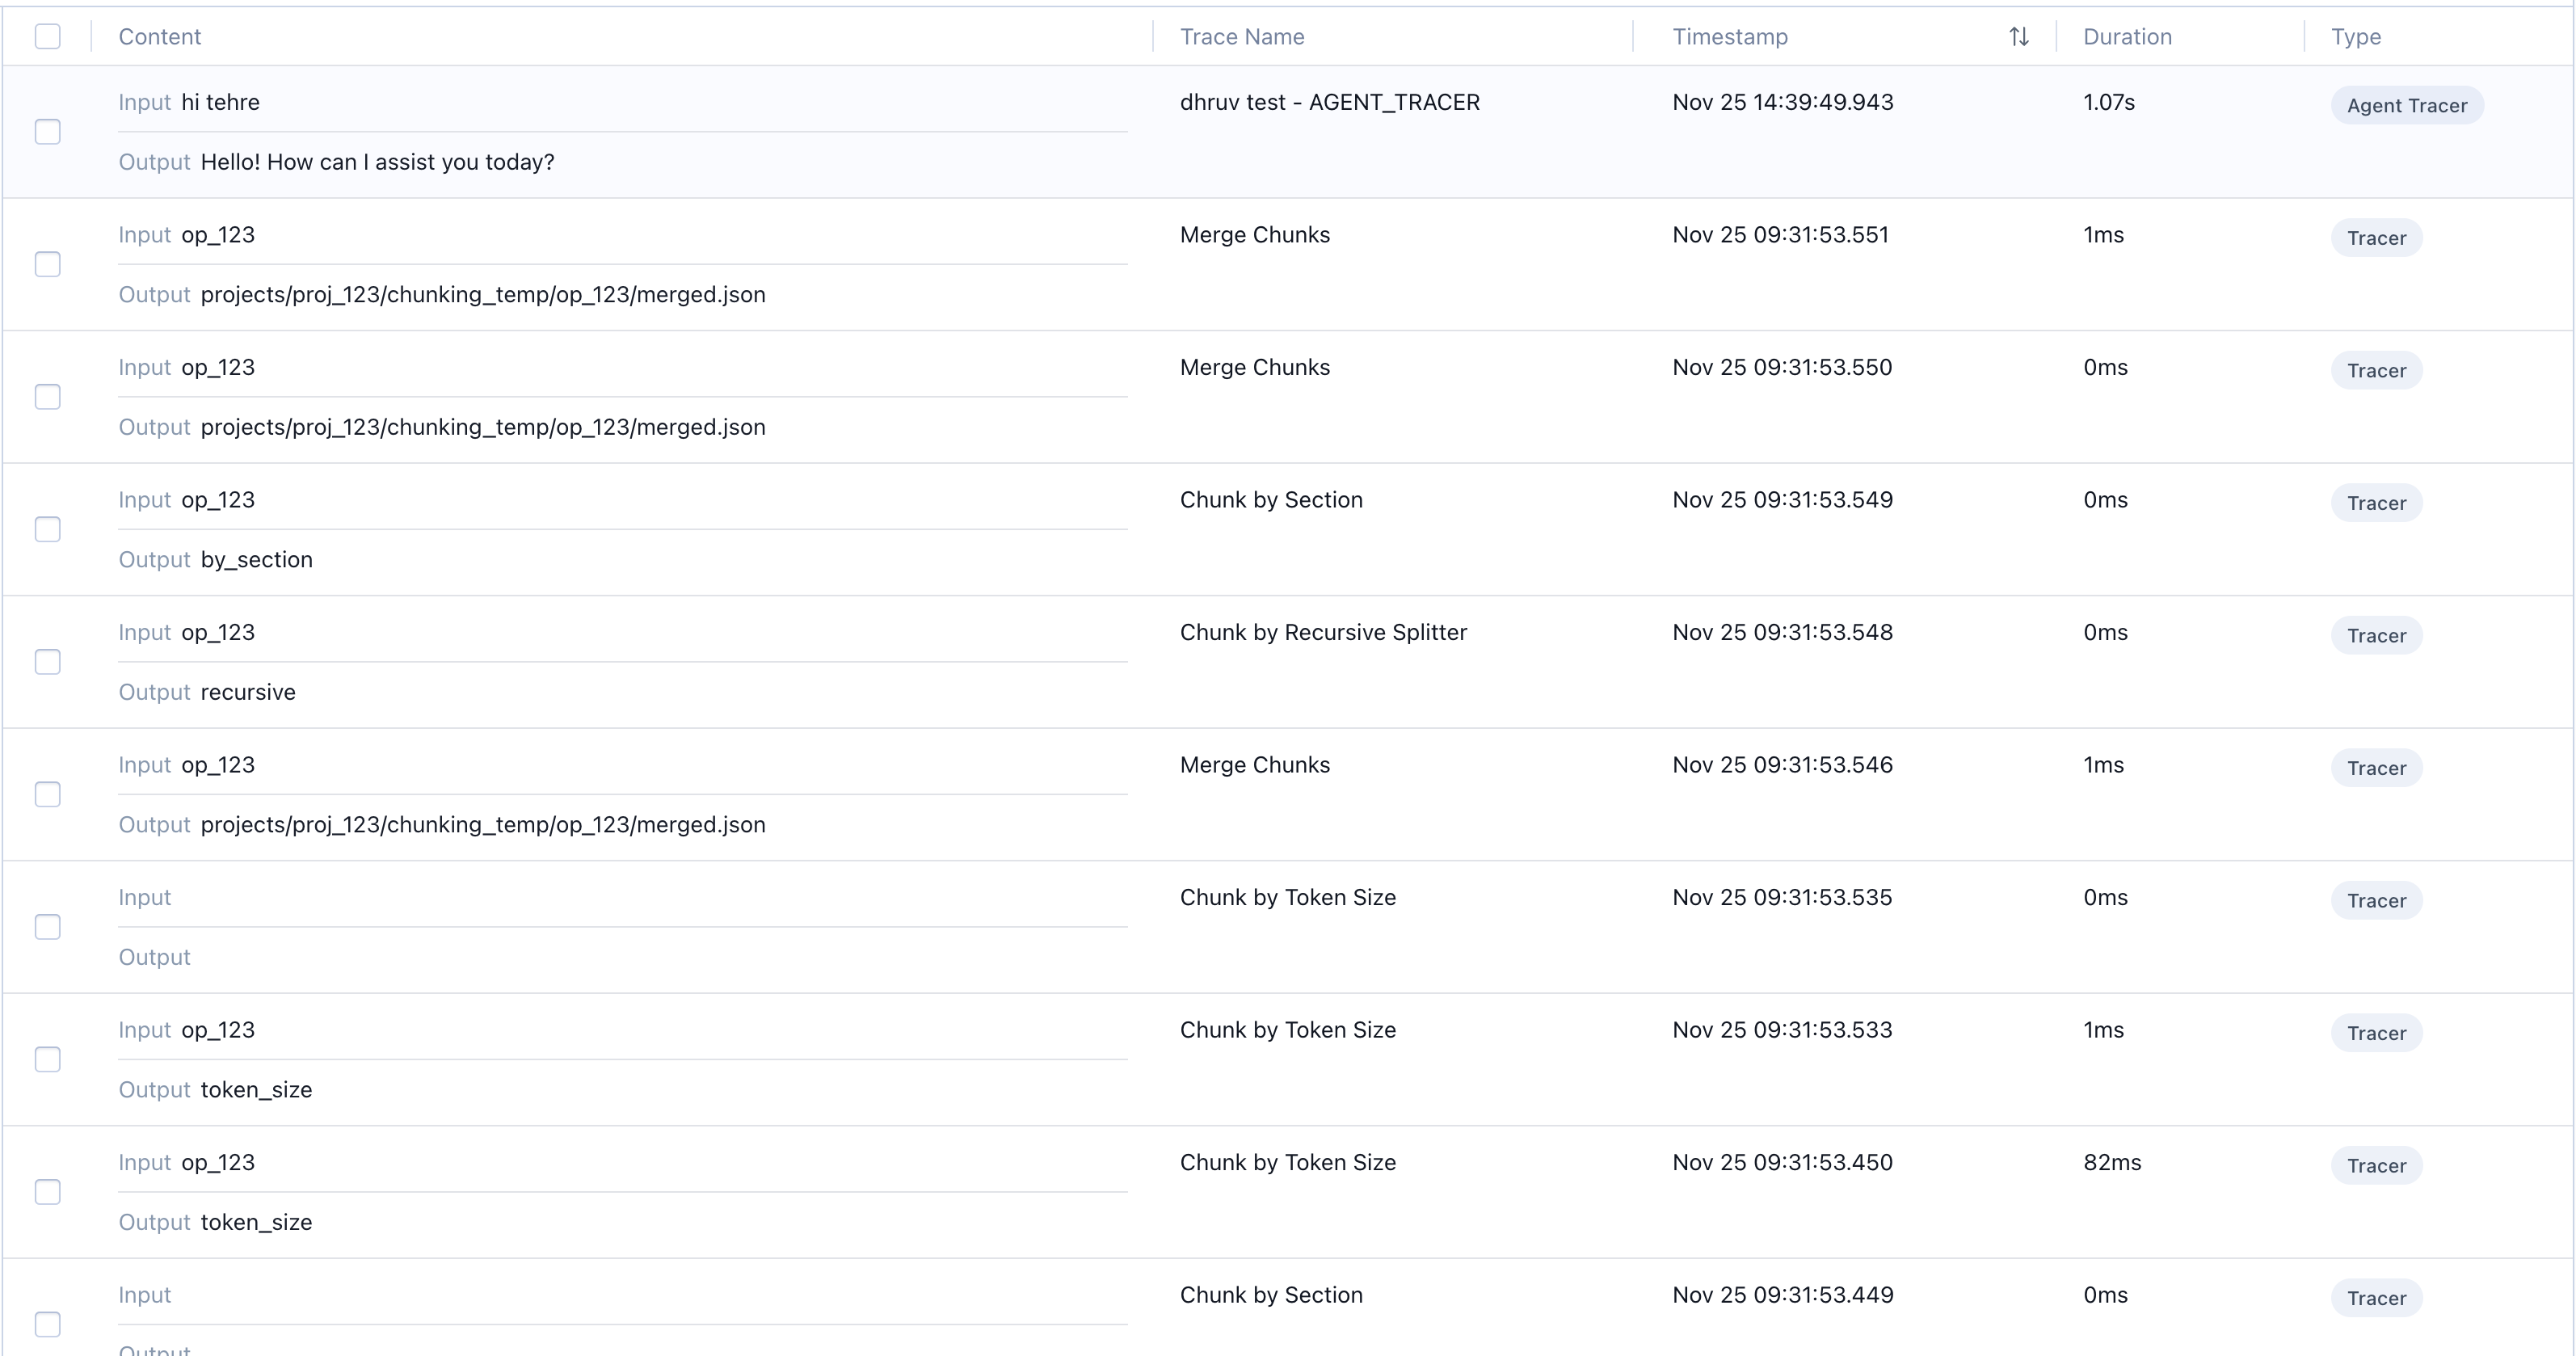
The main view displays a table of all traces collected from your applications. Each row represents a single trace (workflow), showing key information at a glance:- Content: A preview of the trace’s input and output data, giving you a quick glimpse of what the workflow processed.
- Trace Name: The descriptive name identifying the trace.
- Timestamp: When the trace began execution.
- Duration: The total time taken for the entire workflow to complete.
- Type: The span type for categorization.
Controlling the Content Preview
The Content column extracts a text preview from the root span’sinput and output fields. The preview system checks specific preferred keys in priority order before falling back to the first available value.
Input preview priority:
output_text, output-text, user_message, query, serp_query, content, message, prompt, title, value, result, text, raw_output
Output preview priority:
summary_text, content_text, summary, content → then the same general key list above
If your input or output doesn’t use one of these keys, the preview may display an unhelpful value (e.g., showing a numeric field like age instead of a meaningful identifier).
To control what appears in the preview, add a key from the list above to your span’s input and/or output with the value you want displayed:
Working with Selected Traces
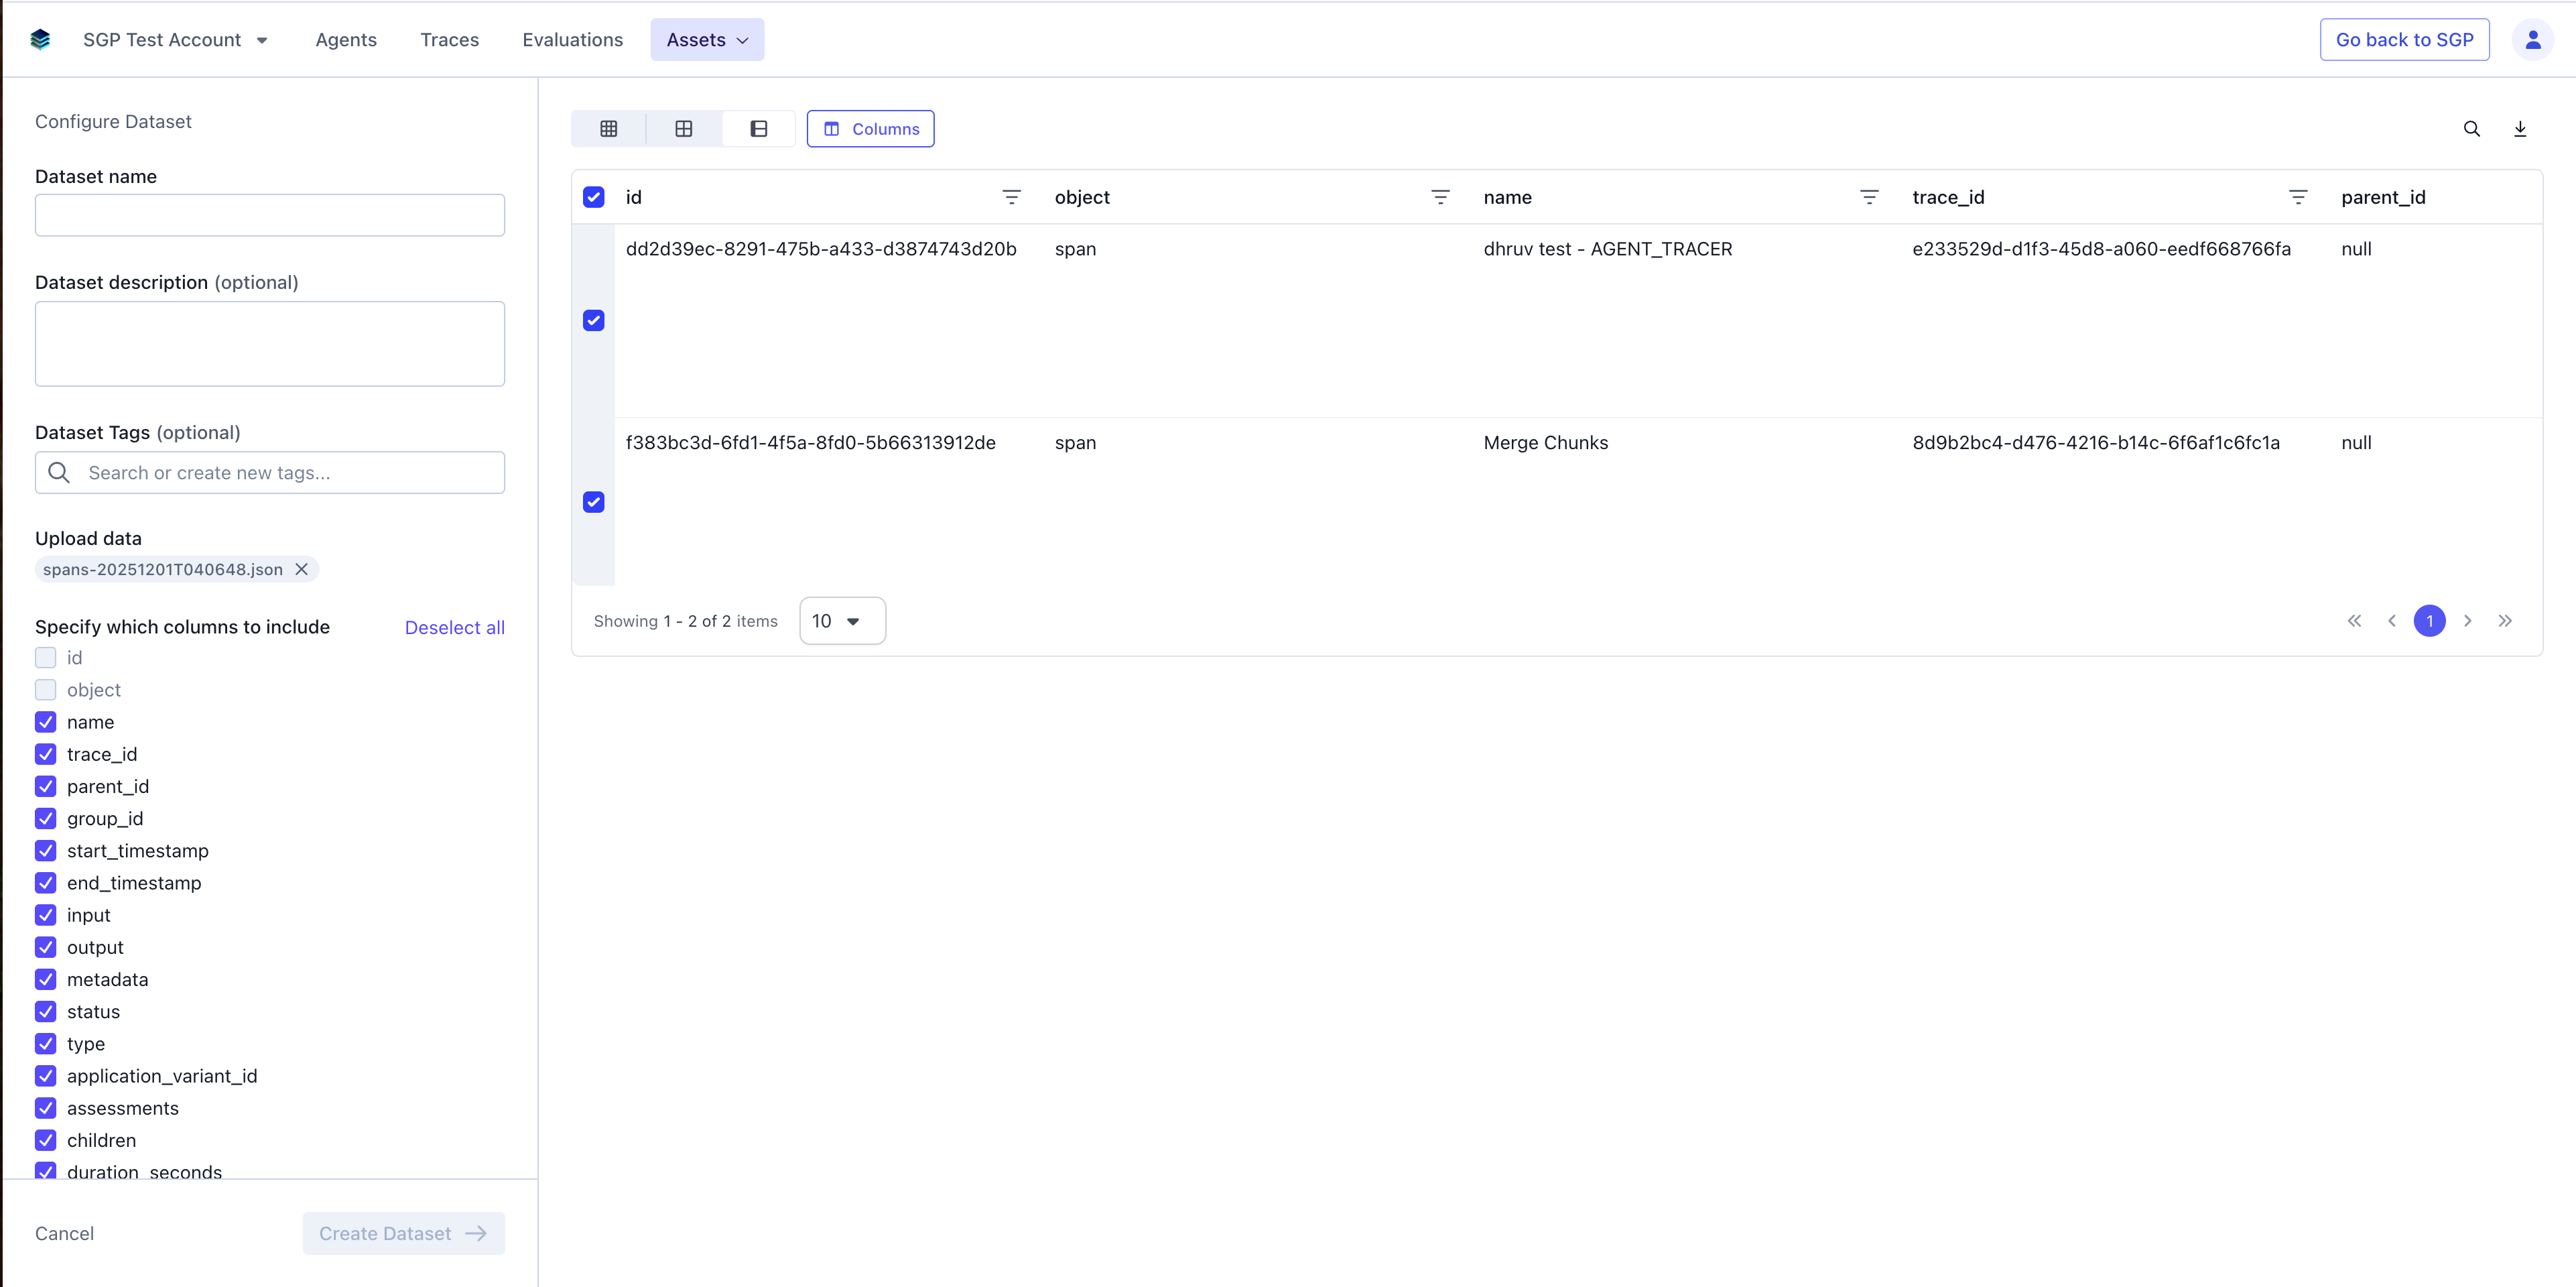
You can select traces from the table using the checkboxes on the left of each trace row. Once you’ve selected traces, additional options become available:- Add to Dataset: Create a new dataset from the selected traces for evaluations.
- Download: Export the selected traces for offline analysis or sharing.
Searching Traces
The search bar above the Traces table lets you find traces by content. The query runs across each span’sinput and output fields. If the query is an exact match for a trace_id, the corresponding trace is returned directly — useful for jumping to a specific trace from a log line, error report, or shared link.
Filtering Traces
Use the filter controls on the left side of the page to narrow down the traces displayed in the table. You can use the search box at the top of the filters panel to quickly find specific filter options by typing keywords. Available filters include:Duration
Filter traces by their execution time using either a min-to-max range input or an interactive slider. This helps you quickly identify slow workflows or find traces within a specific performance window.Span Scope
Filter traces based on the scope of spans you want to examine. You can choose between Root Spans (only the top-level spans of each trace) or All Spans (every span within the traces).Status
Filter by completion status to quickly identify successful traces or those that encountered errors during execution.Application
Filter traces by the application that generated them, useful when monitoring multiple applications or services.Span Name
Filter by specific span names to find traces containing particular operations or function calls.Span Type
Filter by span type to view traces of a particular category, such as LLM calls, database queries, or API requests.Agent Name
Filter traces generated by specific agents, helping you monitor individual agent performance and behavior.Agent ID
Filter by unique agent identifiers for precise agent-level filtering.ACP Type
Filter traces by ACP (Agent Control Protocol) type for agent-specific workflows.Assessment
Filter traces based on assessment criteria or evaluation results.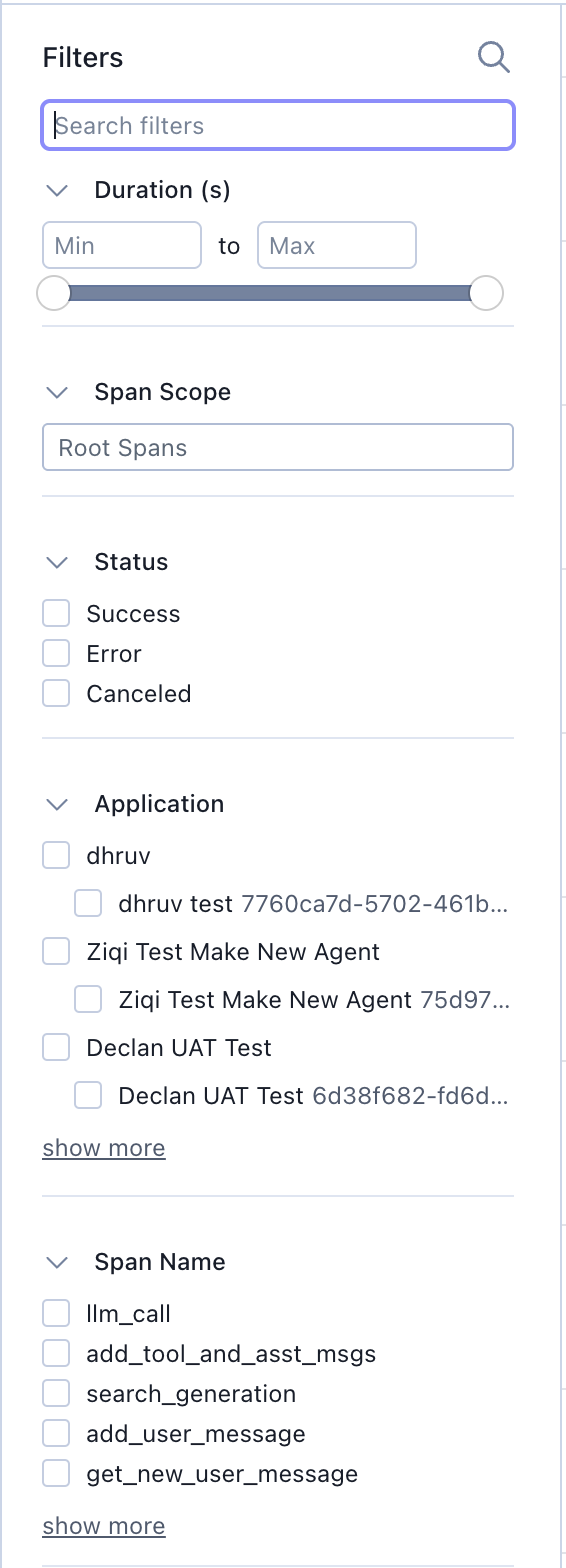
Common Use Cases
Debugging Errors
When a workflow fails, use the Traces page to:- Filter by status to show only error traces.
- Open the trace detail view to see exactly which span failed.
- Inspect the error span’s input, output, and metadata to understand the root cause.
- Review parent spans to see what led to the failure.
Performance Optimization
To identify performance bottlenecks:- Sort traces by duration to find slow workflows.
- Open the trace graph to visualize the execution timeline.
- Identify spans with long durations that could be optimized.
- Look for sequential operations that could be parallelized.
Monitoring Workflows
For ongoing monitoring of your applications:- Use the time range filter to view recent traces.
- Monitor the success/error ratio in the table.
- Set up custom metadata filters to track specific features or user segments.
- Review trace patterns to ensure expected execution flows.