Trace Detail View
Clicking on a trace opens the detail view, which provides a comprehensive breakdown of the entire workflow.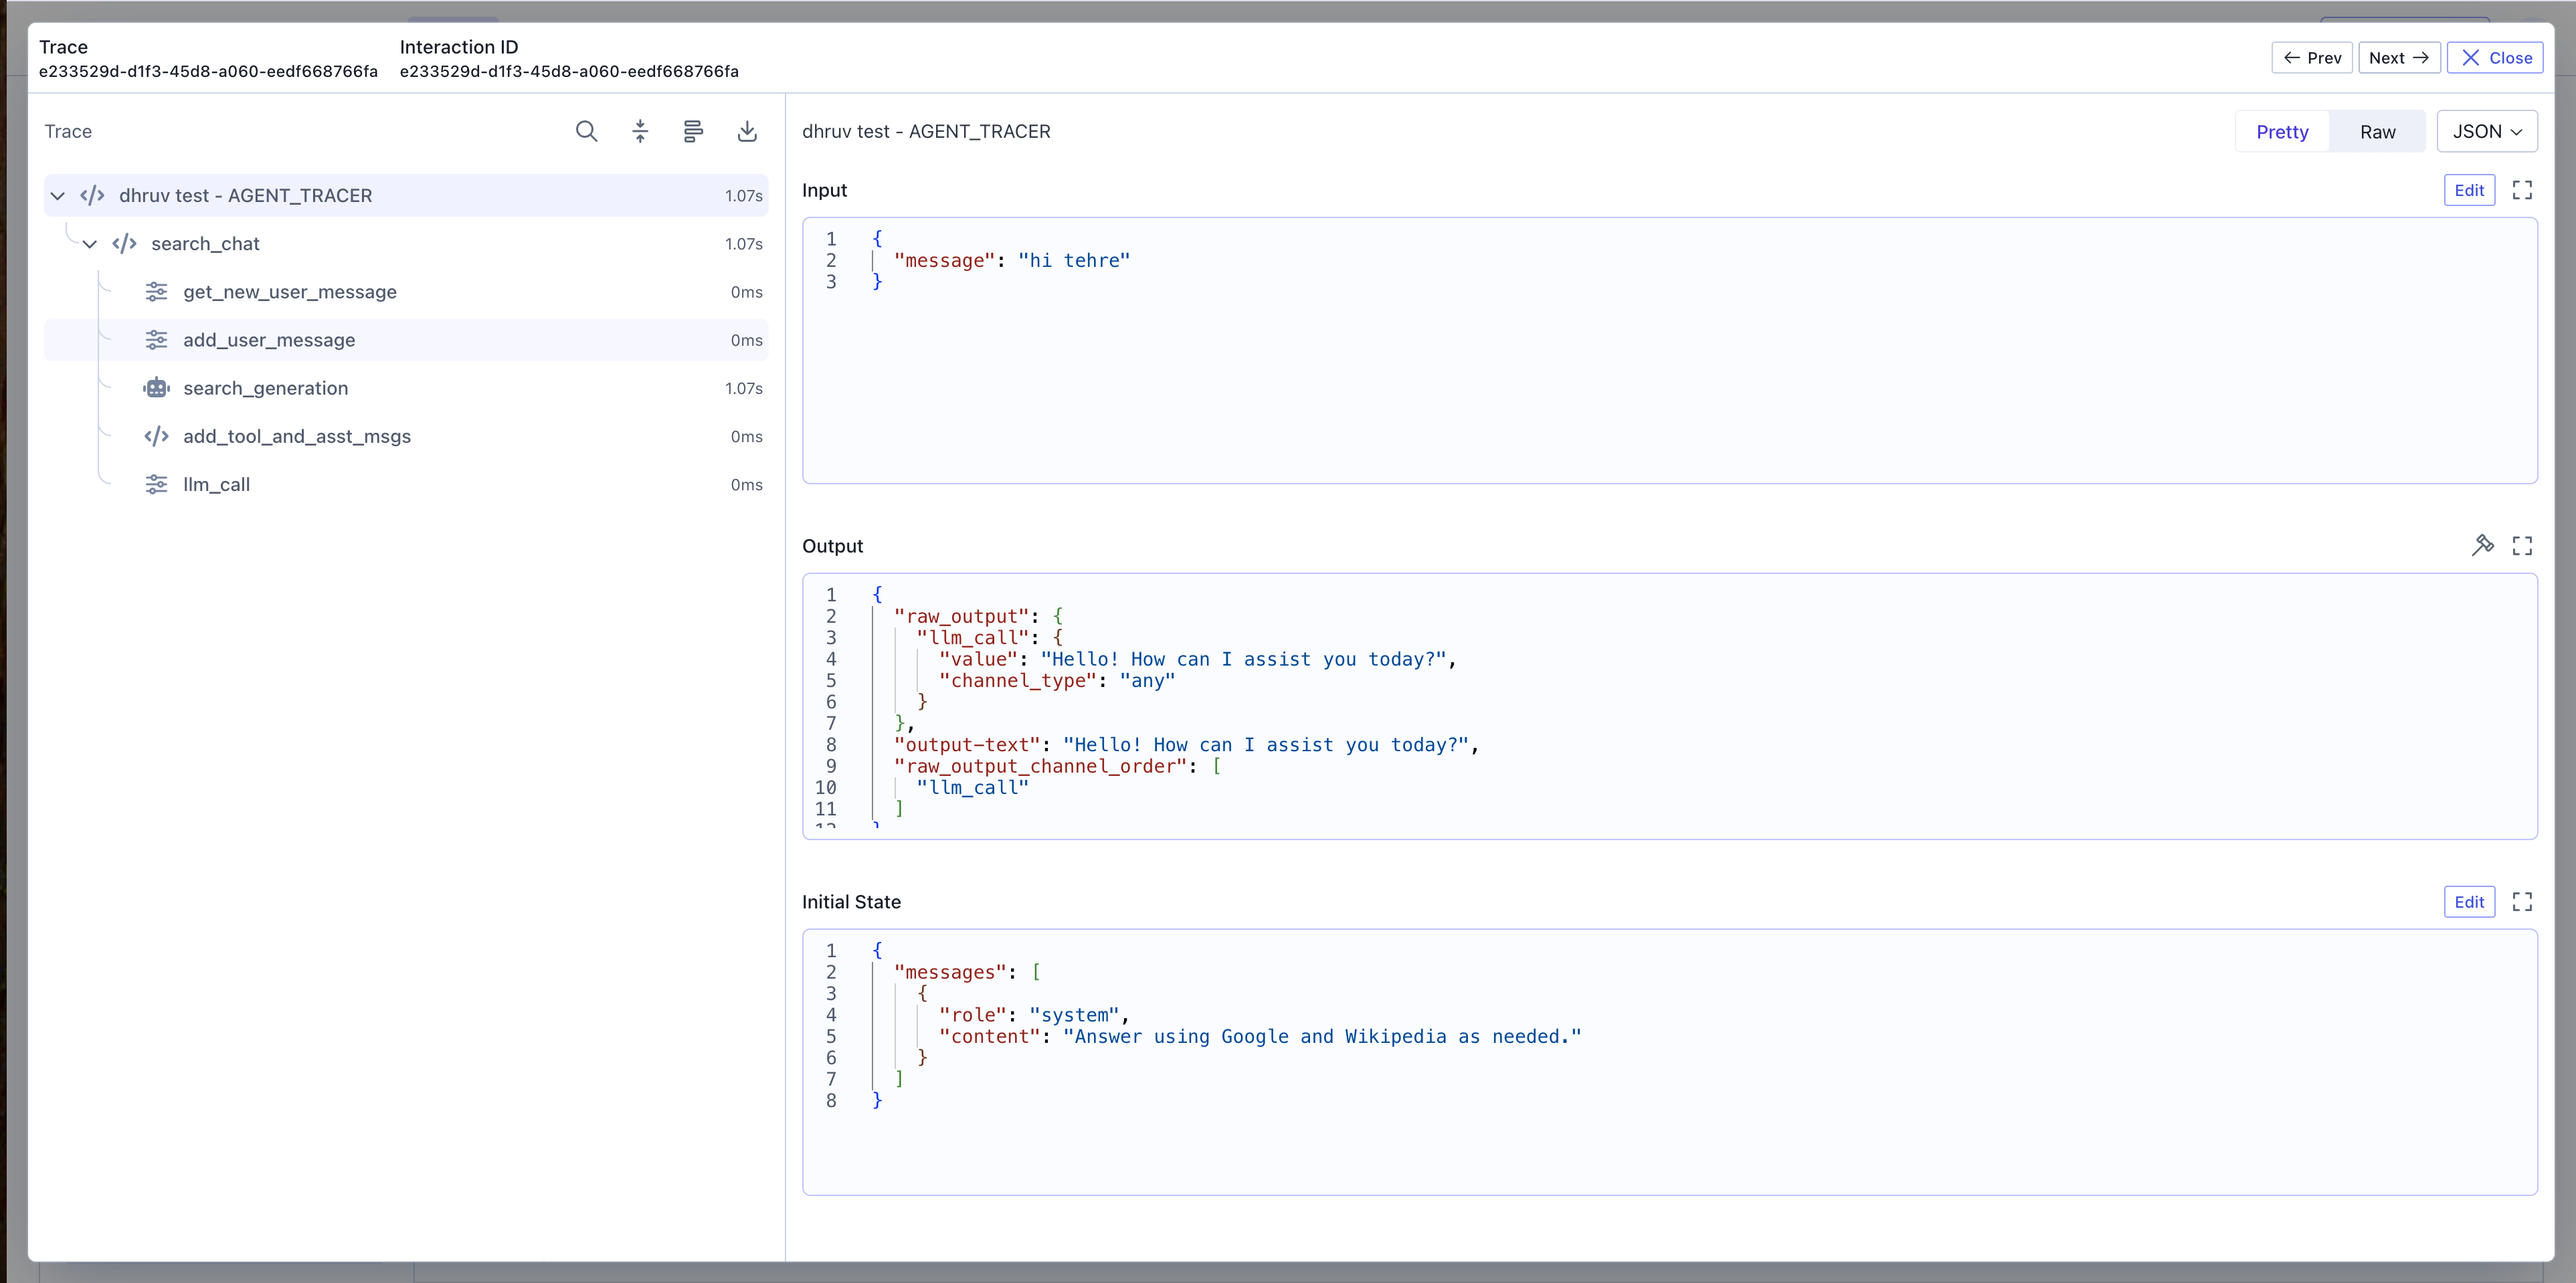
Navigation Controls
At the top of the trace detail view, you’ll find several navigation and viewing options:- Previous/Next Trace: Navigate between traces in your current filtered results without returning to the main table.
- Download Trace: Export the complete trace data for offline analysis or sharing.
- Gantt Chart View: Toggle to a Gantt chart visualization to see span timing and dependencies.
- Search: Search within the trace for specific spans or content.
Data Display Options
The detail view provides flexible viewing options for trace and span data:- Pretty/Raw Toggle: Switch between formatted (Pretty) and raw (Raw) views of the data for easier reading or debugging.
- Format Selection: Toggle between JSON and YAML formats to view the data in your preferred structure.
- Edit Mode: Click the Edit button to modify span data for thread forking (available when viewing span details). See the Thread Forking section for more details.
- Expand View: Open a full-screen view of the data for detailed inspection.
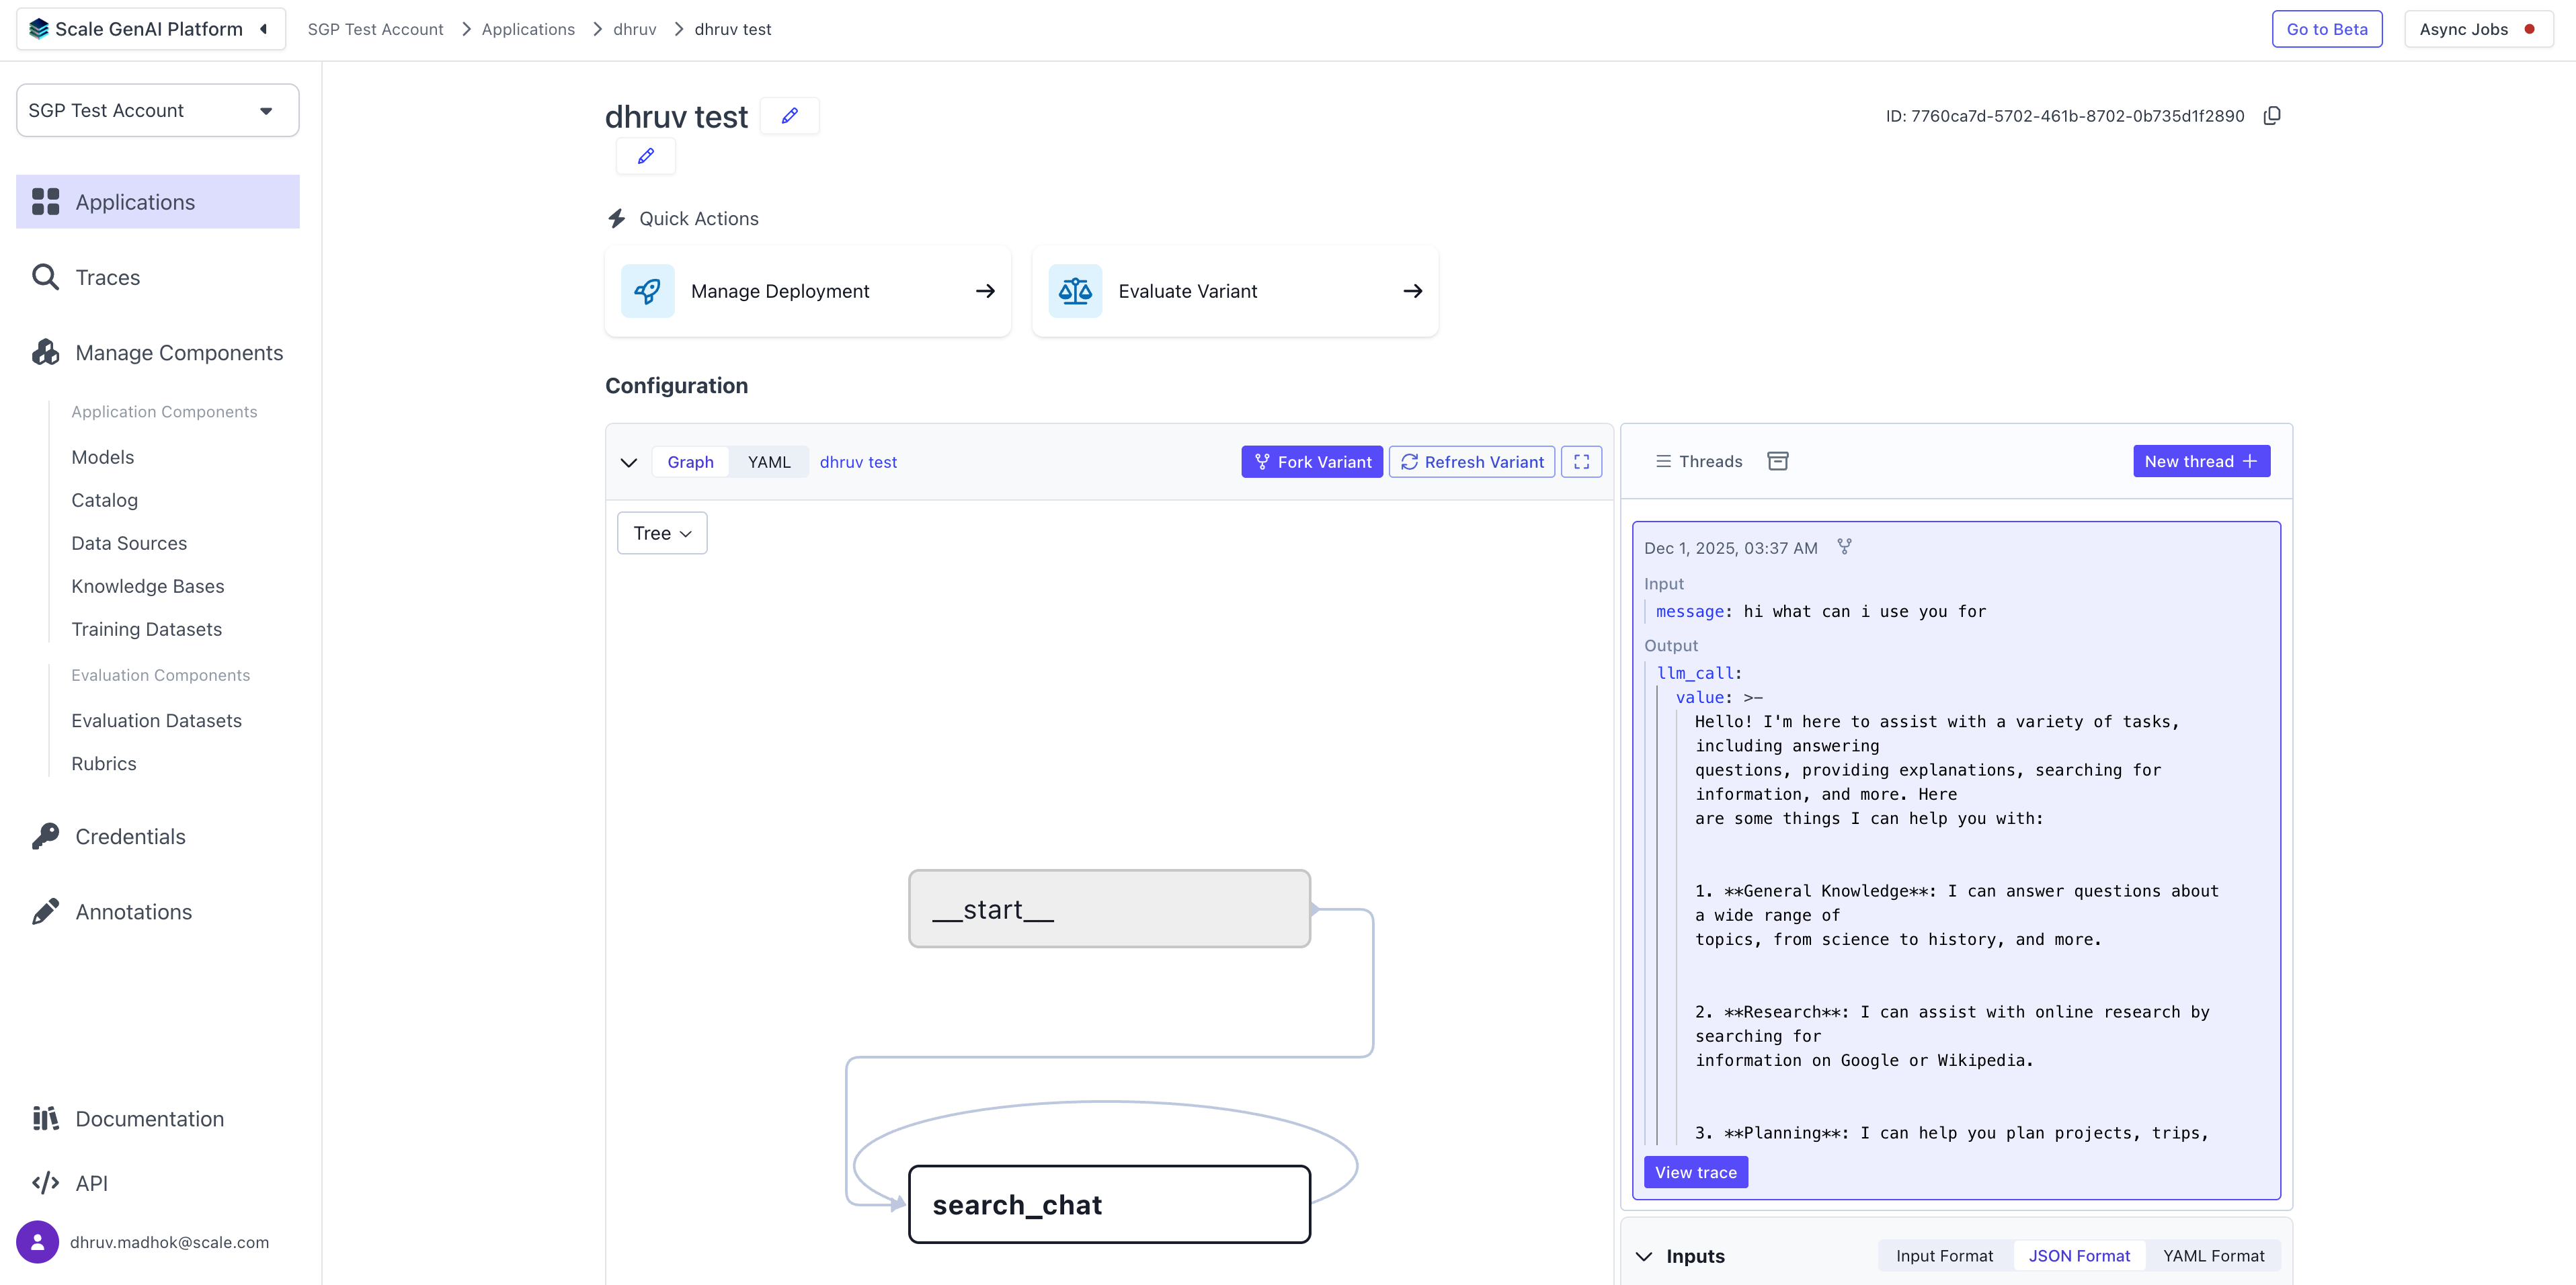
Trace Visualization Graph
The trace graph displays a hierarchical visualization of all spans within the trace:- Hierarchical Layout: Spans are arranged in a tree structure on the left showing parent-child relationships, with each span displaying its name and duration.
- Timeline View: Each span is positioned horizontally based on its start time and duration, making it easy to identify sequential vs. parallel operations.
- Interactive Navigation: Click on any span in the graph to view its detailed information in the side panel.
Span Details Panel
When you select a span from the graph, the details panel on the right reveals comprehensive information:- Input: The data that was passed into the operation, helping you understand what the span received.
- Output: The data produced by the operation, showing the result of the span’s execution.
- Initial State: The starting state or context for the span, particularly useful for agent workflows.
- Metadata: Custom key-value pairs attached to the span for additional context.
- Span Attributes: All span properties including trace ID, parent ID, and span type.
- Assessments: Click the Assessments button to add evaluations or annotations to the span. You can create assessments to track quality, correctness, or other criteria for specific spans in your traces.
Performance Analysis
The trace detail view helps identify performance issues:- Duration Comparison: Quickly spot spans that take disproportionately long compared to siblings.
- Critical Path: Identify the sequence of spans that determines the overall trace duration.
- Parallel Execution: Visualize which operations run concurrently vs. sequentially.
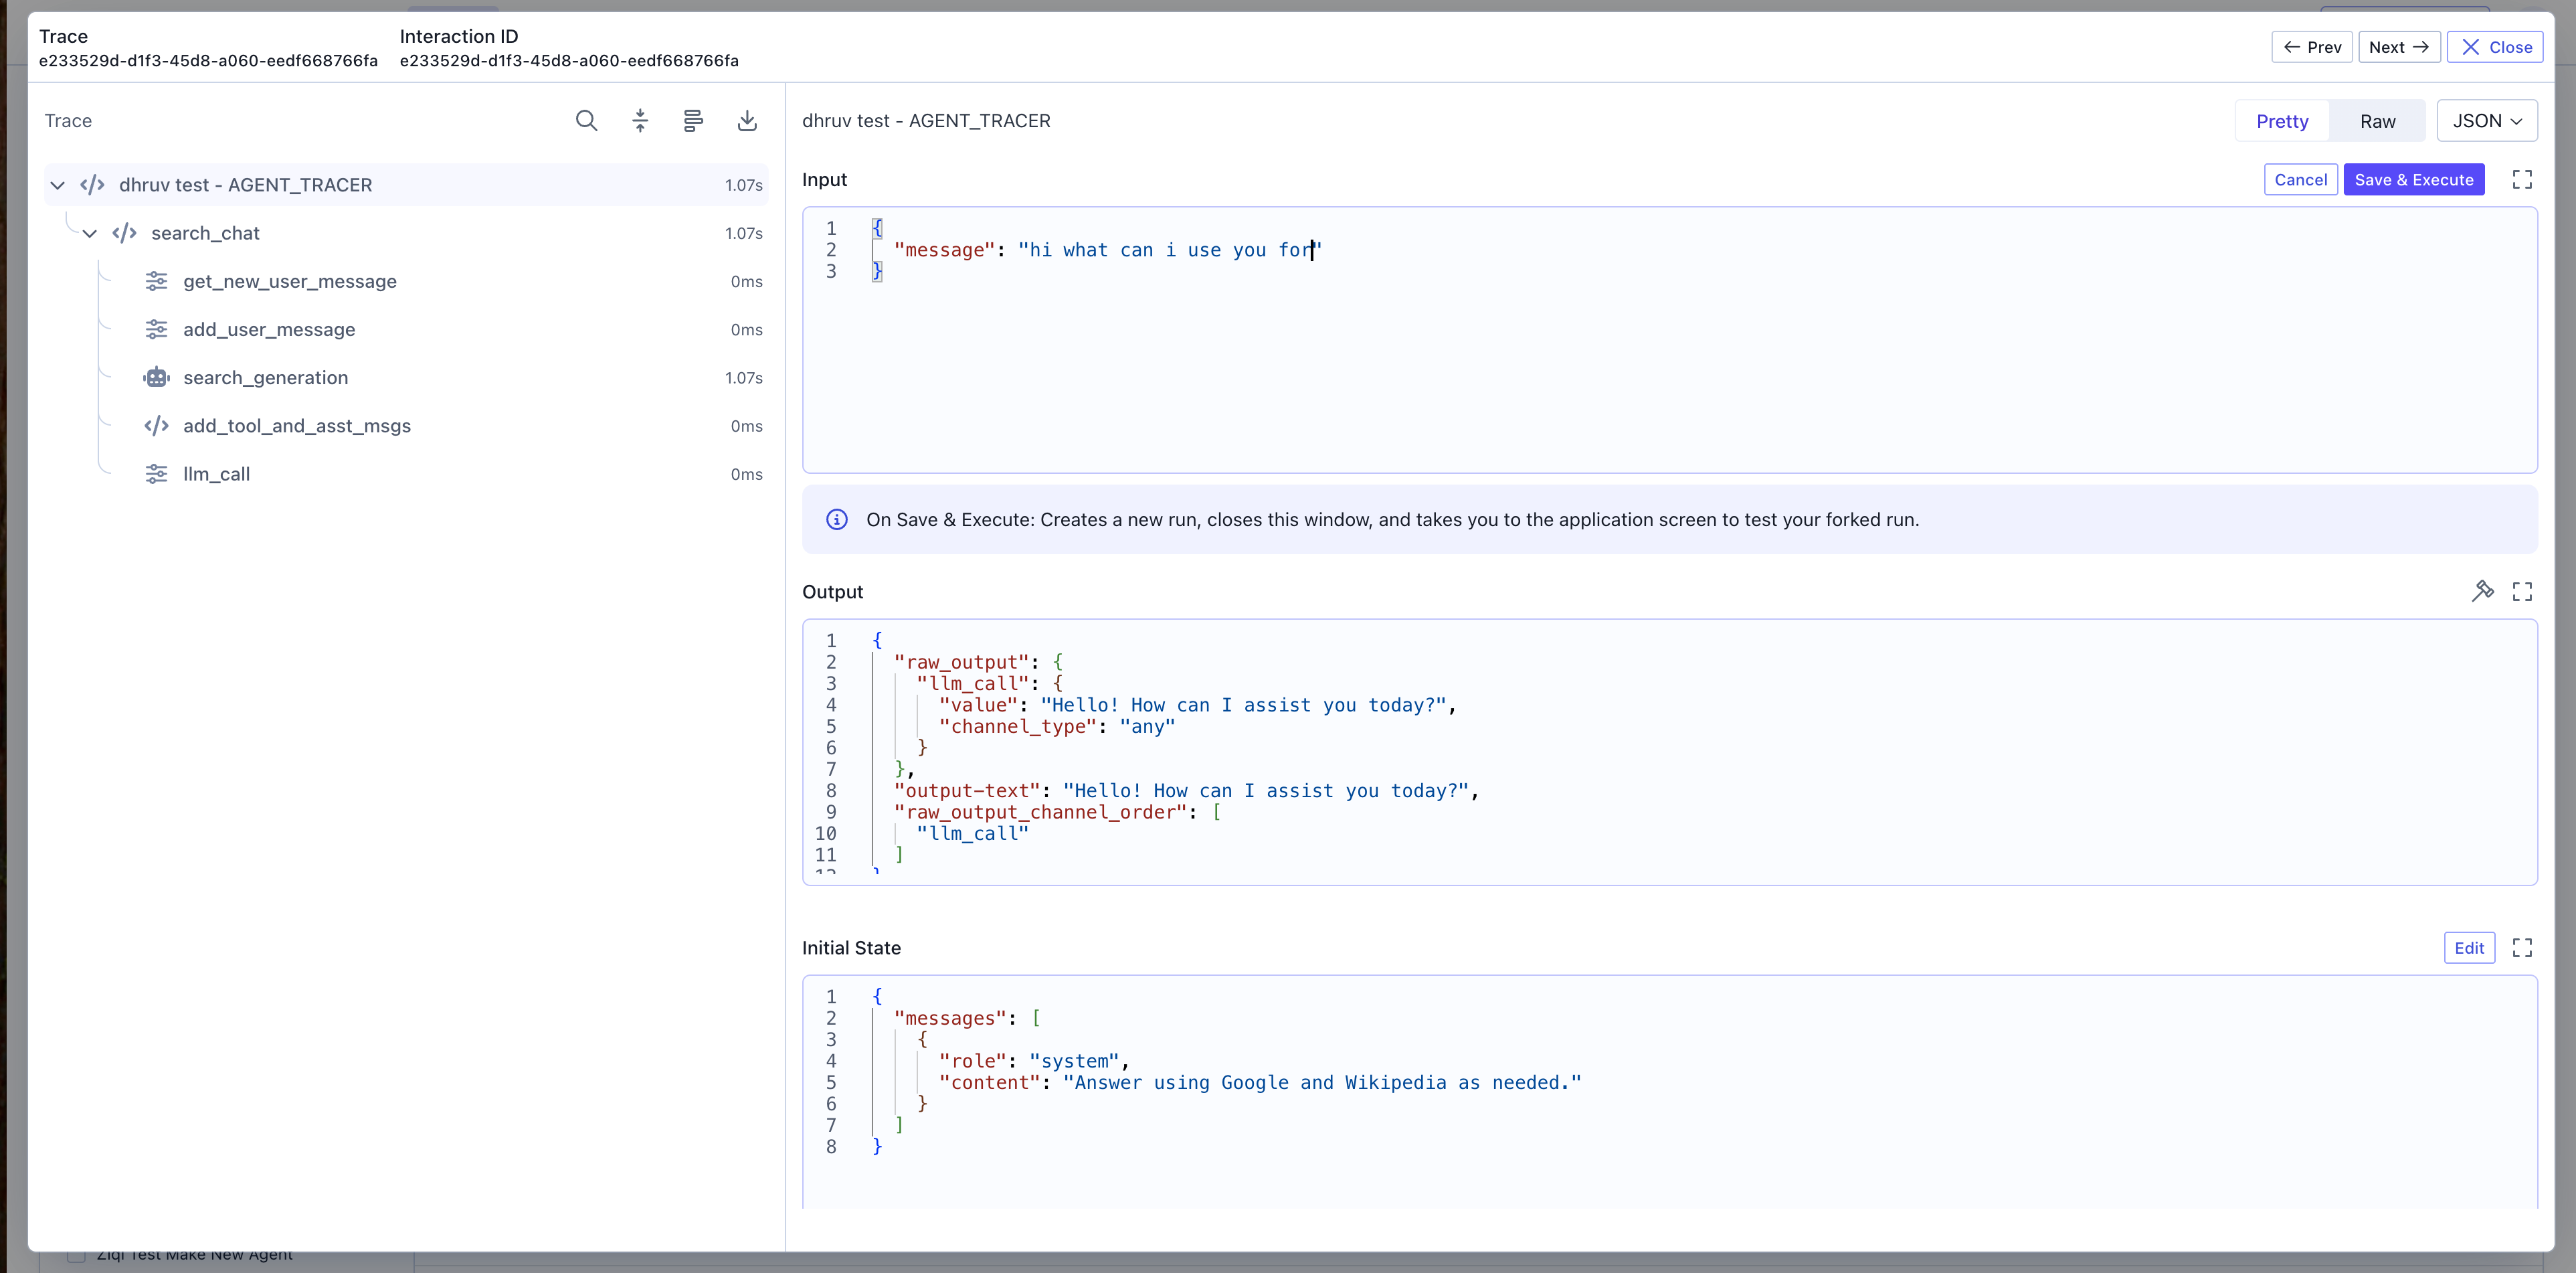
Thread Forking
Available for traces generated by SGP native applications.
- Resume execution from a specific point in the trace.
- Test different execution paths without rerunning the entire workflow.
- Debug complex decision-making logic in AI agents.
- Select a span in the trace graph where you want to resume execution.
- In the span details panel, click the Edit button to modify the input, output, or initial state.
- Make your desired changes to test different scenarios.
- Click Save and Execute to create a new execution thread from that point forward.
Common Use Cases
Debugging Individual Trace Failures
When investigating a specific failed trace:- Open the trace detail view from the Traces table.
- Use the trace visualization graph to identify which span failed.
- Inspect the failed span’s input, output, and metadata to understand what went wrong.
- Review parent spans to see what data was passed to the failed operation.
- Check sibling spans to see if related operations also encountered issues.
Understanding Execution Flow
To understand how a complex workflow executes:- Open the trace detail view for a representative trace.
- Use the hierarchical layout to see the parent-child relationships between spans.
- Examine the timeline view to identify sequential vs. parallel operations.
- Review input and output for each span to understand data flow through the system.
- Use the search function to quickly locate specific operations within the trace.
Analyzing Slow Traces
When investigating performance issues in a specific trace:- Open the slow trace from the Traces table (sorted by duration).
- Use the trace visualization to identify the critical path—the sequence of spans that determines total duration.
- Look for spans with unusually long durations compared to typical executions.
- Examine span metadata for context about why operations took longer than expected.
- Use the Gantt Chart view to see timing and dependencies more clearly.