Profiler
The Profiler provides an aggregated overview of where your agent spends its time, helping you pinpoint which spans are consistently causing delays across many executions. Instead of analyzing individual traces one by one, the Profiler shows performance metrics aggregated from all traces matching your filters, making it easy to identify systemic bottlenecks.Agent Selection
When you first open the Profiler tab, you’ll see a list of agents to analyze. Select an agent to view its performance profile.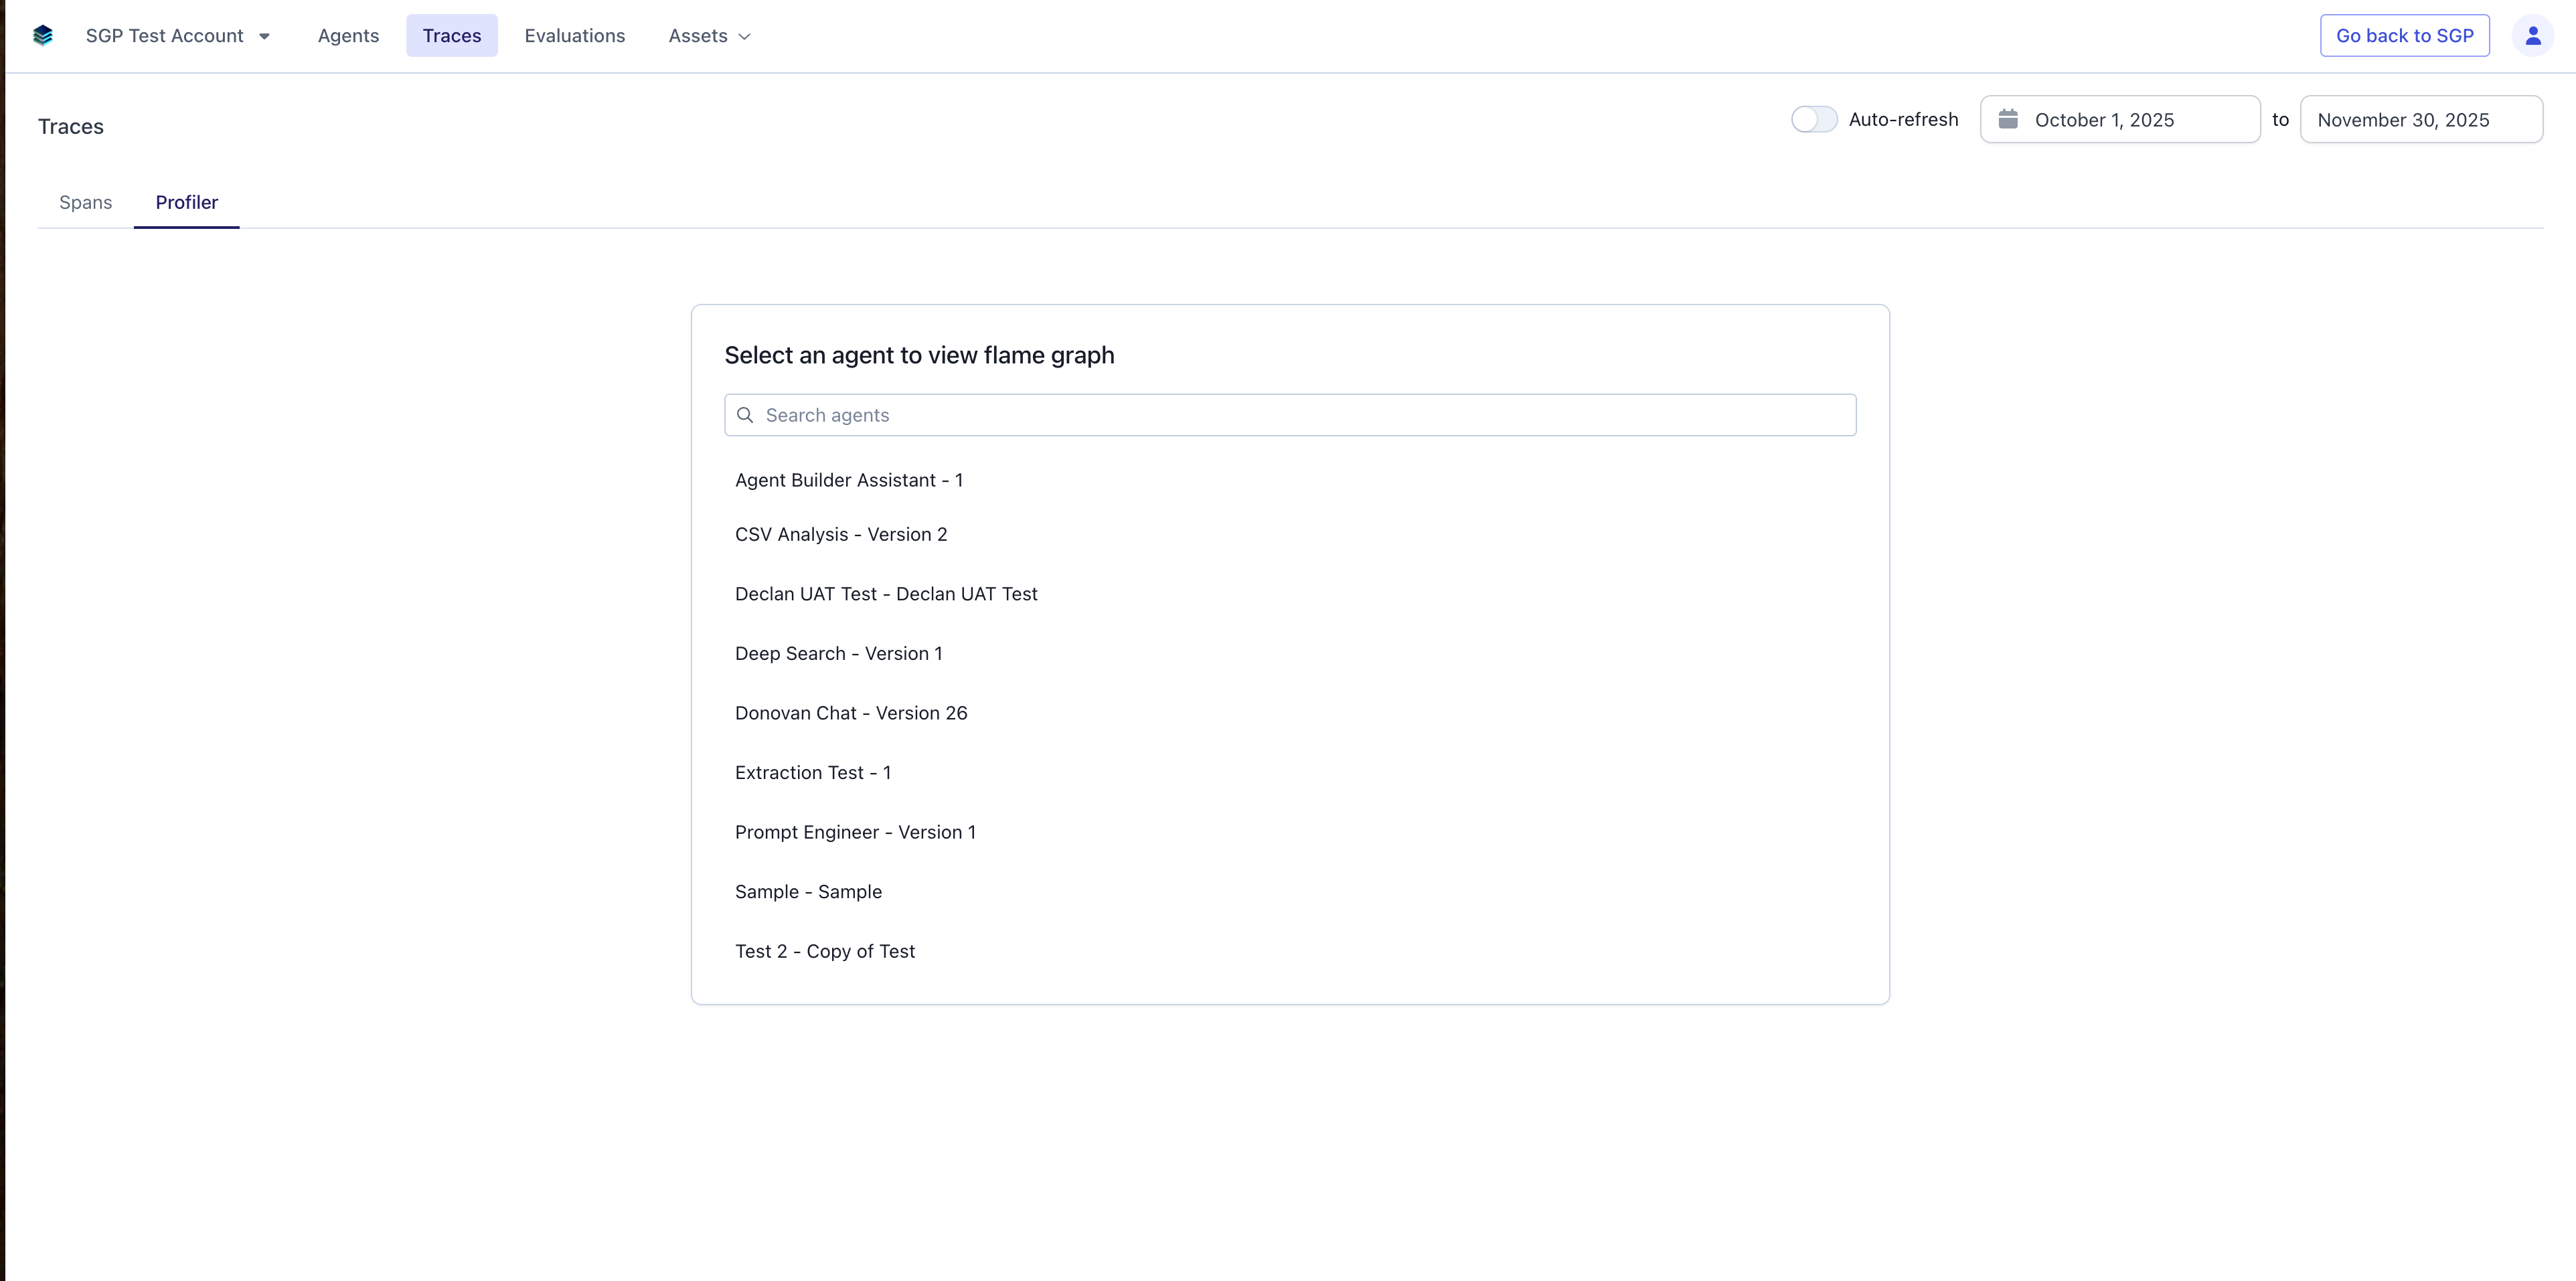
Performance Metrics
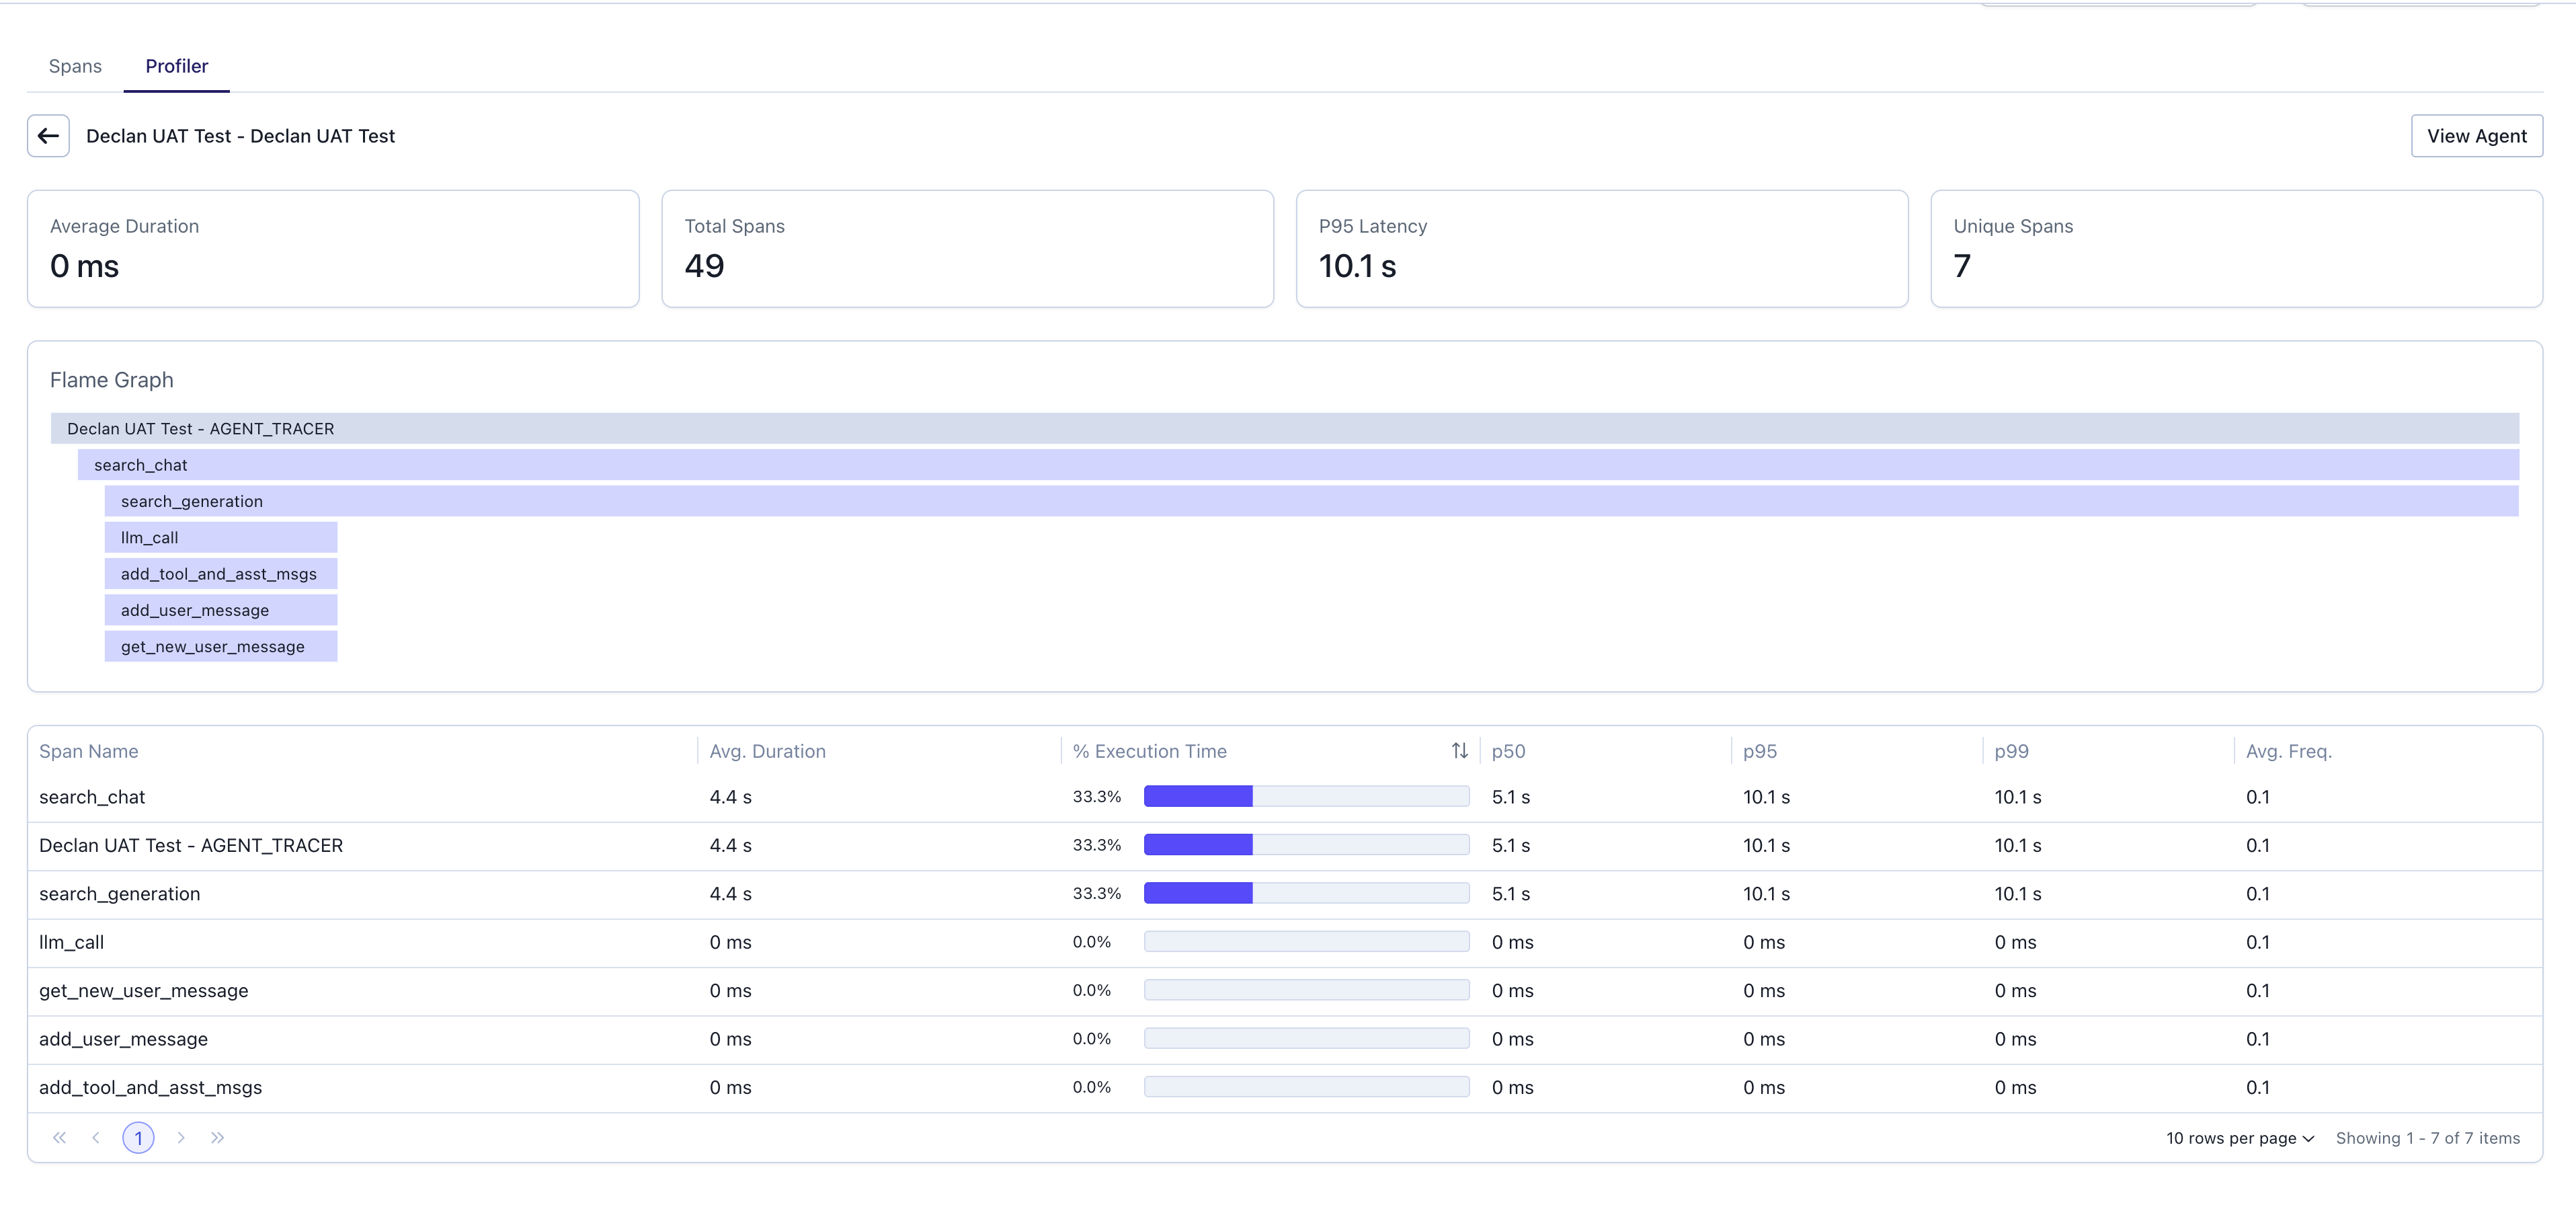
Once an agent is selected, the profiler displays key performance metrics at the top:- Average Duration: The mean execution time across all traces for this agent.
- Total Spans: The total number of spans recorded.
- P95 Latency: The 95th percentile latency, showing worst-case performance for most requests.
- Unique Spans: The count of distinct span types in the traces.
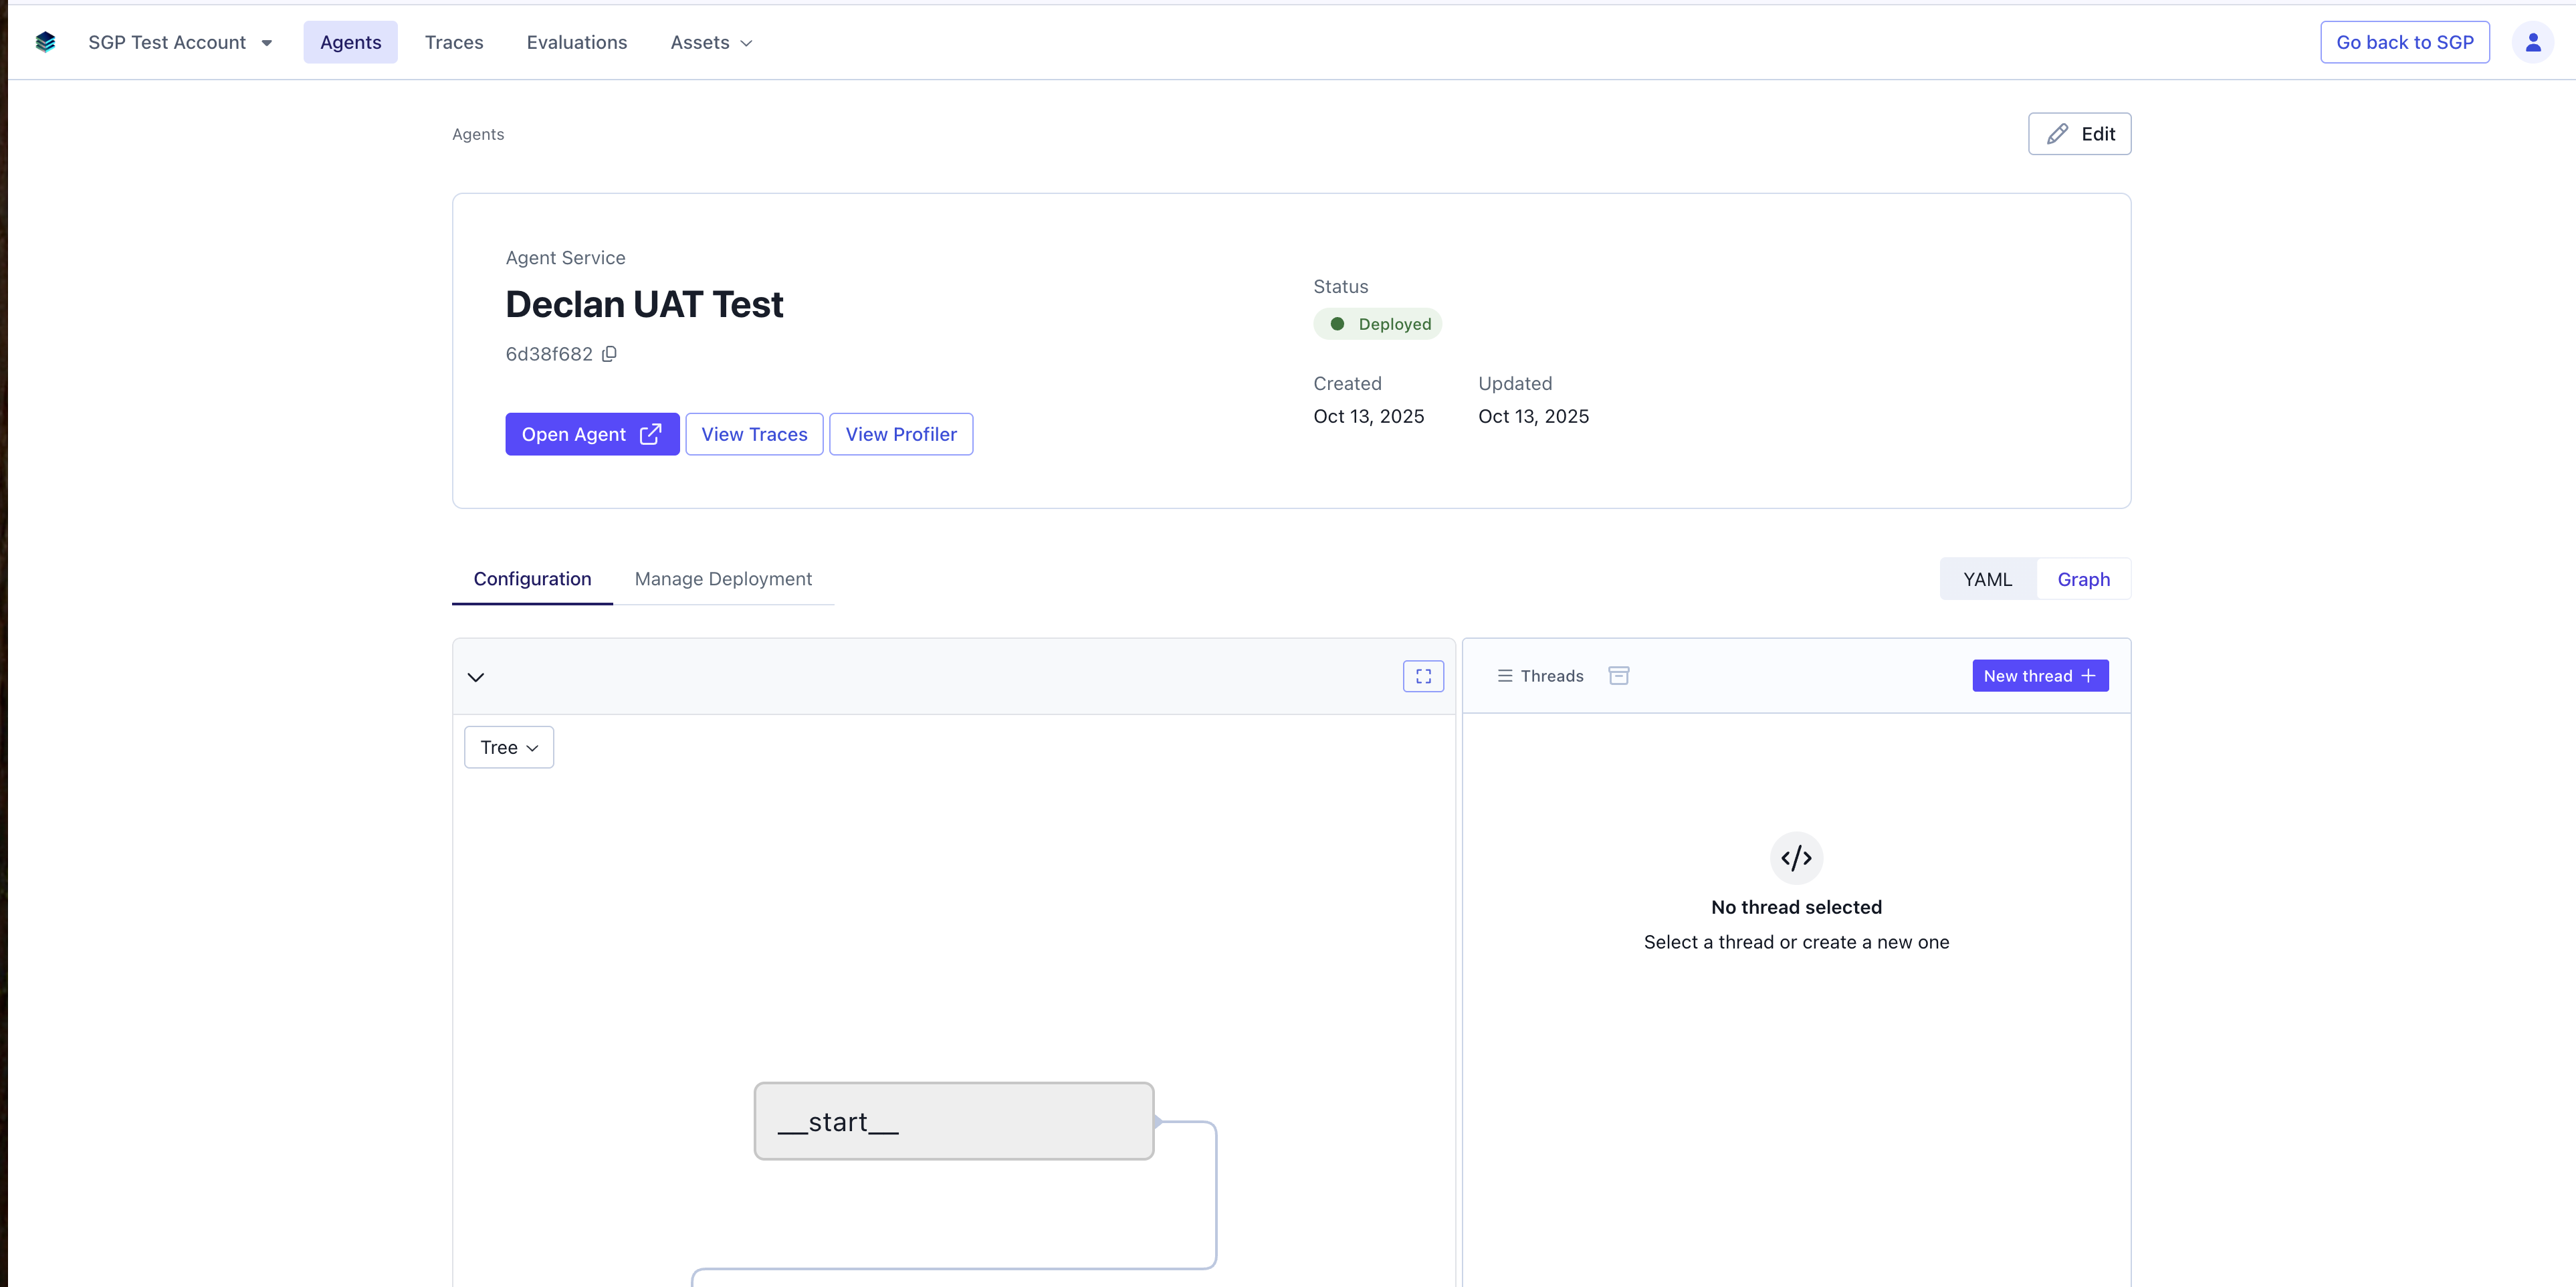
- View Agent Button: Takes you to the Agents page to view the agent details.
Aggregated Span Table
The span table is the core of the Profiler. Instead of listing individual traces, it lists every unique span name pertaining to the selected agent (e.g.,generate_assistant_message, followup_search_state) and shows performance metrics aggregated from all traces.
Key columns include:
- Span Name: The name of the operation.
- Average Duration: The average time this span takes to complete.
- Total Time (%): The percentage of total execution time across all traces consumed by this span. Sorting by this column is the most effective way to find major bottlenecks.
- P50 Latency: The median execution time, representing typical performance.
- P95 Latency: The 95th percentile latency, crucial for understanding worst-case performance and identifying outliers.
- Frequency (Avg. per Trace): How many times this span is called on average in a single execution.
Aggregate Flame Graph
The flame graph provides a visual representation of aggregated span performance:- Each horizontal bar represents a span, with width proportional to its Total Time (%).
- The visualization provides an immediate, intuitive map of your application’s biggest latency contributors.
- Spans are stacked vertically to show parent-child relationships.
- Color coding helps distinguish different span types.
- Click on any bar in the flame graph to open the Span Inspector for detailed metrics.
Span Inspector
When you click a row in the span table or a bar in the flame graph, the Inspector panel slides out with a deep dive on that specific span.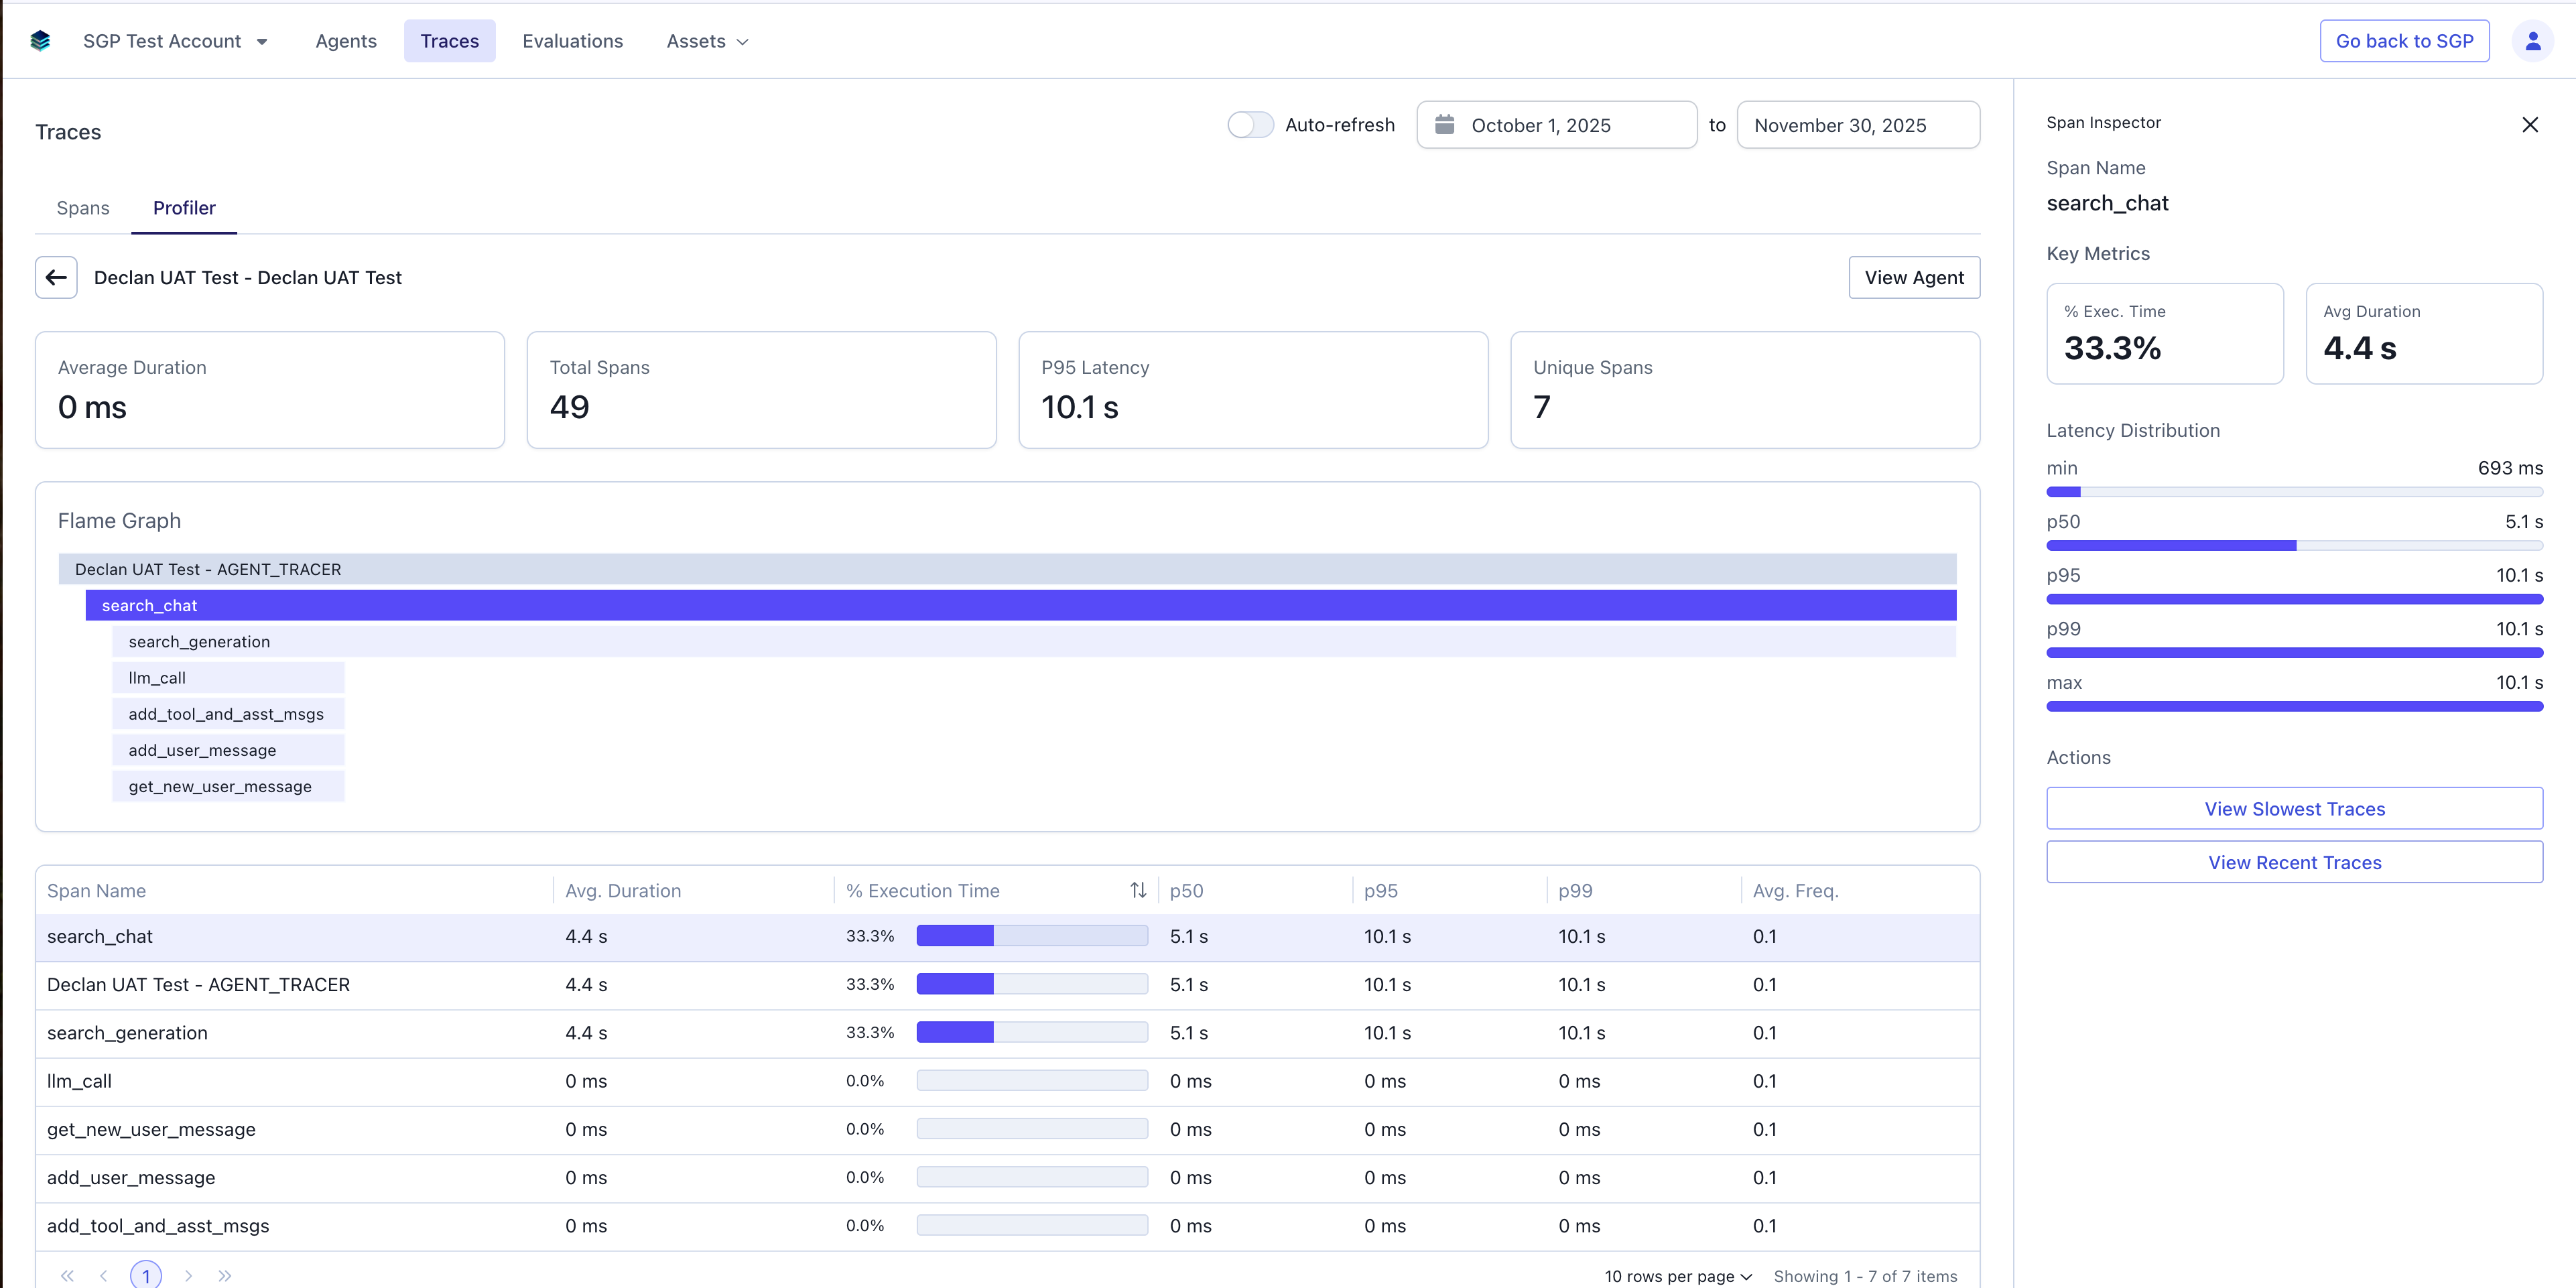
- % Execution Time: The percentage of total execution time consumed by this span across all traces.
- Average Duration: Mean execution time for this span.
- Min: The fastest execution time observed.
- P50 (Median): The median execution time, representing typical performance.
- P95: The 95th percentile execution time.
- P99: The 99th percentile execution time.
- Max: The slowest execution time observed.
- View Slowest Traces: Takes you to the Traces page, pre-filtered to show executions where this specific span was in the 95th percentile of slowness.
- View Recent Traces: Links to the most recent traces that include this span.
Example Workflow
Debugging Inconsistent Agent Performance
The Problem: A developer notices that the “Deep Research V3” agent’s duration varies wildly. Some traces are fast, but others (like a 117.7s execution) are painfully slow. They don’t know where to start looking. Step 1: Navigate to Profiler From the Traces view, they click the Profiler tab and select the “Deep Research V3” agent to analyze performance over the last 7 days. Step 2: Identify the Bottleneck They sort the Aggregated Span Table by Total Time (%) to find major bottlenecks. They immediately see thatfinal_report_state is at the top, consuming 38% of all agent execution time. They also notice its P95 latency is over 2x its P50 median (85.6s vs 35.5s), confirming it’s a source of inconsistent performance.
Step 3: Inspect the Span
They click the final_report_state row in the span table. The Span Inspector panel slides out, showing a histogram with a long tail. The detailed statistics confirm the outlier problem—some executions are extremely slow while most are reasonable.
Step 4: Find Specific Examples
In the Span Inspector, they click “View Slowest Traces” to see the actual problem cases.
Step 5: Debug
They are taken back to the Traces page, but it’s pre-filtered to show only the 5% of traces where final_report_state was slowest. They click the top trace in this list, which brings them to the detailed waterfall view. Now, instead of guessing, they know to focus their investigation on the final_report_state span and its children to solve the systemic issue.
Common Use Cases
Identifying Performance Bottlenecks
Use the Profiler to identify which spans are consuming the most time across your traces:- Select an agent to view its aggregated performance profile.
- Sort the Aggregated Span Table by Total Time (%) to find major bottlenecks.
- Examine the aggregate flame graph to visualize which operations take the longest—width represents each span’s contribution to total execution time.
- Look for spans with high P95 or P99 latencies relative to their P50 median, indicating inconsistent performance.
- Click on slow spans to view detailed statistics and latency distribution in the Span Inspector.
- Use “View Slowest Traces” to investigate specific instances of poor performance.
Comparing Agent Performance
Monitor and compare performance across different agents:- Switch between agents in the Agent Selection view.
- Compare average durations and P95 latencies across agents.
- Identify which agents or workflows need optimization.
- Use the flame graph to understand differences in execution patterns.
Monitoring Performance Over Time
Track performance trends and identify regressions:- Regularly check P95 and P99 latencies for critical spans.
- Compare current metrics against historical baselines.
- Investigate spikes in execution time by viewing recent traces containing affected spans.
- Use span-level metrics to validate the impact of optimizations.