Overview
This page walks through the Cloud Build and Deploy workflow in the SGP dashboard. The navigation flow is:
Agents grid → Agent detail → Build detail → Deploy modal → Deployment detail
Prerequisites:
- An SGP account with access to the Agents tab
- At least one Agentex agent registered to your account
- A
manifest.yaml and environments.yaml prepared for your agent (see the CI/CD guide for file format details)
Viewing your agents
Open the Agents tab from the top navigation bar. This shows all Agentex agents registered to your account.
Click any agent card to open its detail page.
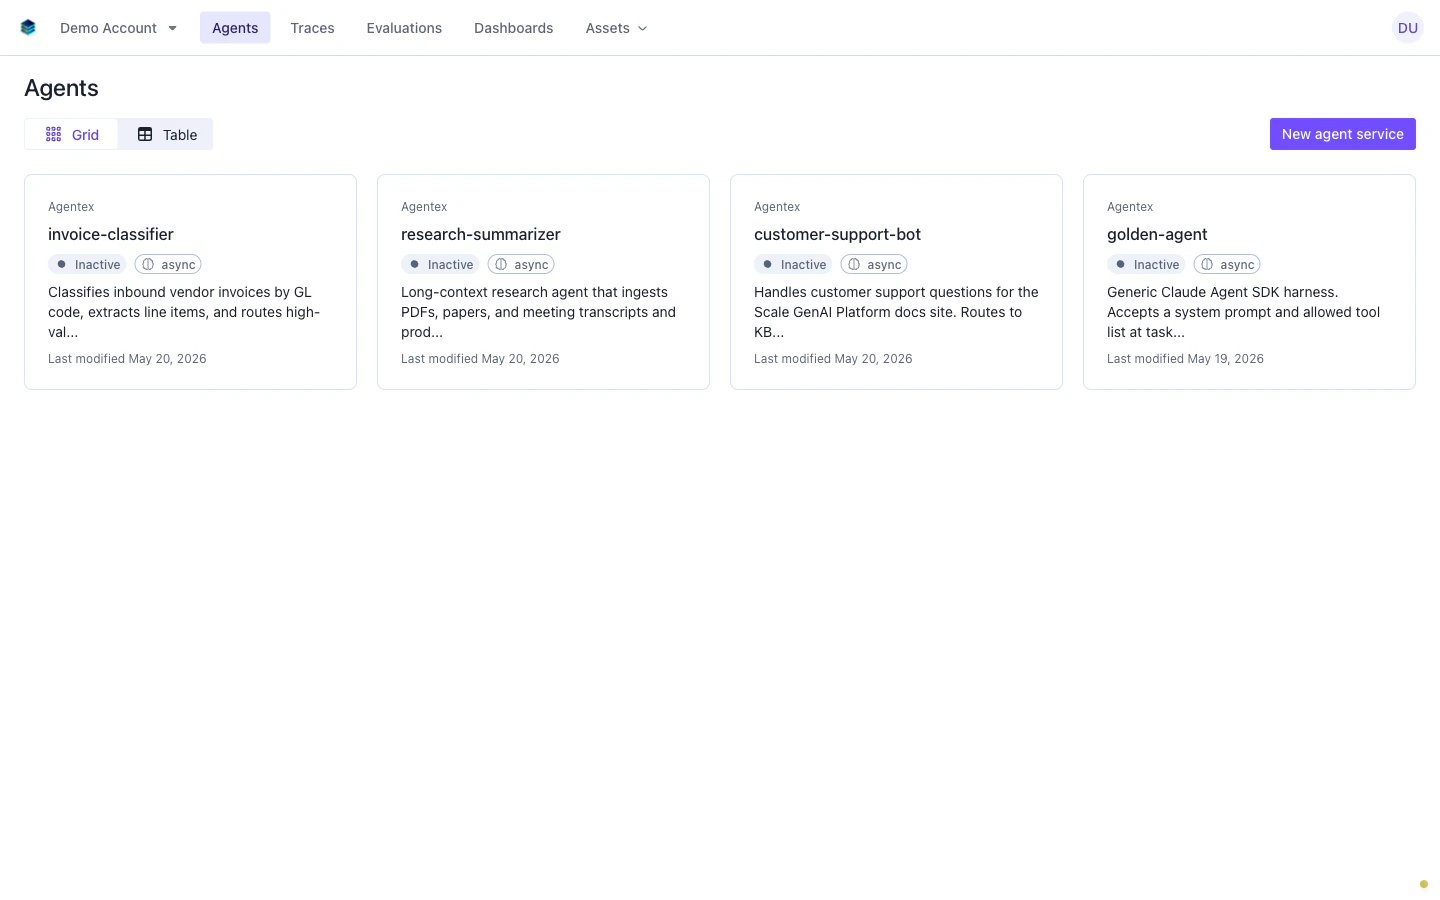
Agent detail and build history
The agent detail page has a metadata header at the top and the build history timeline below.
The action buttons in the header link to the agent’s live endpoint (Open Agent), its request traces (View Traces), and its performance profiler (View Profiler). Open Agent is only available when the agent has an active deployment.
The Build History lists every build for this agent, most recent first. The status badges map to:
| Status | Meaning |
|---|
| Building | Image build is in progress |
| Deploying | Build succeeded, deployment is actively rolling out |
| Error | Build failed during the image build phase |
| Inactive | Build succeeded but is not currently deployed |
| Success | Build completed successfully (visible on build detail page) |
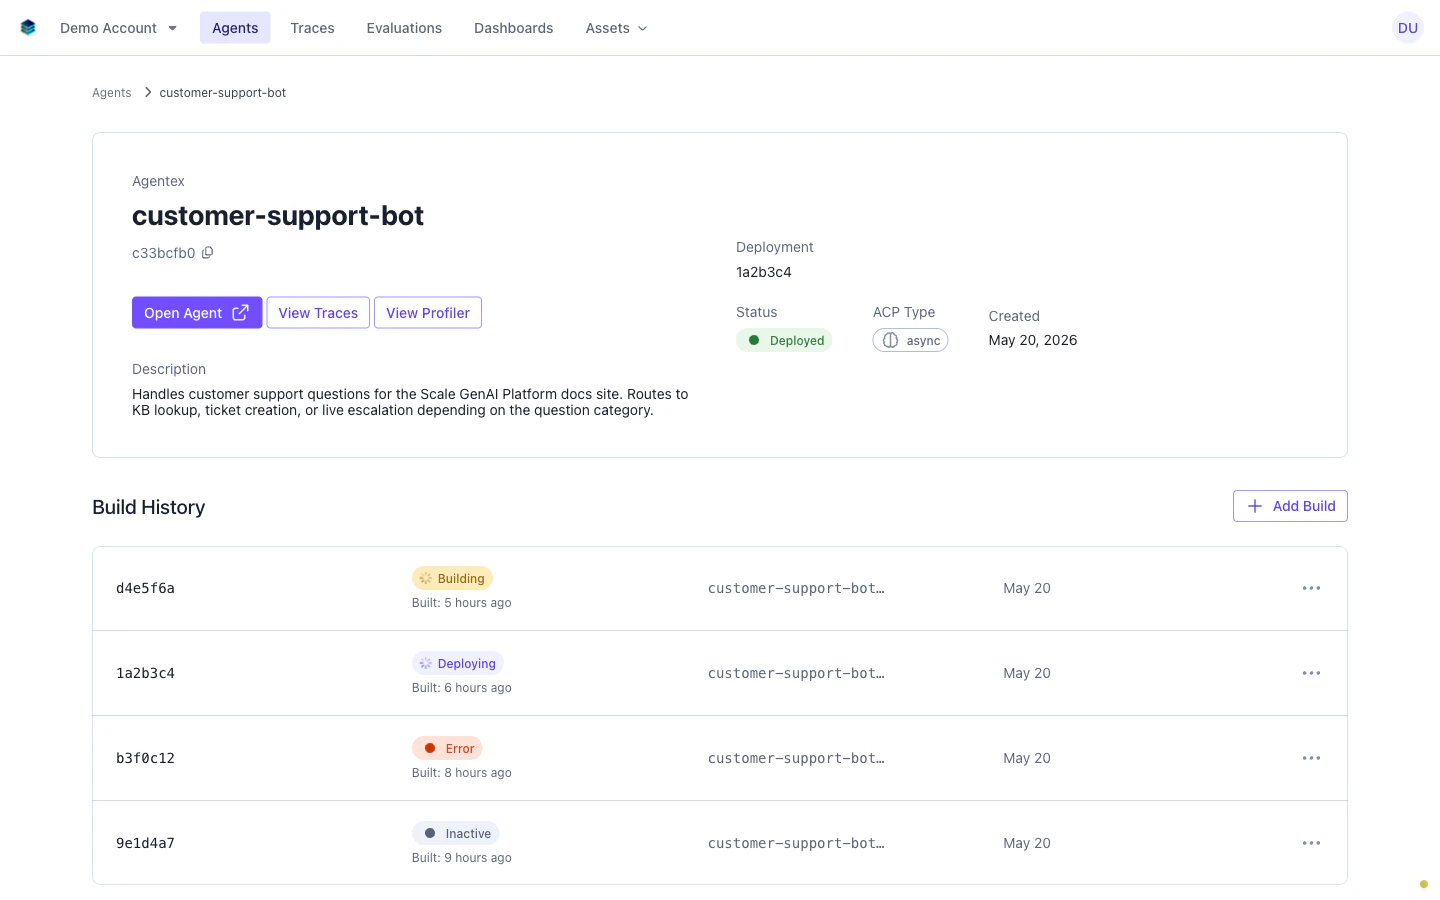
Click + Add Build to trigger a new cloud build from the UI.
Most teams use CI/CD pipelines for automated builds and reserve the UI button for ad-hoc builds during development.
Click any build row to open its build detail page.
Deploying a build
The build detail page shows build metadata, build logs, and all deployments created from this build.
The Build Logs section is collapsible and includes a search bar for filtering output. Use the build duration in the header to distinguish early failures (missing Dockerfile, bad config) from late failures (dependency errors).
To deploy, click Create deployment in the Deployments section to open the deploy modal.
The modal has two collapsible YAML sections: Manifest File (
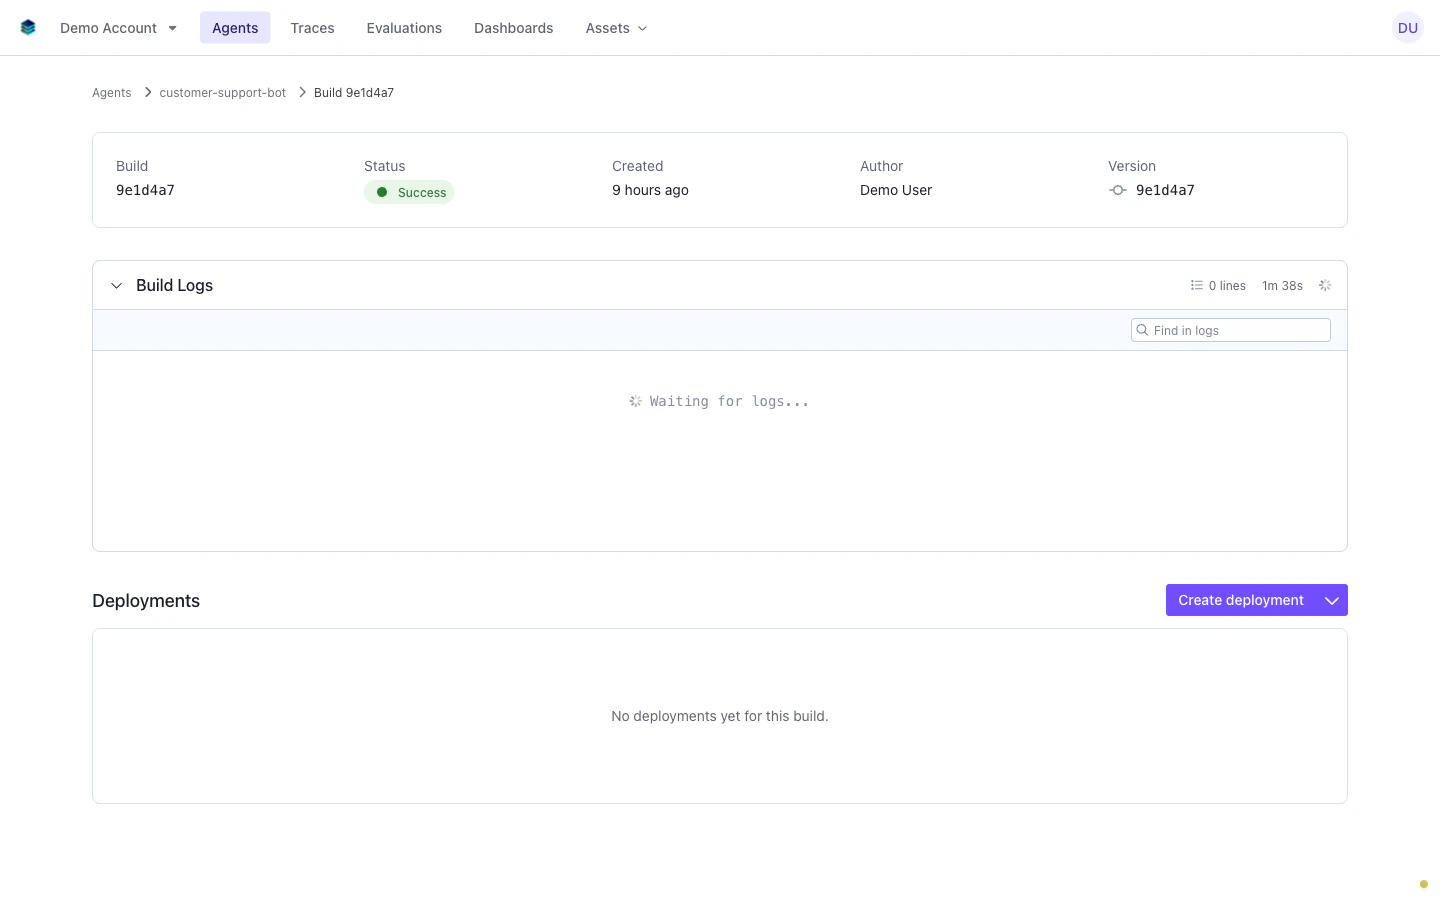
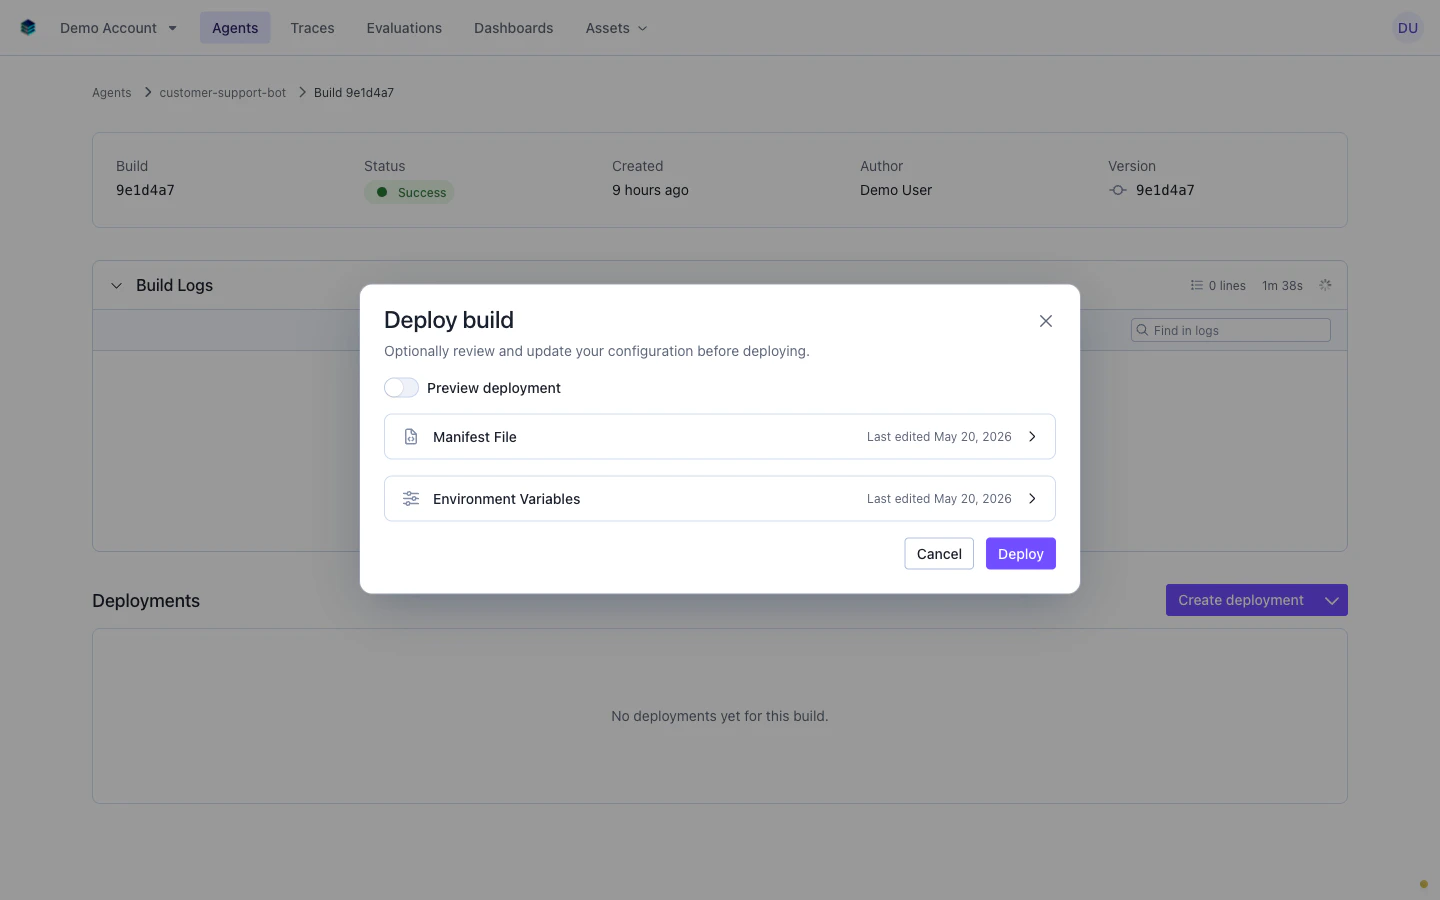
manifest.yaml) and Environment Variables (environments.yaml).
- On your first deployment, paste your
manifest.yaml and environments.yaml content into the respective sections.
- On subsequent deployments, both sections pre-populate from the last deployment. You can deploy without expanding them if no changes are needed.
- Enable the Preview deployment toggle to create an ephemeral deployment with an automatic TTL instead of a production deployment. See Preview Deployments.
Deployments that reference missing secrets will fail during the Helm release phase. Ensure secrets are created in the SGP secret store before deploying. See Secrets.
Monitoring a deployment
The build detail page lists all deployments from this build. Reload the page to see status updates.
Production deployments show a gray badge; preview deployments show a purple badge with the PR number and an expiration countdown. Preview deployments are automatically torn down when the TTL expires.
Click any deployment row to inspect its event timeline and logs.
The Deployment Events section shows the Kubernetes event sequence for the rollout. A successful deployment progresses through: Scheduled → Pulling → Pulled → Created → Started → ScalingReplicaSet → ReleaseSuccessful.
The Deploy Logs section shows container runtime output. If the deployment is healthy and the agent produces no stdout on startup, this section may show “No logs available.”
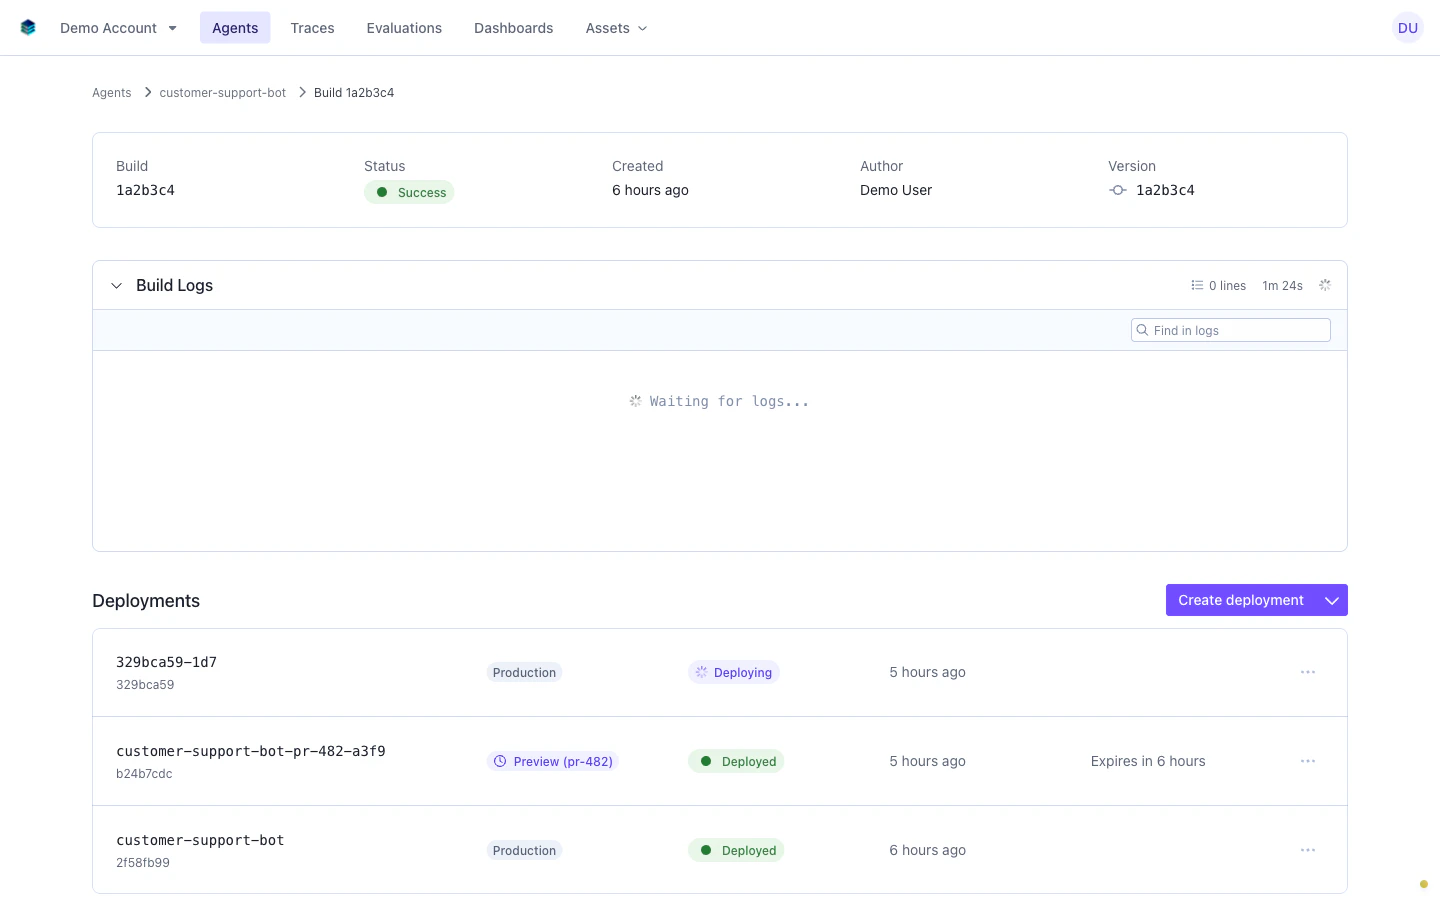
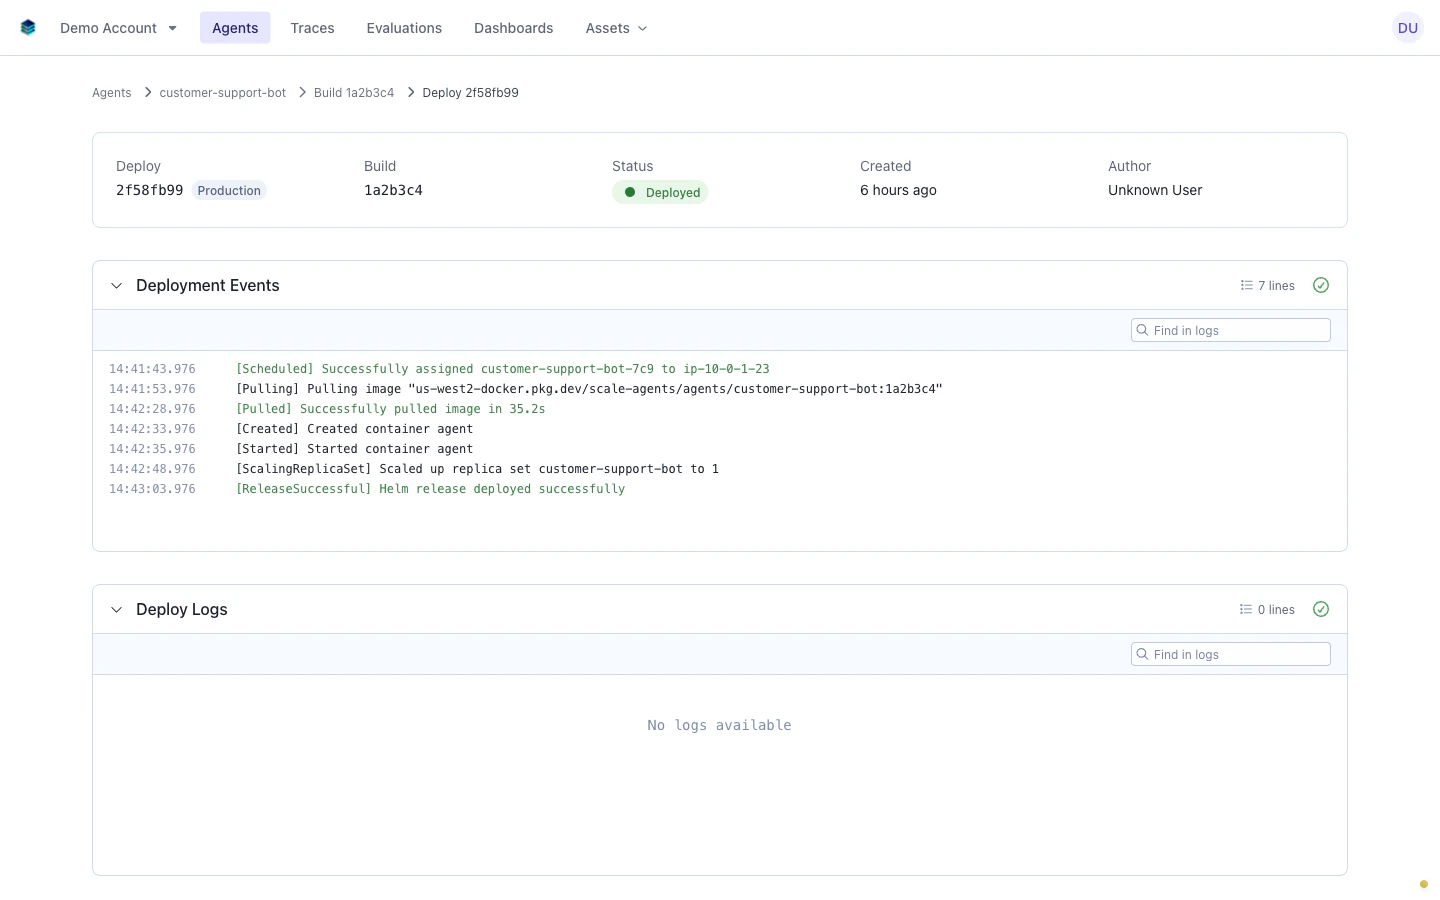
Diagnosing a failing deployment
A gap in the event timeline tells you where the problem is:
| Last event seen | Likely cause |
|---|
| Scheduled | Image could not be pulled. Check the image reference and registry access. |
| Pulling | Image pull is timing out. Large images or registry rate limits. |
| Started | Health check is not passing. Check Deploy Logs for runtime errors. |
| ScalingReplicaSet (no ReleaseSuccessful) | Helm timeout or release hook issue. |
If a deployment stays in Deploying longer than expected, check Deployment Events. Missing events after Scheduled usually mean node resource constraints or image pull failures.
Diagnosing a failed build
Failed builds show a Failed badge on the build detail page and an Error badge in the Build History list (same state, different labels).
The Create deployment button is disabled for failed builds.
Check the Build Logs for error output. A short build duration (under 30 seconds) usually points to a configuration error (missing Dockerfile, invalid manifest) rather than a code error.
Common causes:
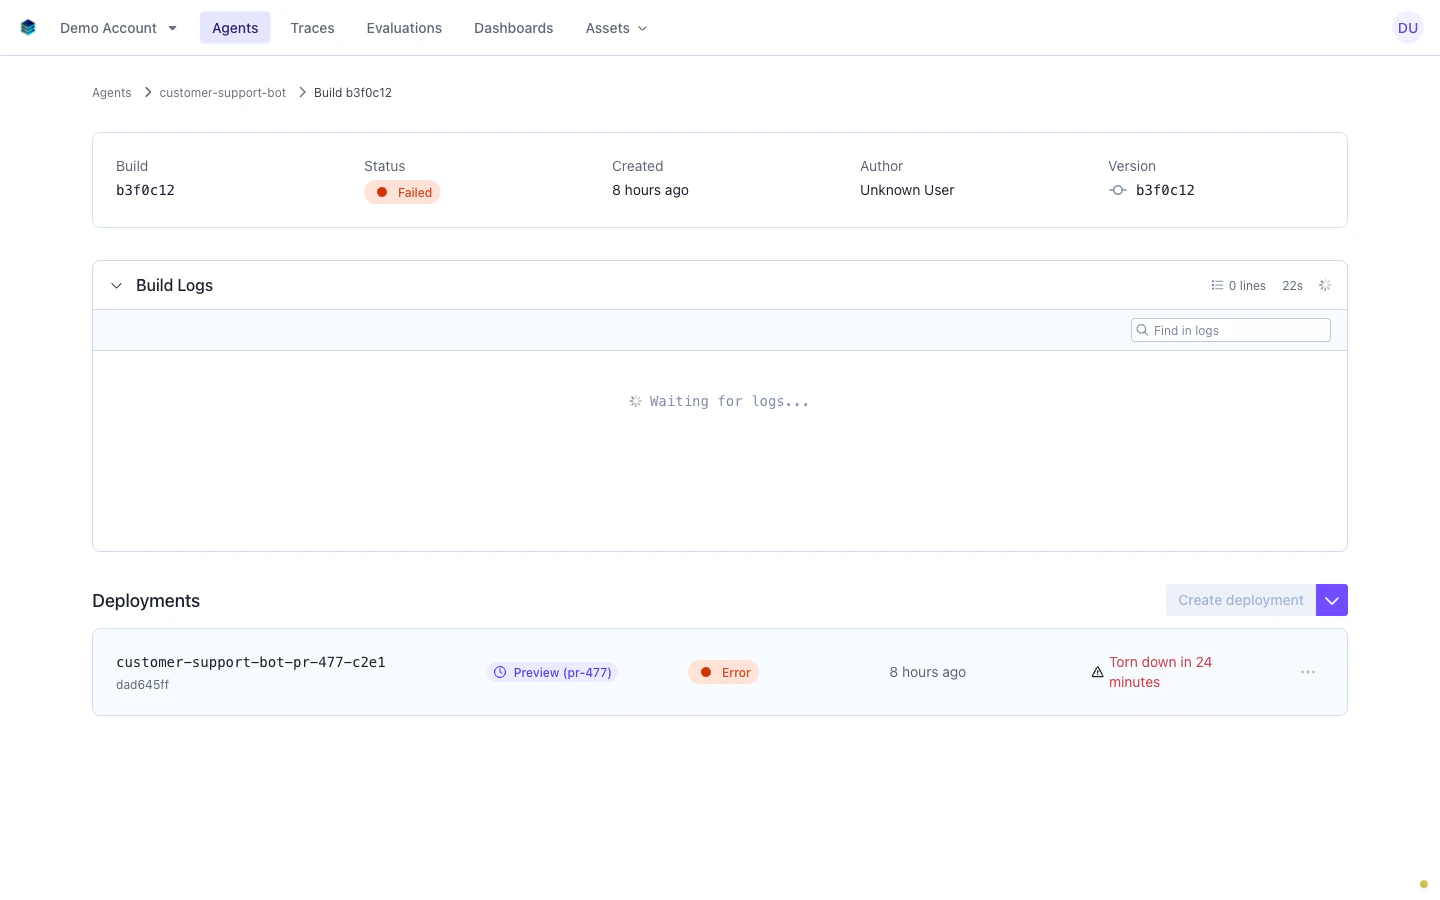
- Dockerfile not found:
manifest.yaml references a path that doesn’t exist in the build context
- Dependency install failure:
pip install, npm install, etc. fails
- Build context too large: add a
.dockerignore to exclude unnecessary files
- Invalid manifest: syntax errors or invalid field values in
manifest.yaml
- Missing secrets: the manifest references a secret that doesn’t exist
- Base image unavailable: the Dockerfile’s base image can’t be pulled
- Timeout: build exceeded the maximum duration
If builds fail repeatedly, verify the agent builds locally first with docker build. This surfaces issues faster than iterating through the cloud pipeline.
Next steps