Monitoring Executions
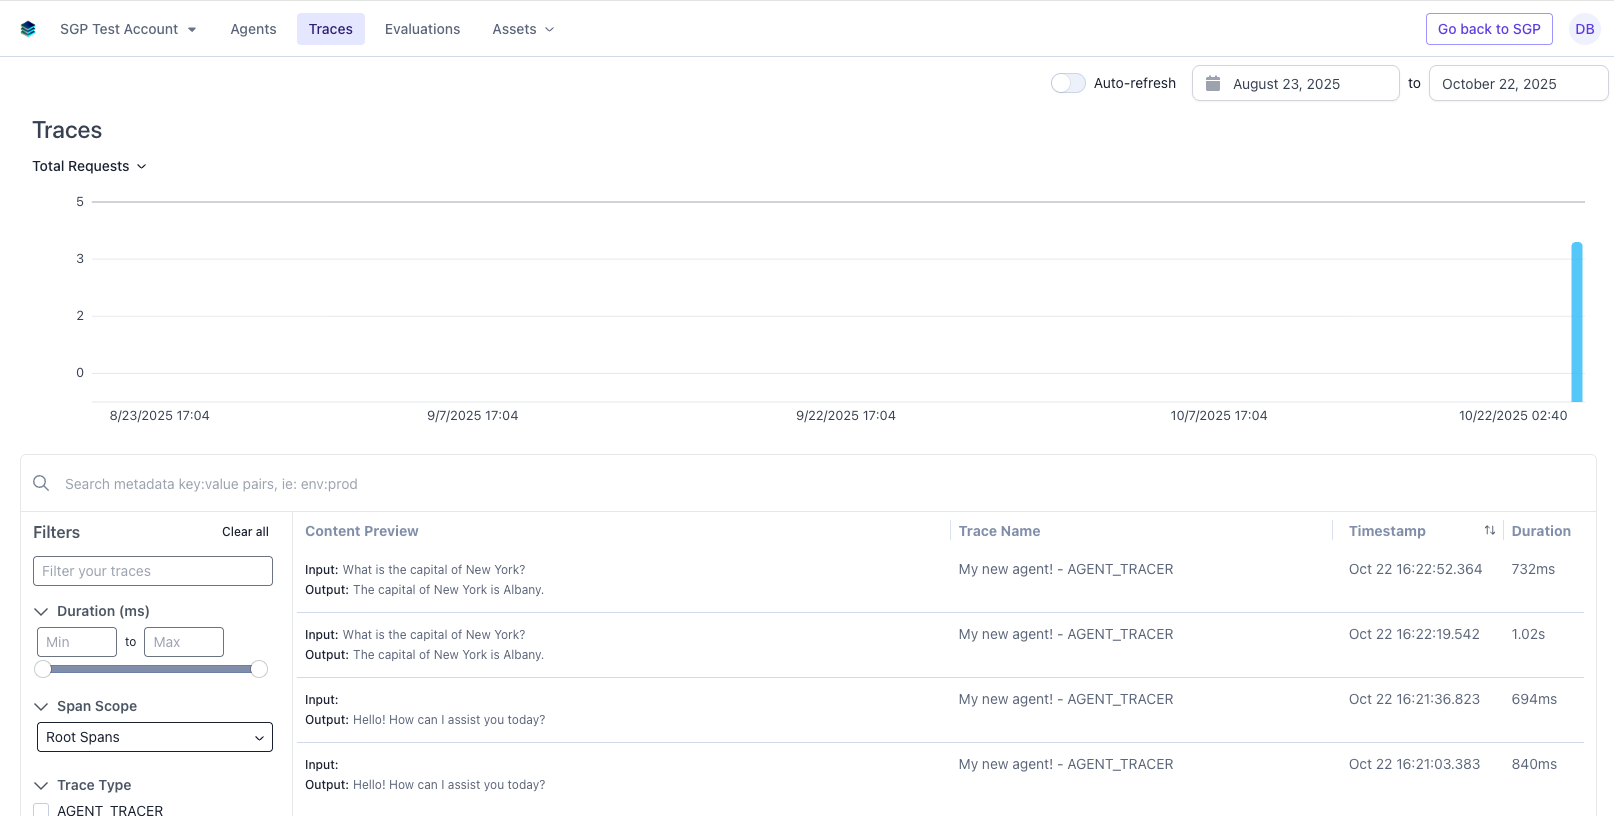
Every time an agent is run (during testing or otherwise), it is recorded and can be viewed on the traces page. This provides a comprehensive view of all threads and their inputs/outputs, helping you track performance and diagnose issues. You can navigate to the traces page by clicking the View Traces button in the agent header.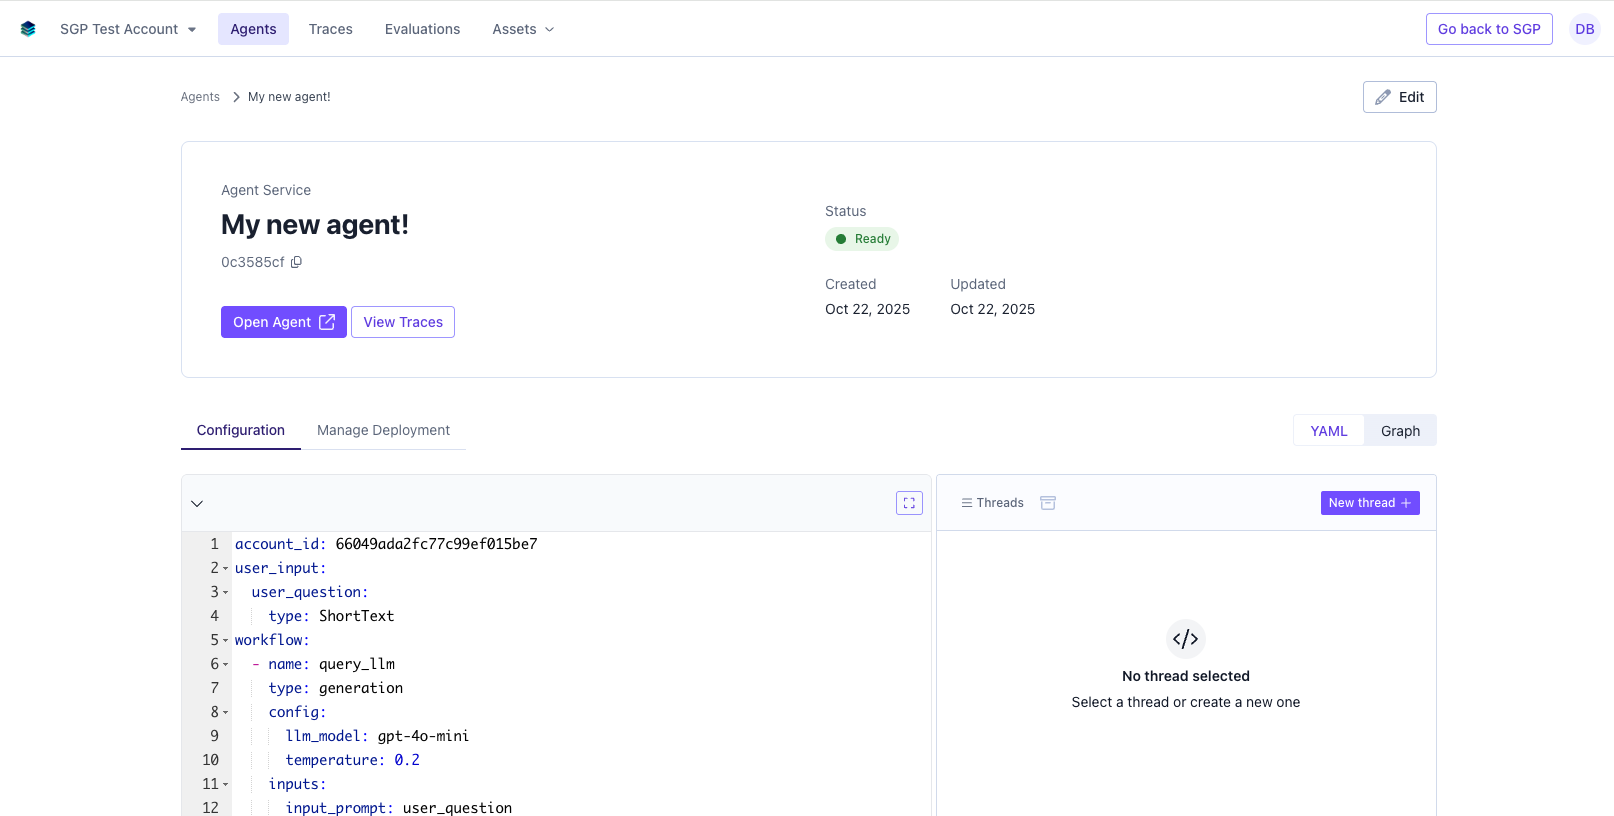
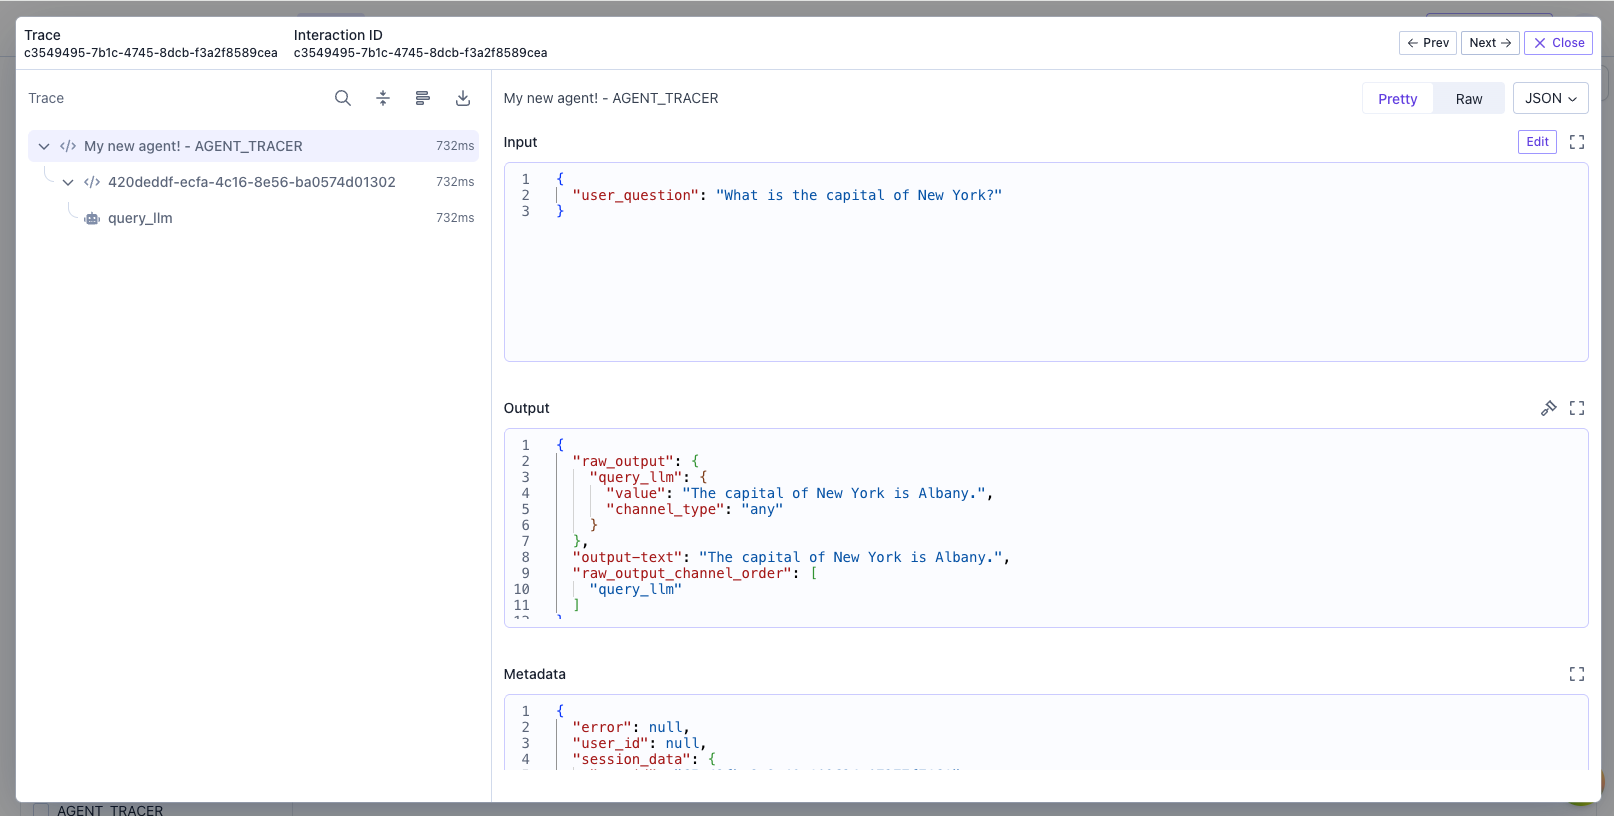
- View the inputs and outputs of each thread
- View the performance metrics of each thread
- View the metadata of each thread
- Filter and search for specific threads