> ## Documentation Index
> Fetch the complete documentation index at: https://docs.gp.scale.com/llms.txt
> Use this file to discover all available pages before exploring further.
# Timeseries Widget
> Track metrics over time with line charts
Timeseries widgets are only supported in evaluation group dashboards. They are not available when creating a dashboard for a single evaluation.
 ## When to Use
Use timeseries widgets to:
* Track metric trends over time across evaluation runs
* Compare performance across evaluations in an evaluation group
* Monitor score progression across multiple evaluation iterations
* Visualize how metrics change as new evaluations are added to a group
## Configuration
### Required Fields
Widget display name shown on the dashboard
Must be set to "timeseries"
SeriesQuery with at least one aggregation
### Query Requirements
Timeseries widgets require a **SeriesQuery** with:
* At least one aggregation in the `select` clause
* The x-axis is determined automatically based on context:
* **Evaluation group dashboards**: Uses the evaluation creation date as the x-axis, plotting one line per evaluation
* Can include `filter` to narrow the dataset
* Supports per-aggregation `evaluation_ids` for eval group dashboards (see below)
## Creating in the UI
From your dashboard, click "Add Widget" and select "Timeseries"
Give your chart a descriptive name (e.g., "Average Score Over Time")
## When to Use
Use timeseries widgets to:
* Track metric trends over time across evaluation runs
* Compare performance across evaluations in an evaluation group
* Monitor score progression across multiple evaluation iterations
* Visualize how metrics change as new evaluations are added to a group
## Configuration
### Required Fields
Widget display name shown on the dashboard
Must be set to "timeseries"
SeriesQuery with at least one aggregation
### Query Requirements
Timeseries widgets require a **SeriesQuery** with:
* At least one aggregation in the `select` clause
* The x-axis is determined automatically based on context:
* **Evaluation group dashboards**: Uses the evaluation creation date as the x-axis, plotting one line per evaluation
* Can include `filter` to narrow the dataset
* Supports per-aggregation `evaluation_ids` for eval group dashboards (see below)
## Creating in the UI
From your dashboard, click "Add Widget" and select "Timeseries"
Give your chart a descriptive name (e.g., "Average Score Over Time")
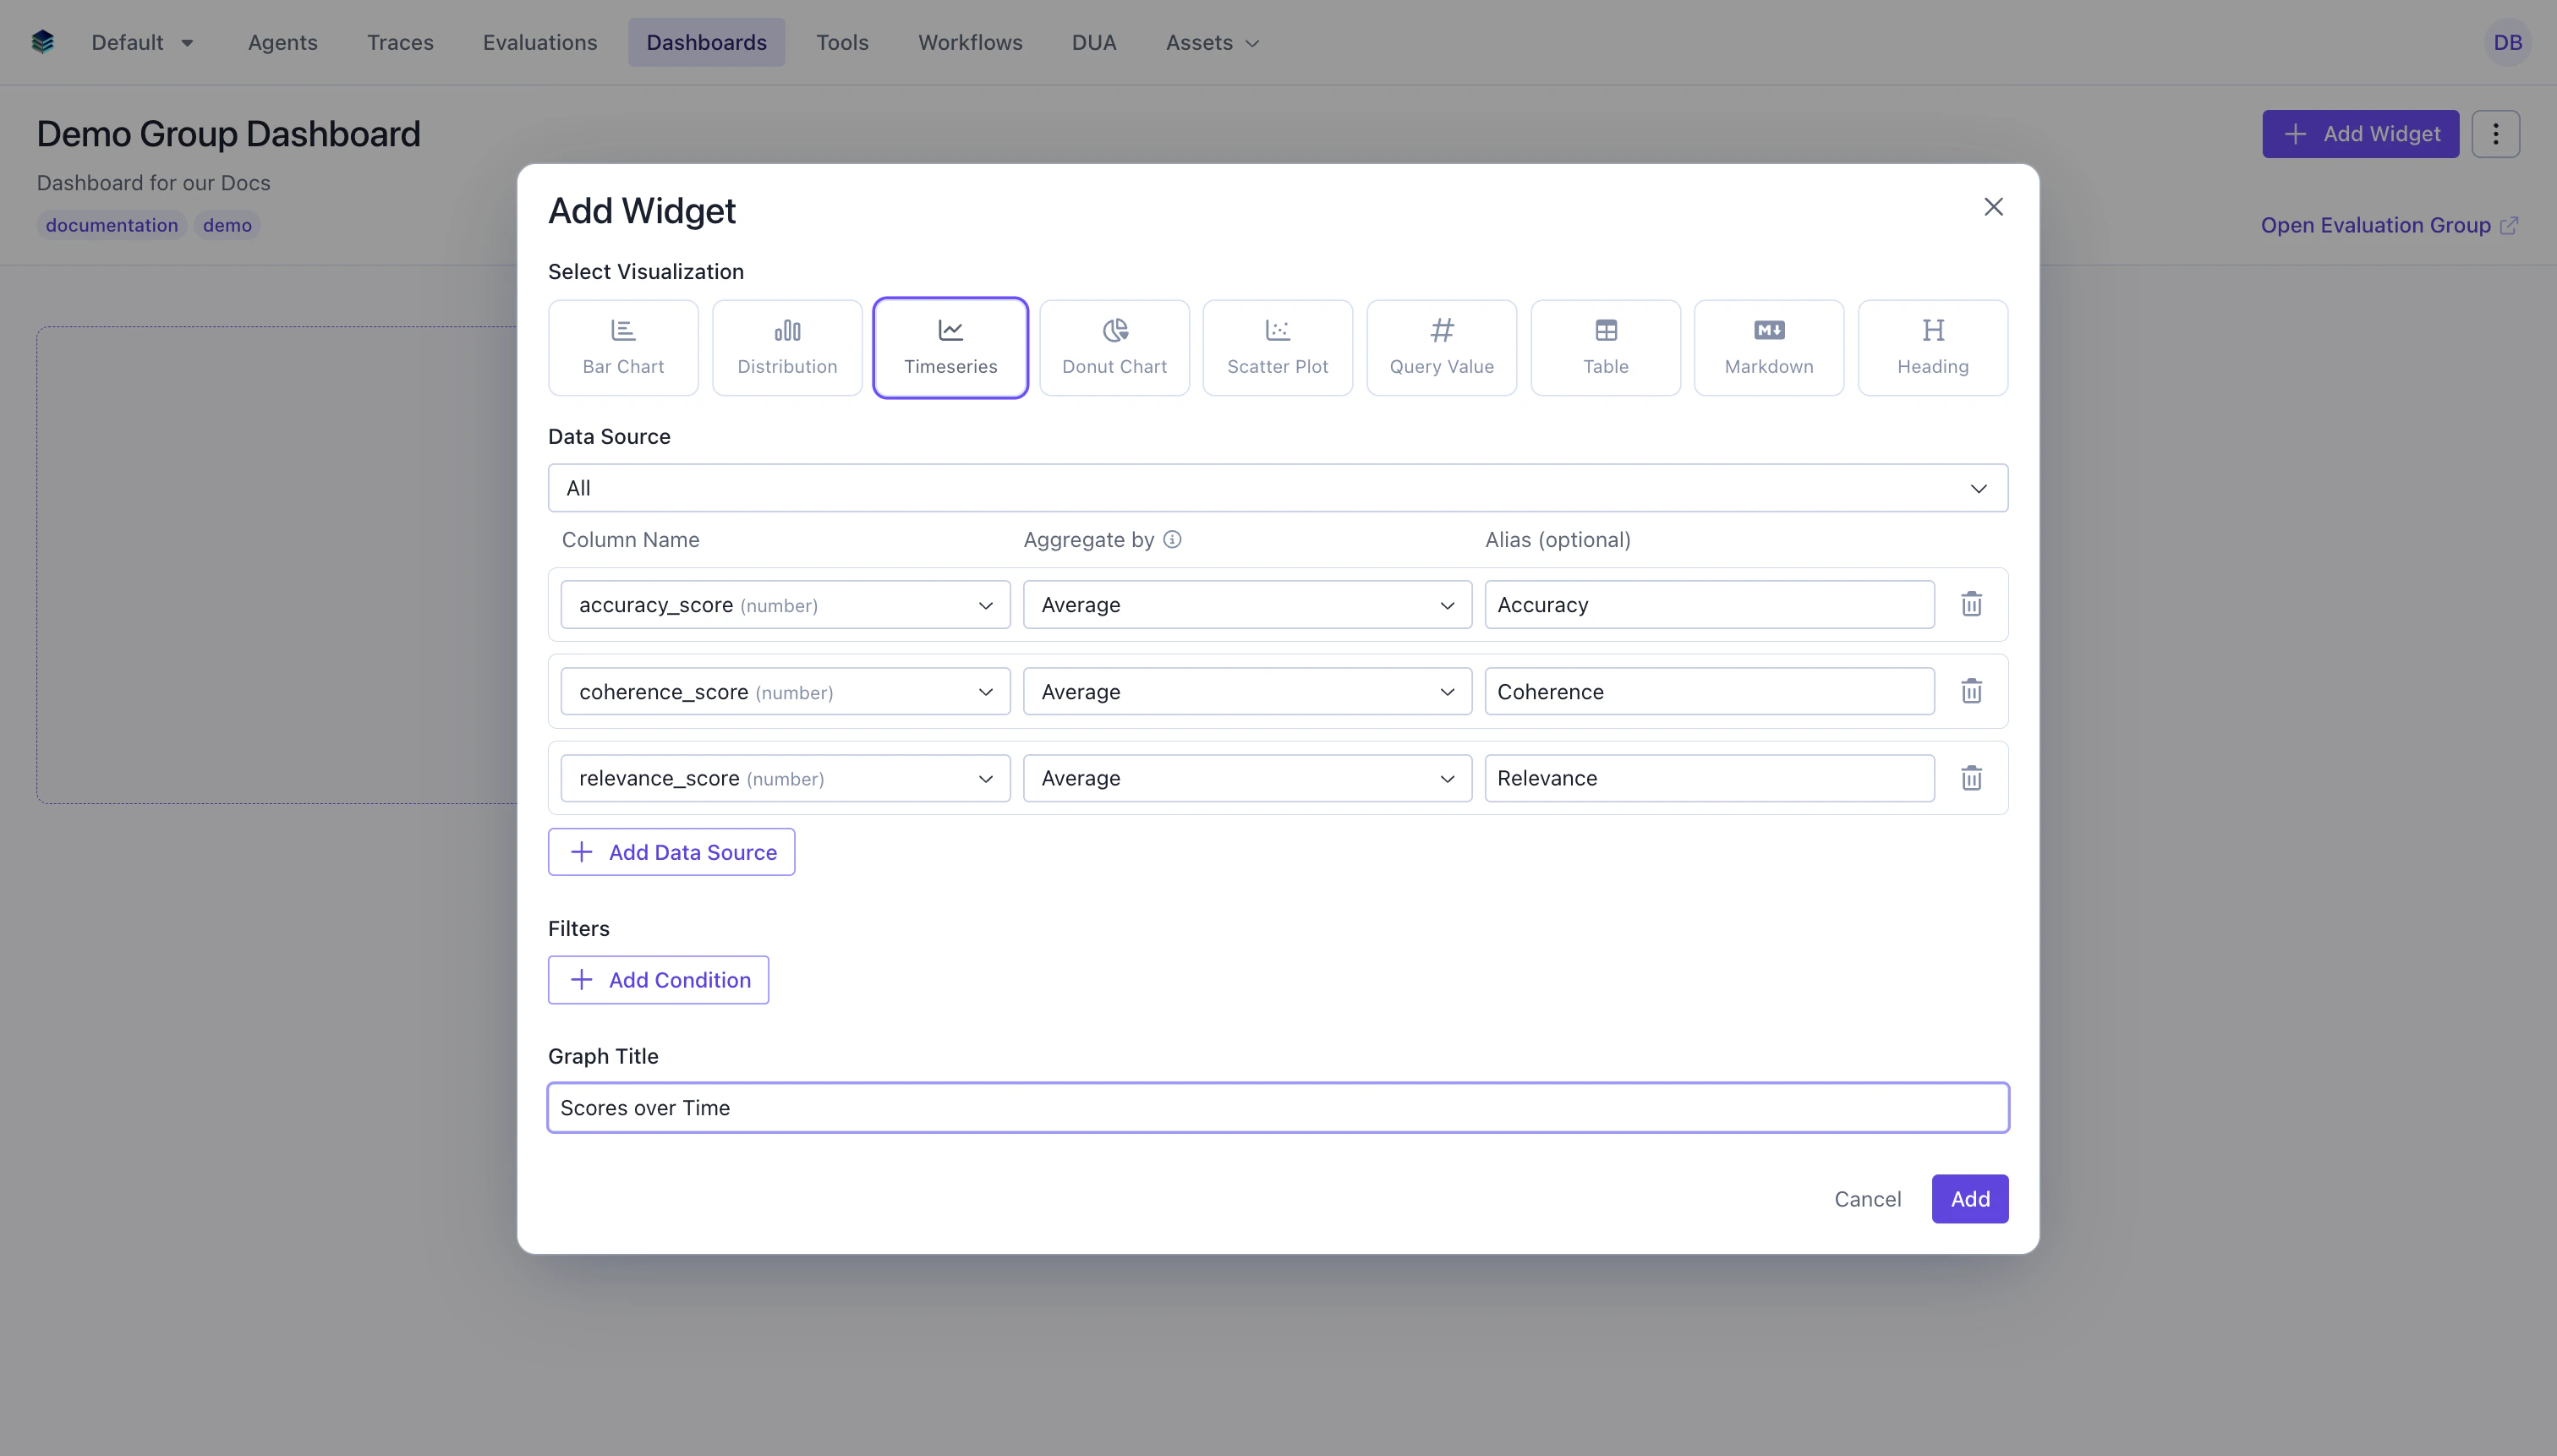 Add one or more aggregations to track over time:
* **Column**: Select the numeric field to aggregate
* **Aggregation**: Choose the function (`AVG`, `SUM`, `COUNT`, etc.)
* **Alias**: Name for the metric line (optional but recommended)
* **Evaluations**: For eval group dashboards, select which evaluations to include per aggregation
Add conditions to narrow the data before aggregation.
Click "Add" to generate the timeseries chart
## Output Format
Timeseries widgets return data points for each time period:
```json theme={null}
{
"type": "series",
"data": [
{"evaluation": "Eval Run 1", "avg_score": 0.82, "created_at": "2026-01-15"},
{"evaluation": "Eval Run 2", "avg_score": 0.85, "created_at": "2026-01-22"},
{"evaluation": "Eval Run 3", "avg_score": 0.89, "created_at": "2026-01-29"}
]
}
```
## Evaluation Group Context
In evaluation group dashboards, timeseries widgets have special behavior:
* **One line per metric**: Each metric in the query is plotted as a separate line on the chart
* **X-axis**: The evaluation creation date determines the position on the x-axis
* **Per-evaluation selection**: You can choose which evaluations to include per aggregation, allowing you to compare specific subsets
* **Auto-update**: When evaluations are added to or removed from the group, the timeseries automatically updates to reflect the new membership
### Example: Average Score Trend Across Evaluations
Track how average scores change across evaluation runs in a group.
```python Python theme={null}
widget = client.evaluation_dashboards.widgets.create(
dashboard_id=dashboard.id,
title="Average Score Trend",
type="timeseries",
query={
"select": [
{
"expression": {
"type": "AGGREGATION",
"function": "AVG",
"column": "overall_score",
"source": "data"
},
"alias": "avg_overall_score"
}
],
"evaluation_ids": ["eval-1", "eval-2", "eval-3"]
}
)
```
```json JSON theme={null}
{
"title": "Average Score Trend",
"type": "timeseries",
"query": {
"select": [
{
"expression": {
"type": "AGGREGATION",
"function": "AVG",
"column": "overall_score",
"source": "data"
},
"alias": "avg_overall_score"
}
],
"evaluation_ids": ["eval-1", "eval-2", "eval-3"]
}
}
```
***
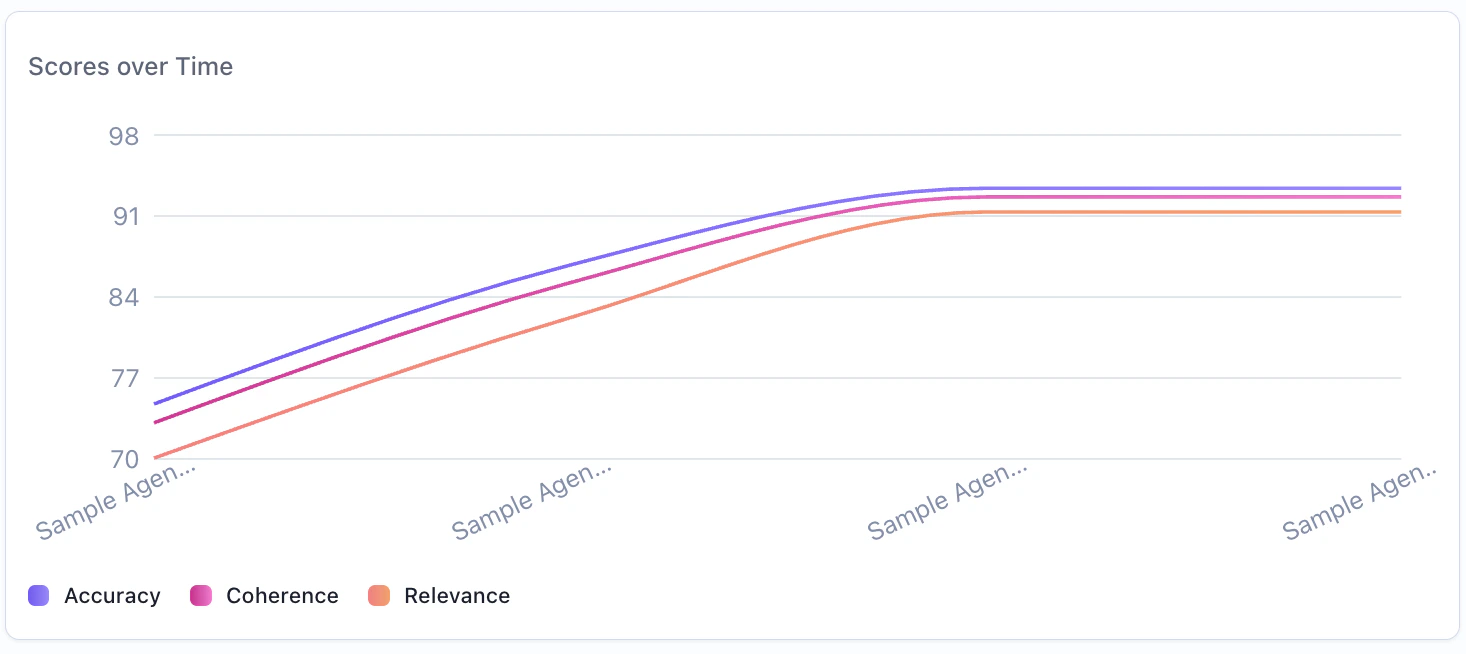
### Example: Multi-Metric Comparison Over Time
Track multiple metrics across evaluations to see how different scores evolve.
```python Python theme={null}
widget = client.evaluation_dashboards.widgets.create(
dashboard_id=dashboard.id,
title="Score Metrics Over Time",
type="timeseries",
query={
"select": [
{
"expression": {
"type": "AGGREGATION",
"function": "AVG",
"column": "accuracy_score",
"source": "data"
},
"alias": "avg_accuracy"
},
{
"expression": {
"type": "AGGREGATION",
"function": "AVG",
"column": "relevance_score",
"source": "data"
},
"alias": "avg_relevance"
},
{
"expression": {
"type": "AGGREGATION",
"function": "AVG",
"column": "coherence_score",
"source": "data"
},
"alias": "avg_coherence"
}
],
"evaluation_ids": ["eval-1", "eval-2", "eval-3", "eval-4"]
}
)
```
```json JSON theme={null}
{
"title": "Score Metrics Over Time",
"type": "timeseries",
"query": {
"select": [
{
"expression": {"type": "AGGREGATION", "function": "AVG", "column": "accuracy_score", "source": "data"},
"alias": "avg_accuracy"
},
{
"expression": {"type": "AGGREGATION", "function": "AVG", "column": "relevance_score", "source": "data"},
"alias": "avg_relevance"
},
{
"expression": {"type": "AGGREGATION", "function": "AVG", "column": "coherence_score", "source": "data"},
"alias": "avg_coherence"
}
],
"evaluation_ids": ["eval-1", "eval-2", "eval-3", "eval-4"]
}
}
```
## Related Documentation
* [Evaluation Group Dashboards](../eval-group-dashboards) - Full guide on group dashboards
* [Bar Chart Widget](./bar) - For categorical comparisons
* [Metric Widget](./metric) - For single computed values
* [Query Language](../query-language) - Aggregation and filter syntax
* [API Reference](/reference/v5/evaluation-dashboards) - Programmatic chart creation
Add one or more aggregations to track over time:
* **Column**: Select the numeric field to aggregate
* **Aggregation**: Choose the function (`AVG`, `SUM`, `COUNT`, etc.)
* **Alias**: Name for the metric line (optional but recommended)
* **Evaluations**: For eval group dashboards, select which evaluations to include per aggregation
Add conditions to narrow the data before aggregation.
Click "Add" to generate the timeseries chart
## Output Format
Timeseries widgets return data points for each time period:
```json theme={null}
{
"type": "series",
"data": [
{"evaluation": "Eval Run 1", "avg_score": 0.82, "created_at": "2026-01-15"},
{"evaluation": "Eval Run 2", "avg_score": 0.85, "created_at": "2026-01-22"},
{"evaluation": "Eval Run 3", "avg_score": 0.89, "created_at": "2026-01-29"}
]
}
```
## Evaluation Group Context
In evaluation group dashboards, timeseries widgets have special behavior:
* **One line per metric**: Each metric in the query is plotted as a separate line on the chart
* **X-axis**: The evaluation creation date determines the position on the x-axis
* **Per-evaluation selection**: You can choose which evaluations to include per aggregation, allowing you to compare specific subsets
* **Auto-update**: When evaluations are added to or removed from the group, the timeseries automatically updates to reflect the new membership
### Example: Average Score Trend Across Evaluations
Track how average scores change across evaluation runs in a group.
```python Python theme={null}
widget = client.evaluation_dashboards.widgets.create(
dashboard_id=dashboard.id,
title="Average Score Trend",
type="timeseries",
query={
"select": [
{
"expression": {
"type": "AGGREGATION",
"function": "AVG",
"column": "overall_score",
"source": "data"
},
"alias": "avg_overall_score"
}
],
"evaluation_ids": ["eval-1", "eval-2", "eval-3"]
}
)
```
```json JSON theme={null}
{
"title": "Average Score Trend",
"type": "timeseries",
"query": {
"select": [
{
"expression": {
"type": "AGGREGATION",
"function": "AVG",
"column": "overall_score",
"source": "data"
},
"alias": "avg_overall_score"
}
],
"evaluation_ids": ["eval-1", "eval-2", "eval-3"]
}
}
```
***
### Example: Multi-Metric Comparison Over Time
Track multiple metrics across evaluations to see how different scores evolve.
```python Python theme={null}
widget = client.evaluation_dashboards.widgets.create(
dashboard_id=dashboard.id,
title="Score Metrics Over Time",
type="timeseries",
query={
"select": [
{
"expression": {
"type": "AGGREGATION",
"function": "AVG",
"column": "accuracy_score",
"source": "data"
},
"alias": "avg_accuracy"
},
{
"expression": {
"type": "AGGREGATION",
"function": "AVG",
"column": "relevance_score",
"source": "data"
},
"alias": "avg_relevance"
},
{
"expression": {
"type": "AGGREGATION",
"function": "AVG",
"column": "coherence_score",
"source": "data"
},
"alias": "avg_coherence"
}
],
"evaluation_ids": ["eval-1", "eval-2", "eval-3", "eval-4"]
}
)
```
```json JSON theme={null}
{
"title": "Score Metrics Over Time",
"type": "timeseries",
"query": {
"select": [
{
"expression": {"type": "AGGREGATION", "function": "AVG", "column": "accuracy_score", "source": "data"},
"alias": "avg_accuracy"
},
{
"expression": {"type": "AGGREGATION", "function": "AVG", "column": "relevance_score", "source": "data"},
"alias": "avg_relevance"
},
{
"expression": {"type": "AGGREGATION", "function": "AVG", "column": "coherence_score", "source": "data"},
"alias": "avg_coherence"
}
],
"evaluation_ids": ["eval-1", "eval-2", "eval-3", "eval-4"]
}
}
```
## Related Documentation
* [Evaluation Group Dashboards](../eval-group-dashboards) - Full guide on group dashboards
* [Bar Chart Widget](./bar) - For categorical comparisons
* [Metric Widget](./metric) - For single computed values
* [Query Language](../query-language) - Aggregation and filter syntax
* [API Reference](/reference/v5/evaluation-dashboards) - Programmatic chart creation