> ## Documentation Index
> Fetch the complete documentation index at: https://docs.gp.scale.com/llms.txt
> Use this file to discover all available pages before exploring further.
# Metric Widget
> Display single aggregation values like averages, counts, and percentiles
**Using Sample Data**: The examples on this page use fields from our sample dataset. Download it and create an evaluation with it to follow along with this tutorial.
 ## When to Use
Use metric widgets to:
* Display top-level aggregation values (e.g., "Average Model Score: 0.87")
* Show summary statistics (e.g., "Total Items: 1,247")
* Highlight key thresholds (e.g., "95th Percentile Latency: 234ms")
* Create metric cards for at-a-glance monitoring
* Track pass rates and percentages
## Configuration
### Required Fields
Widget display name shown on the dashboard
Must be set to "metric"
MetricQuery with exactly one aggregation function
### Query Requirements
Metric widgets require a **MetricQuery** with these constraints:
* Must have exactly one item in the `select` clause
* That item must be an `AGGREGATION` expression (not a raw column)
* Can optionally include `filter` conditions
* Cannot use `groupBy`, `orderBy`, or `limit`
## Creating in the UI
From your dashboard, click "Add Widget" and select "Query Value"
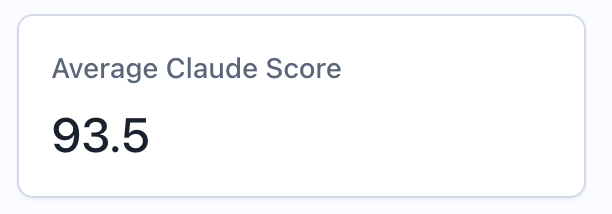
Give your metric a descriptive name (e.g., "Average Score")
## When to Use
Use metric widgets to:
* Display top-level aggregation values (e.g., "Average Model Score: 0.87")
* Show summary statistics (e.g., "Total Items: 1,247")
* Highlight key thresholds (e.g., "95th Percentile Latency: 234ms")
* Create metric cards for at-a-glance monitoring
* Track pass rates and percentages
## Configuration
### Required Fields
Widget display name shown on the dashboard
Must be set to "metric"
MetricQuery with exactly one aggregation function
### Query Requirements
Metric widgets require a **MetricQuery** with these constraints:
* Must have exactly one item in the `select` clause
* That item must be an `AGGREGATION` expression (not a raw column)
* Can optionally include `filter` conditions
* Cannot use `groupBy`, `orderBy`, or `limit`
## Creating in the UI
From your dashboard, click "Add Widget" and select "Query Value"
Give your metric a descriptive name (e.g., "Average Score")
 * **Column**: Select the field to aggregate
* **Aggregation**: Choose the function
* **Filter** (optional): Add conditions to narrow the data
Click "Add" to compute and display the result
## Output Format
Metric widgets return a single scalar value:
```json theme={null}
{
"type": "metric",
"data": 0.873
}
```
The `data` field contains the computed number, which can be:
* A decimal number (0.873)
* An integer (1247)
* A percentage (0.85 representing 85%)
## Example Use Cases
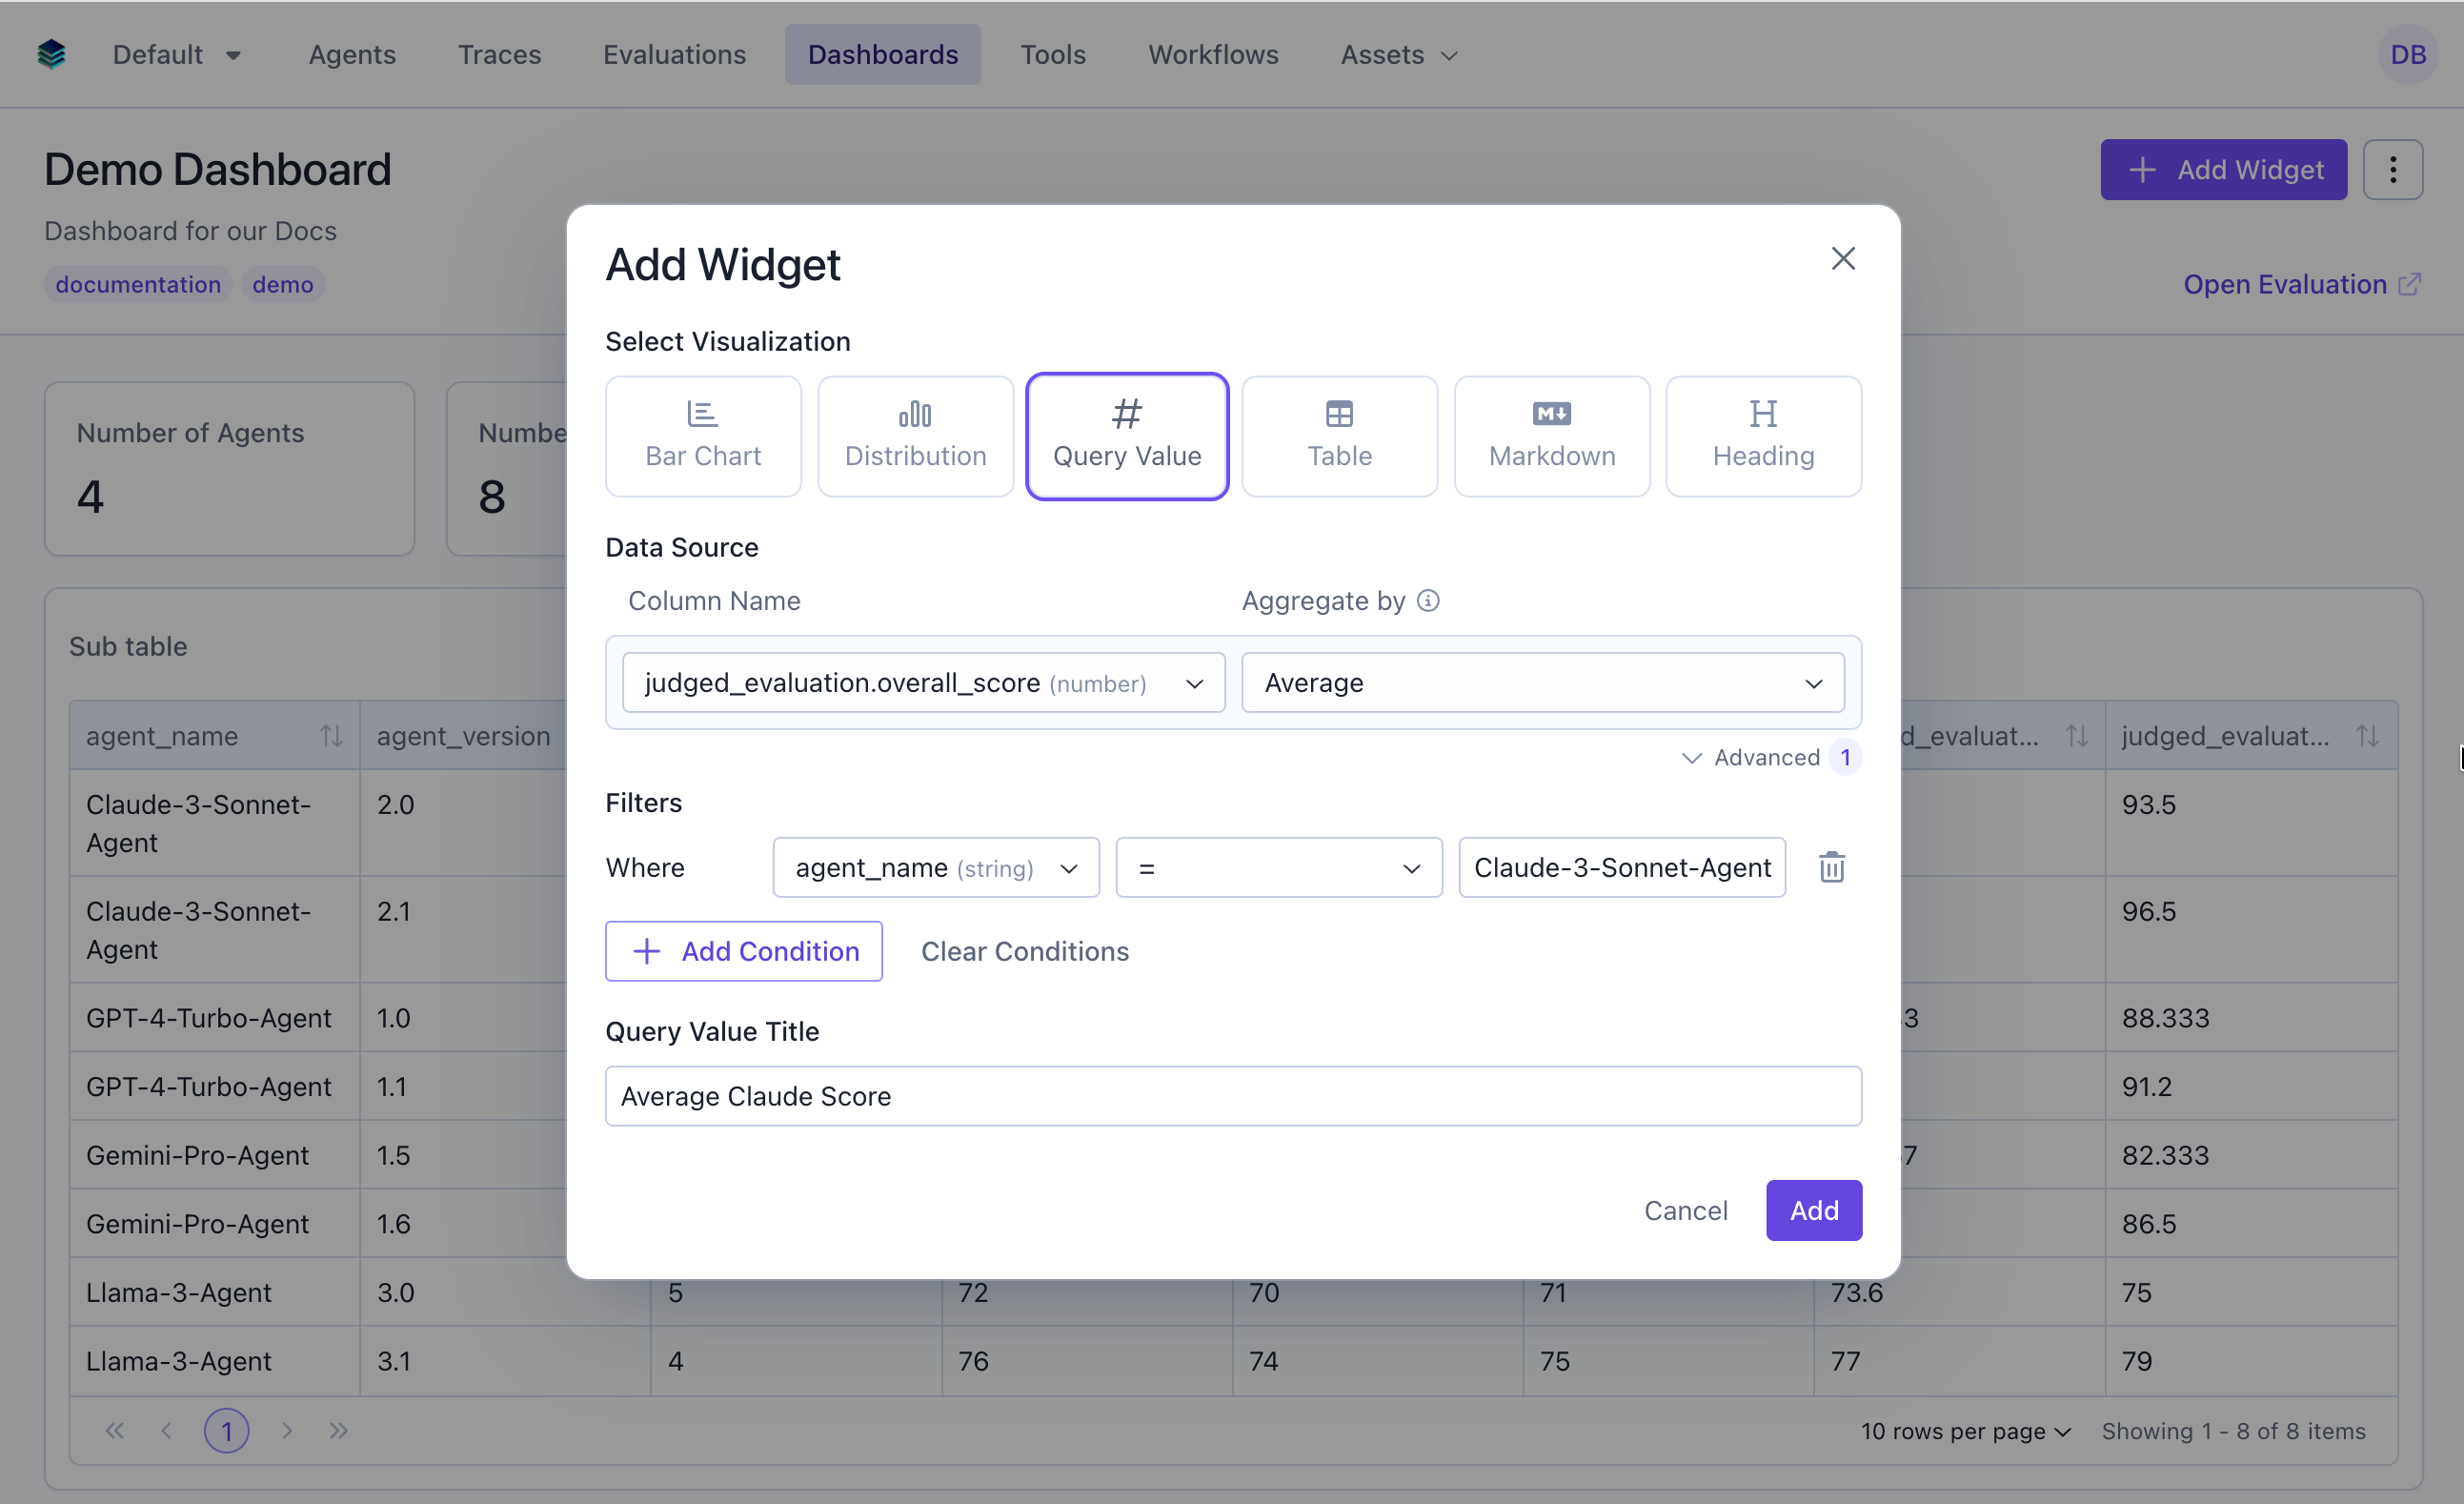
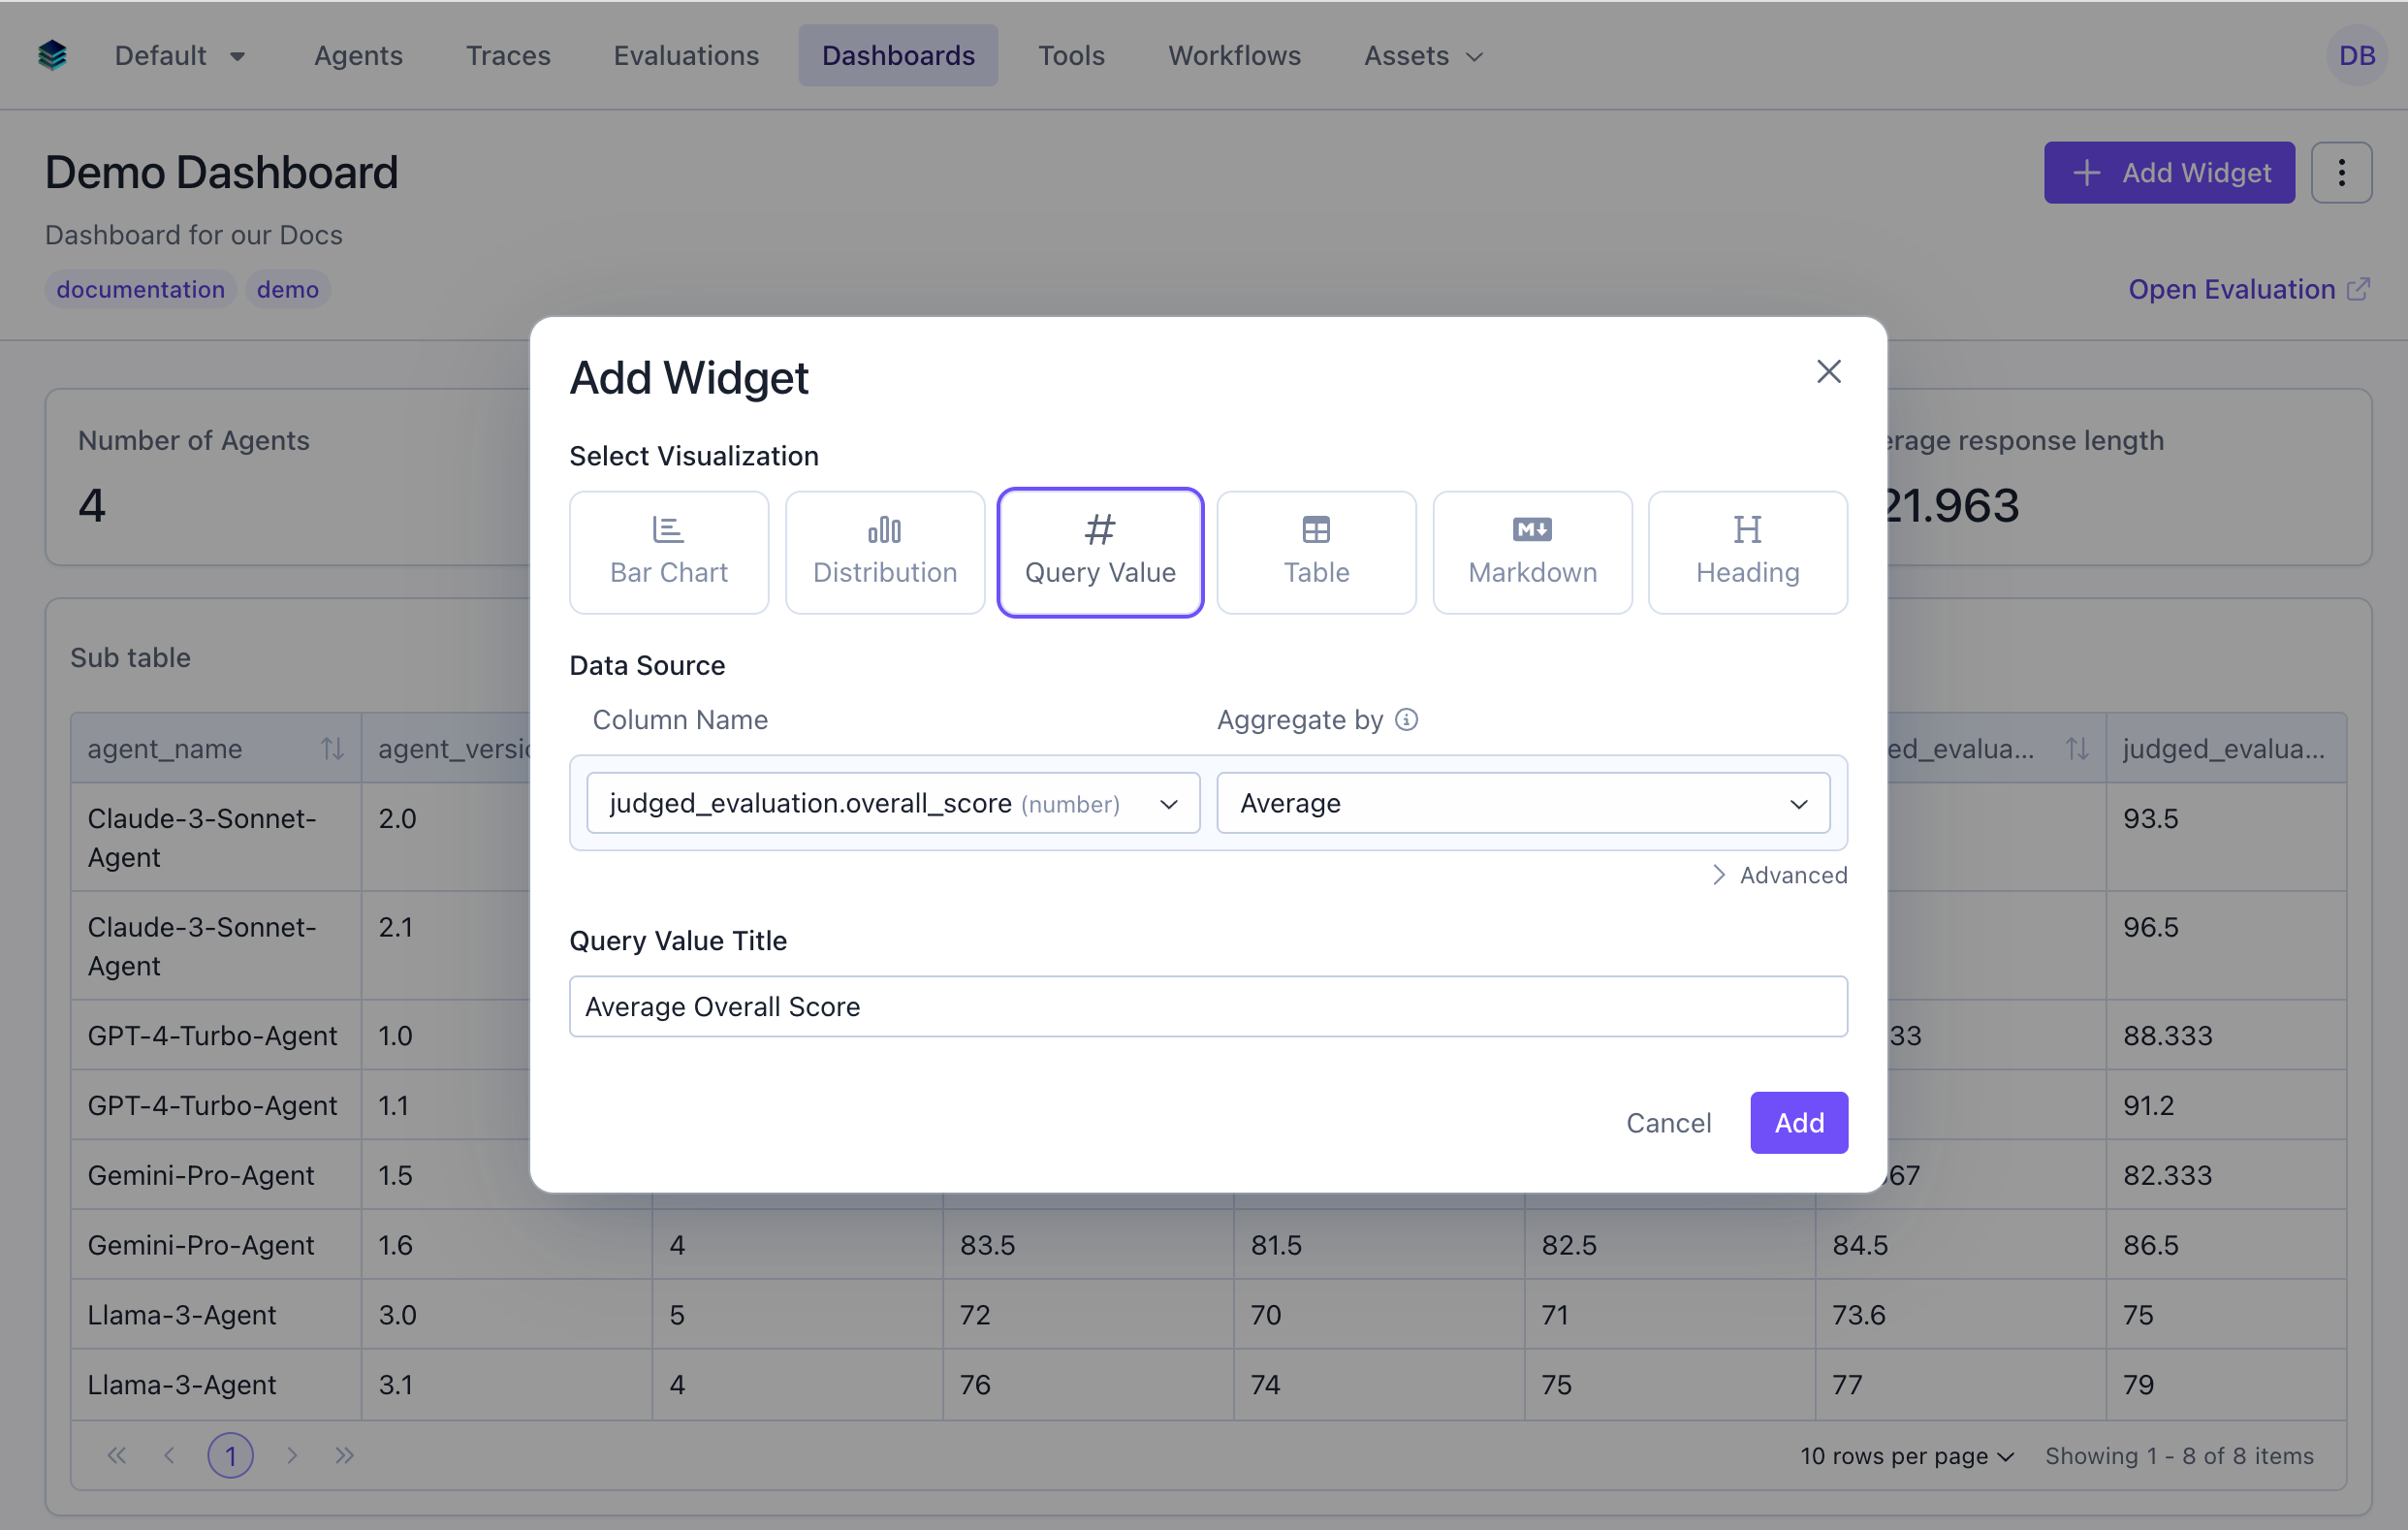
### Use Case 1: Average Overall Score
Display the mean overall score across all evaluation items.
* **Column**: Select the field to aggregate
* **Aggregation**: Choose the function
* **Filter** (optional): Add conditions to narrow the data
Click "Add" to compute and display the result
## Output Format
Metric widgets return a single scalar value:
```json theme={null}
{
"type": "metric",
"data": 0.873
}
```
The `data` field contains the computed number, which can be:
* A decimal number (0.873)
* An integer (1247)
* A percentage (0.85 representing 85%)
## Example Use Cases
### Use Case 1: Average Overall Score
Display the mean overall score across all evaluation items.
 ```python Python theme={null}
widget = client.evaluation_dashboards.widgets.create(
dashboard_id=dashboard.id,
title="Average Overall Score",
type="metric",
query={
"select": [
{
"expression": {
"type": "AGGREGATION",
"function": "AVG",
"column": "overall_score",
"source": "data"
}
}
]
}
)
```
```json JSON theme={null}
{
"title": "Average Overall Score",
"type": "metric",
"query": {
"select": [
{
"expression": {
"type": "AGGREGATION",
"function": "AVG",
"column": "overall_score",
"source": "data"
}
}
]
}
}
```
***
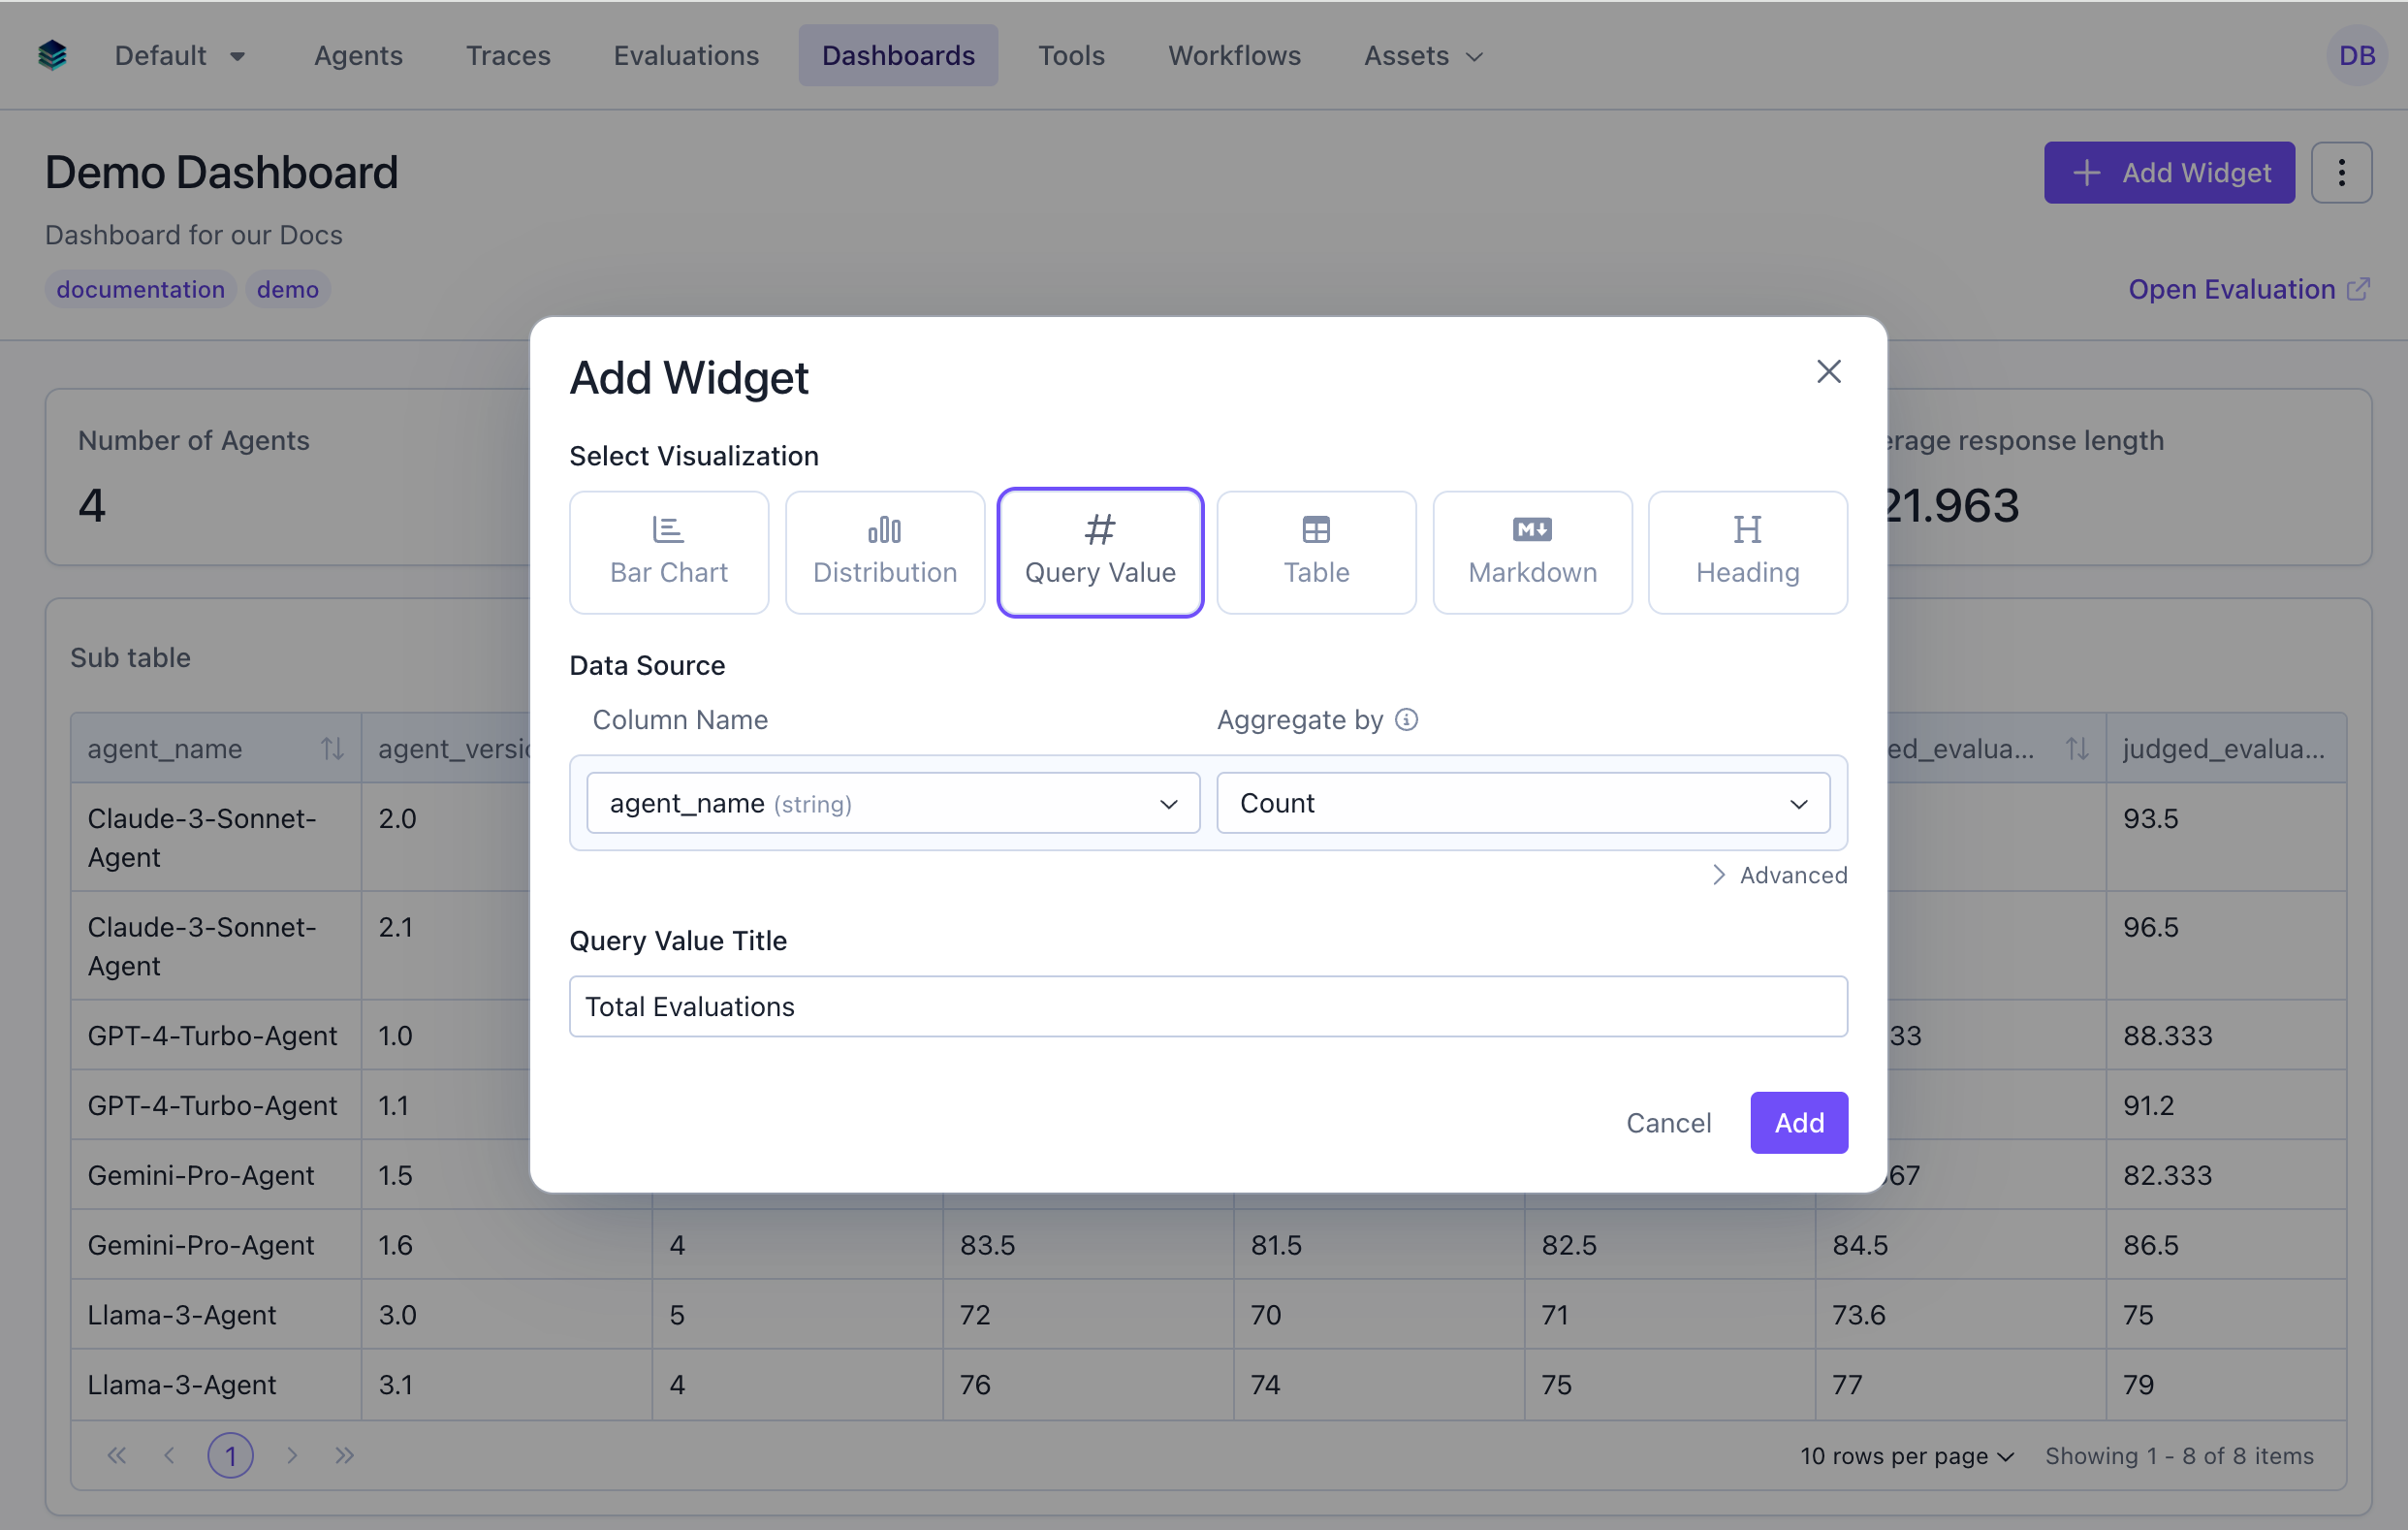
### Use Case 2: Total Evaluation Count
Show how many evaluation items are in the dataset.
```python Python theme={null}
widget = client.evaluation_dashboards.widgets.create(
dashboard_id=dashboard.id,
title="Average Overall Score",
type="metric",
query={
"select": [
{
"expression": {
"type": "AGGREGATION",
"function": "AVG",
"column": "overall_score",
"source": "data"
}
}
]
}
)
```
```json JSON theme={null}
{
"title": "Average Overall Score",
"type": "metric",
"query": {
"select": [
{
"expression": {
"type": "AGGREGATION",
"function": "AVG",
"column": "overall_score",
"source": "data"
}
}
]
}
}
```
***
### Use Case 2: Total Evaluation Count
Show how many evaluation items are in the dataset.
 ```python Python theme={null}
widget = client.evaluation_dashboards.widgets.create(
dashboard_id=dashboard.id,
title="Total Evaluations",
type="metric",
query={
"select": [
{
"expression": {
"type": "AGGREGATION",
"function": "COUNT",
"column": "*"
}
}
]
}
)
```
```json JSON theme={null}
{
"title": "Total Evaluations",
"type": "metric",
"query": {
"select": [
{
"expression": {
"type": "AGGREGATION",
"function": "COUNT",
"column": "*"
}
}
]
}
}
```
***
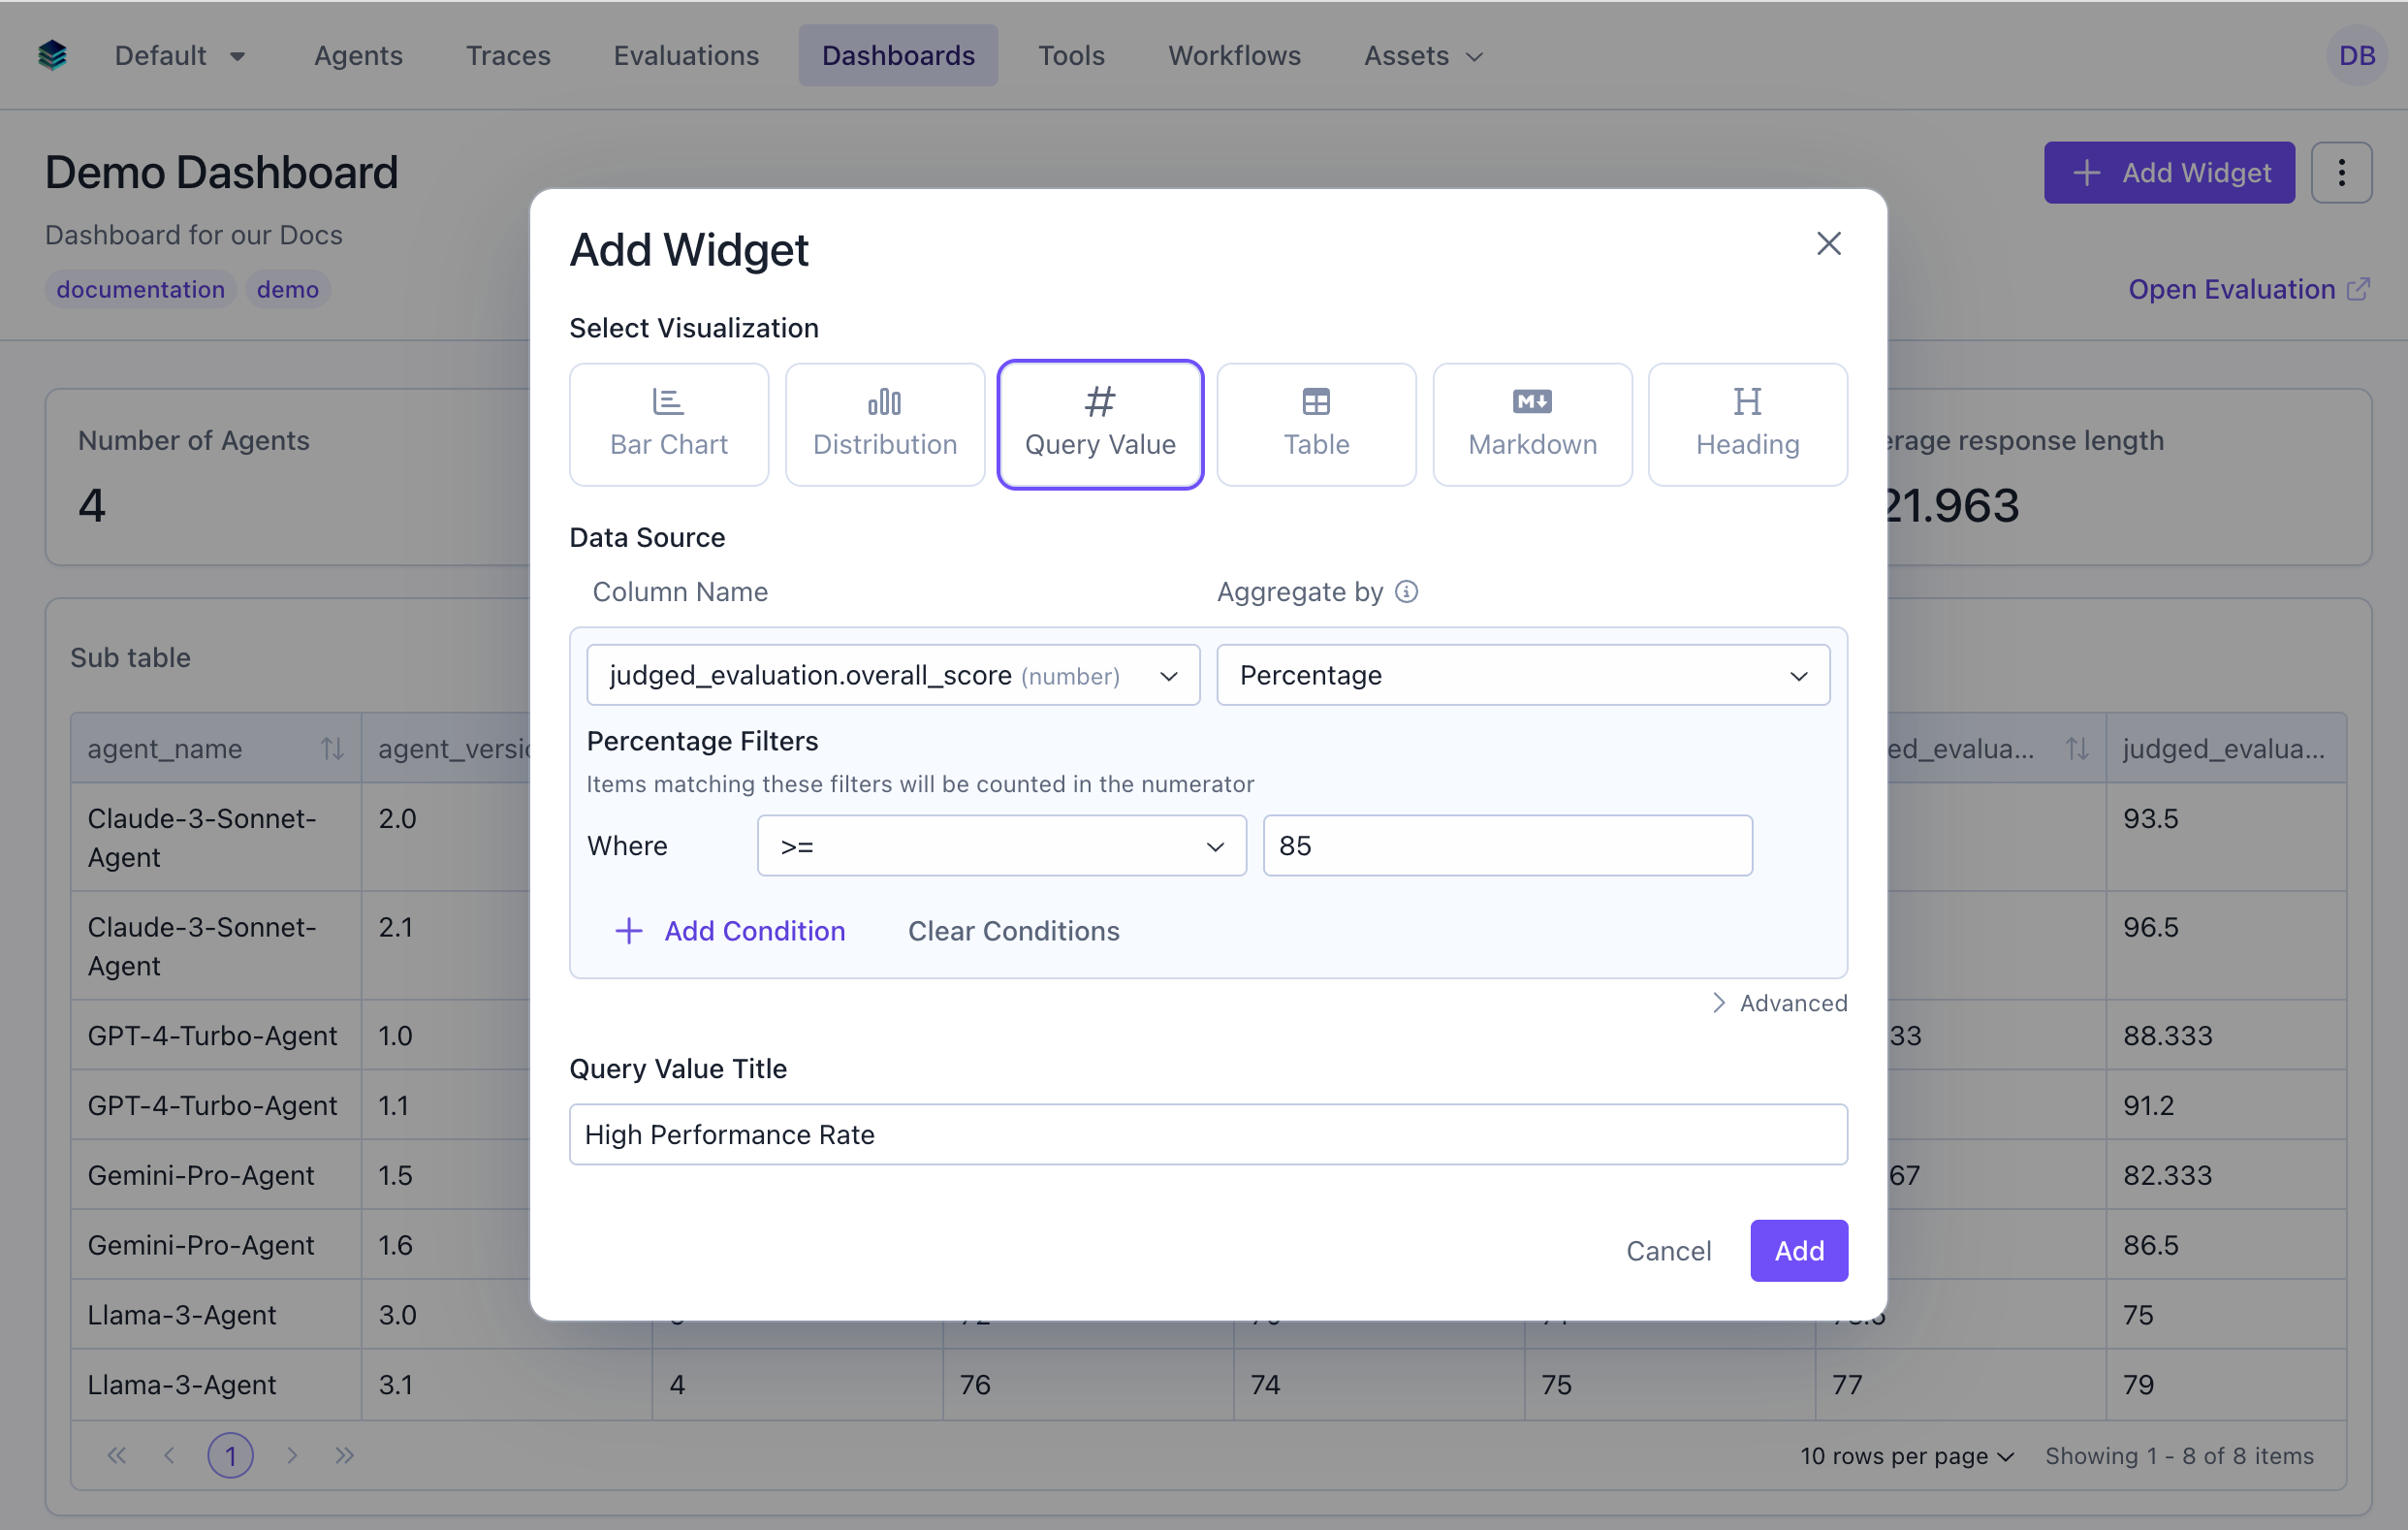
### Use Case 3: High Performance Rate
Calculate percentage of evaluations scoring 85 or above.
```python Python theme={null}
widget = client.evaluation_dashboards.widgets.create(
dashboard_id=dashboard.id,
title="Total Evaluations",
type="metric",
query={
"select": [
{
"expression": {
"type": "AGGREGATION",
"function": "COUNT",
"column": "*"
}
}
]
}
)
```
```json JSON theme={null}
{
"title": "Total Evaluations",
"type": "metric",
"query": {
"select": [
{
"expression": {
"type": "AGGREGATION",
"function": "COUNT",
"column": "*"
}
}
]
}
}
```
***
### Use Case 3: High Performance Rate
Calculate percentage of evaluations scoring 85 or above.
 ```python Python theme={null}
widget = client.evaluation_dashboards.widgets.create(
dashboard_id=dashboard.id,
title="High Performance Rate",
type="metric",
query={
"select": [
{
"expression": {
"type": "AGGREGATION",
"function": "PERCENTAGE",
"column": "overall_score",
"params": {
"percentage_filters": {
"conditions": [
{
"column": "overall_score",
"source": "data",
"operator": ">=",
"value": 85
}
]
}
}
}
}
]
}
)
```
```json JSON theme={null}
{
"title": "High Performance Rate",
"type": "metric",
"query": {
"select": [
{
"expression": {
"type": "AGGREGATION",
"function": "PERCENTAGE",
"column": "overall_score",
"params": {
"percentage_filters": {
"conditions": [
{
"column": "overall_score",
"source": "data",
"operator": ">=",
"value": 85
}
]
}
}
}
}
]
}
}
```
***
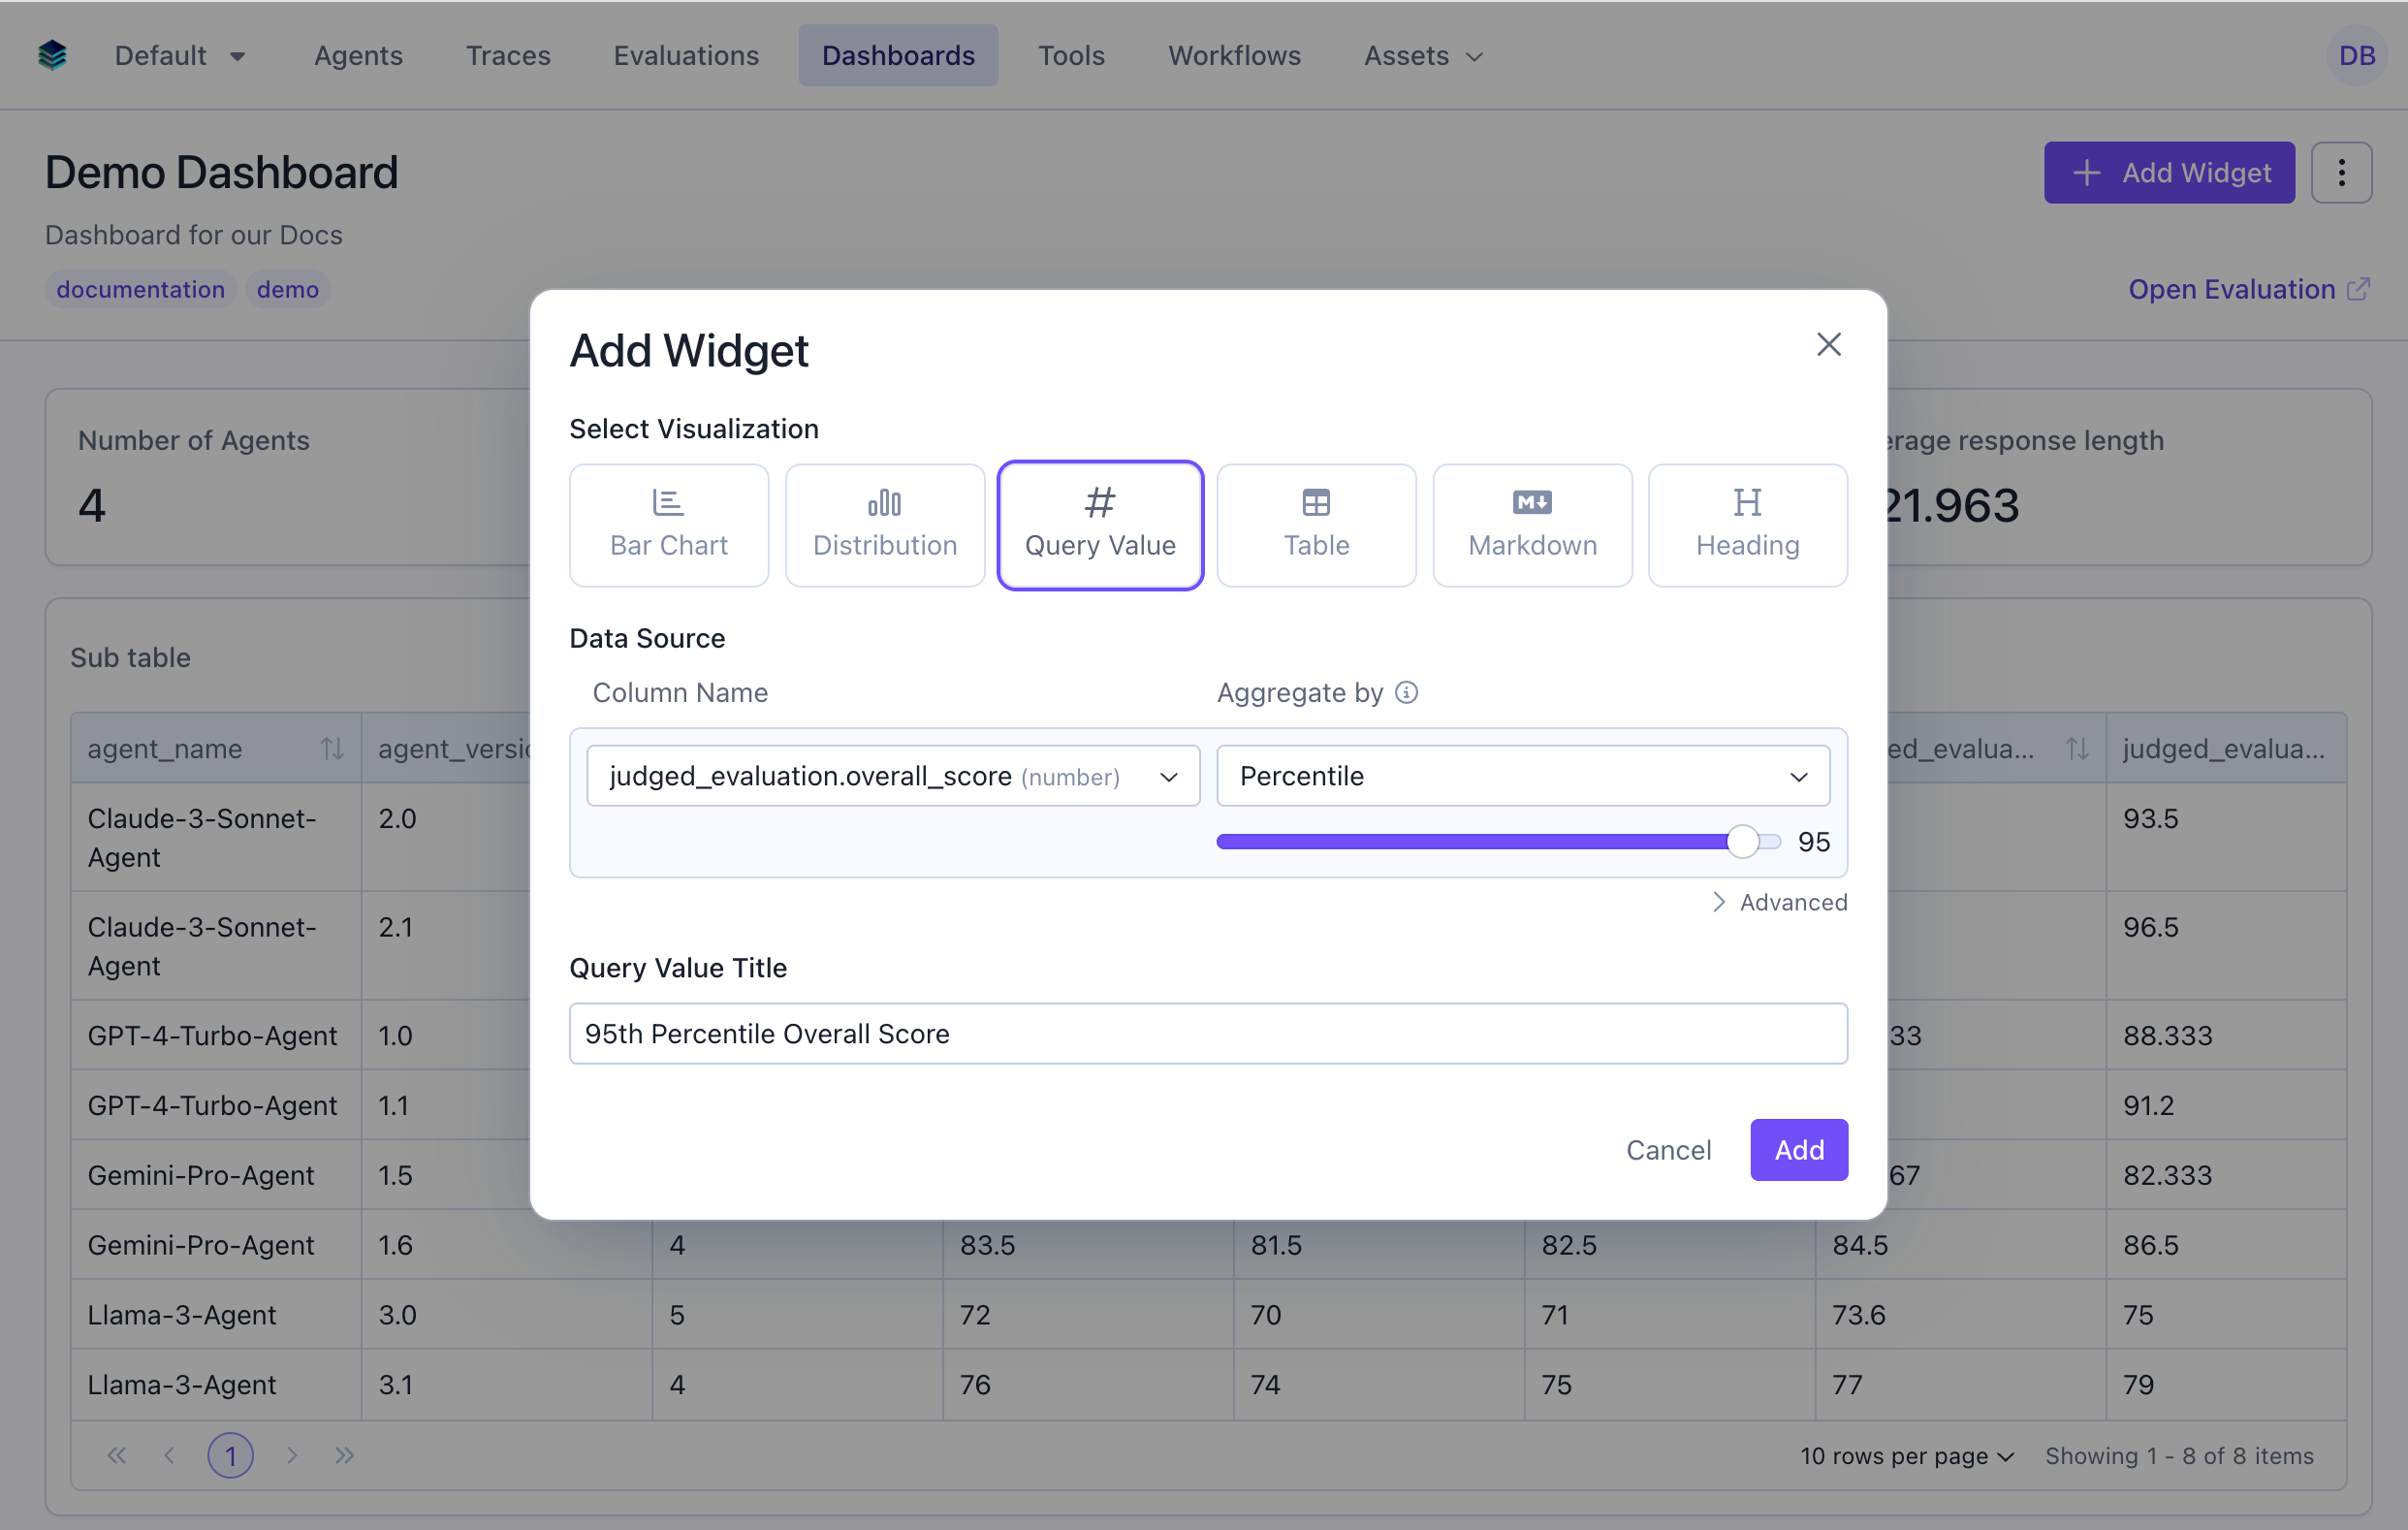
### Use Case 4: 95th Percentile Overall Score
Show the 95th percentile to understand top-end performance.
```python Python theme={null}
widget = client.evaluation_dashboards.widgets.create(
dashboard_id=dashboard.id,
title="High Performance Rate",
type="metric",
query={
"select": [
{
"expression": {
"type": "AGGREGATION",
"function": "PERCENTAGE",
"column": "overall_score",
"params": {
"percentage_filters": {
"conditions": [
{
"column": "overall_score",
"source": "data",
"operator": ">=",
"value": 85
}
]
}
}
}
}
]
}
)
```
```json JSON theme={null}
{
"title": "High Performance Rate",
"type": "metric",
"query": {
"select": [
{
"expression": {
"type": "AGGREGATION",
"function": "PERCENTAGE",
"column": "overall_score",
"params": {
"percentage_filters": {
"conditions": [
{
"column": "overall_score",
"source": "data",
"operator": ">=",
"value": 85
}
]
}
}
}
}
]
}
}
```
***
### Use Case 4: 95th Percentile Overall Score
Show the 95th percentile to understand top-end performance.
 ```python Python theme={null}
widget = client.evaluation_dashboards.widgets.create(
dashboard_id=dashboard.id,
title="95th Percentile Overall Score",
type="metric",
query={
"select": [
{
"expression": {
"type": "AGGREGATION",
"function": "PERCENTILE",
"column": "overall_score",
"source": "data",
"params": {
"percentile": 95
}
}
}
]
}
)
```
```json JSON theme={null}
{
"title": "95th Percentile Overall Score",
"type": "metric",
"query": {
"select": [
{
"expression": {
"type": "AGGREGATION",
"function": "PERCENTILE",
"column": "overall_score",
"source": "data",
"params": {
"percentile": 95
}
}
}
]
}
}
```
***
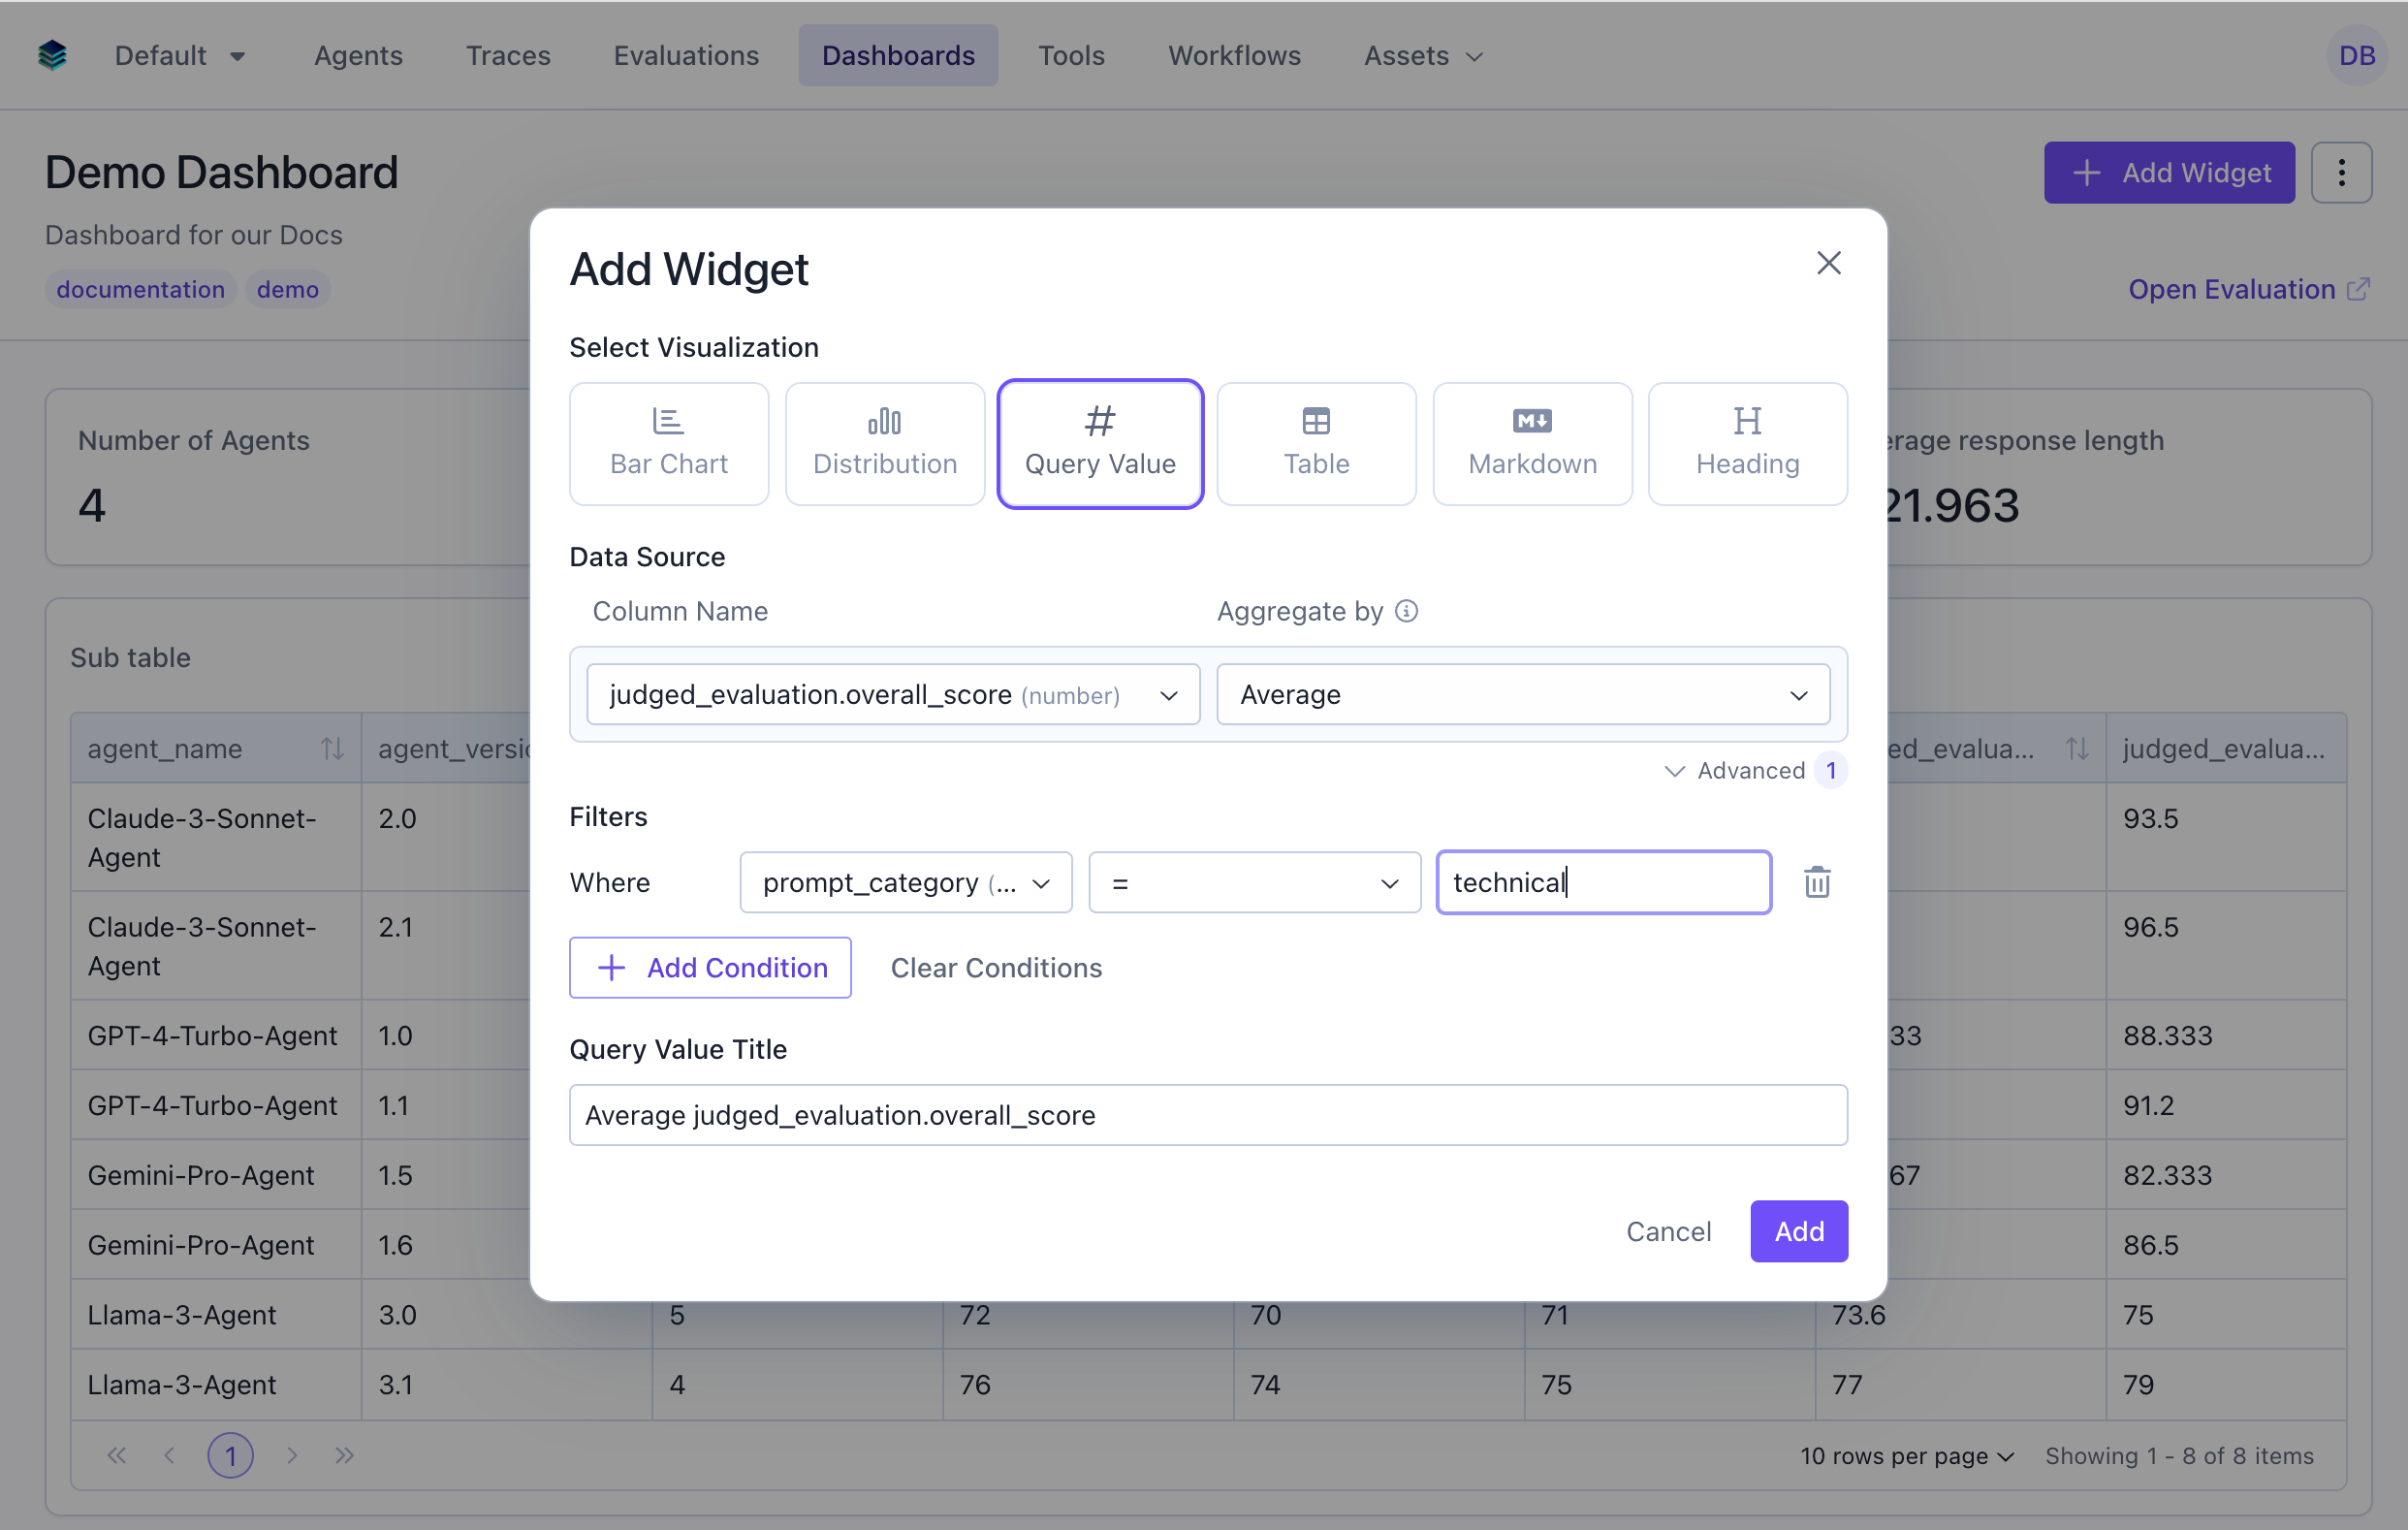
### Use Case 5: Average Score for Technical Tasks
Calculate average score for only technical task types.
```python Python theme={null}
widget = client.evaluation_dashboards.widgets.create(
dashboard_id=dashboard.id,
title="95th Percentile Overall Score",
type="metric",
query={
"select": [
{
"expression": {
"type": "AGGREGATION",
"function": "PERCENTILE",
"column": "overall_score",
"source": "data",
"params": {
"percentile": 95
}
}
}
]
}
)
```
```json JSON theme={null}
{
"title": "95th Percentile Overall Score",
"type": "metric",
"query": {
"select": [
{
"expression": {
"type": "AGGREGATION",
"function": "PERCENTILE",
"column": "overall_score",
"source": "data",
"params": {
"percentile": 95
}
}
}
]
}
}
```
***
### Use Case 5: Average Score for Technical Tasks
Calculate average score for only technical task types.
 ```python Python theme={null}
widget = client.evaluation_dashboards.widgets.create(
dashboard_id=dashboard.id,
title="Technical Tasks Avg Score",
type="metric",
query={
"select": [
{
"expression": {
"type": "AGGREGATION",
"function": "AVG",
"column": "overall_score",
"source": "data"
}
}
],
"filter": {
"conditions": [
{
"column": "prompt_category",
"source": "data",
"operator": "=",
"value": "technical"
}
]
}
}
)
```
```json JSON theme={null}
{
"title": "Technical Tasks Avg Score",
"type": "metric",
"query": {
"select": [
{
"expression": {
"type": "AGGREGATION",
"function": "AVG",
"column": "overall_score",
"source": "data"
}
}
],
"filter": {
"conditions": [
{
"column": "prompt_category",
"source": "data",
"operator": "=",
"value": "technical"
}
]
}
}
}
```
## Related Documentation
* [Query Language Reference](../query-language) - Full query syntax guide
* [All Widget Types](./overview) - Compare different widget types
* [Table Widget](./table) - For multi-row displays
* [API Reference](/reference/v5/evaluation-dashboards) - Explore programmatic widget creation
```python Python theme={null}
widget = client.evaluation_dashboards.widgets.create(
dashboard_id=dashboard.id,
title="Technical Tasks Avg Score",
type="metric",
query={
"select": [
{
"expression": {
"type": "AGGREGATION",
"function": "AVG",
"column": "overall_score",
"source": "data"
}
}
],
"filter": {
"conditions": [
{
"column": "prompt_category",
"source": "data",
"operator": "=",
"value": "technical"
}
]
}
}
)
```
```json JSON theme={null}
{
"title": "Technical Tasks Avg Score",
"type": "metric",
"query": {
"select": [
{
"expression": {
"type": "AGGREGATION",
"function": "AVG",
"column": "overall_score",
"source": "data"
}
}
],
"filter": {
"conditions": [
{
"column": "prompt_category",
"source": "data",
"operator": "=",
"value": "technical"
}
]
}
}
}
```
## Related Documentation
* [Query Language Reference](../query-language) - Full query syntax guide
* [All Widget Types](./overview) - Compare different widget types
* [Table Widget](./table) - For multi-row displays
* [API Reference](/reference/v5/evaluation-dashboards) - Explore programmatic widget creation