> ## Documentation Index
> Fetch the complete documentation index at: https://docs.gp.scale.com/llms.txt
> Use this file to discover all available pages before exploring further.
# Getting Started with Dashboards
> Step-by-step tutorial for creating your first evaluation dashboard
This guide walks you through creating your first evaluation dashboard from scratch, adding widgets, and organizing your layout. You can also watch the [single evaluation dashboard demo video](./overview#single-evaluation-dashboard) for a visual walkthrough.
## Using Sample Data
To follow along with this tutorial, you can use our sample evaluation dataset containing 40 agent evaluation items with realistic scores and metadata.
Upload the sample data to your account and create an evaluation with it.
**Download Sample Data:**
Sample dataset with 40 evaluation items across 4 agents (GPT-4, Claude-3, Gemini-Pro, Llama-3)
**Data Structure:**
The sample data contains evaluation items with this structure:
```json theme={null}
{
"id": "eval_001",
"agent_name": "GPT-4-Turbo-Agent",
"agent_version": "1.0",
"judged_evaluation": {
"overall_score": 87,
"accuracy_score": 92,
"relevance_score": 85,
"coherence_score": 89,
"helpfulness_score": 84,
"fluency_score": 91
},
"timestamp": "2026-01-15T10:30:00Z",
"task_type": "question_answering",
"prompt_category": "technical",
"response_length": 256,
"model_temperature": 0.7
}
```
**Key Fields:**
* `agent_name`: Model being evaluated (GPT-4-Turbo-Agent, Claude-3-Sonnet-Agent, etc.)
* `*`: Nested scores (overall\_score, accuracy\_score, relevance\_score, coherence\_score, helpfulness\_score, fluency\_score)
* `task_type`: Type of task (question\_answering, summarization, code\_generation, analysis, translation, creative\_writing)
* `prompt_category`: Category (technical, general, business, language, creative)
**How to Use:**
1. Download the CSV file
2. Create a new evaluation via the API or SDK:
```python theme={null}
from scale_gp_beta import SGPClient
import csv
# Using api.dev-sgp.scale.com
client = SGPClient(
api_key="your-api-key",
account_id="your-account-id",
environment="development"
)
# Load sample data
with open('sample-evaluation.csv', 'r') as f:
sample_items = csv.reader(f)
# Create evaluation with sample data
evaluation = client.evaluations.create(
name="Agent Performance Comparison",
data=sample_items
)
print(f"Created evaluation: {evaluation.id}")
```
The client uses the `environment` parameter to connect to different Scale GP deployments. Available options: `"production"`, `"production-multitenant"`, `"development"`, `"staging"`, `"local"`. For custom endpoints, use `base_url` instead.
3. Follow the rest of this guide to create dashboards and widgets using this evaluation
The examples throughout this guide reference fields from this sample dataset. If using your own data, adjust the column names accordingly.
## Prerequisites
Before creating a dashboard, you need either:
* An existing evaluation with completed results, OR
* An evaluation group containing evaluations
If you don't have an evaluation yet, see [Next Gen Evaluation Getting Started](../next-gen-evaluation/getting-started) to create one.
## Step 1: Create a New Dashboard
### Via the UI
1. Navigate your version of SGP ([Dev SGP](https://app.dev-sgp.scale.com/))
2. Make sure the `evaluation-dashboards-enabled` feature flag is enabled for your account
1. ([Instructions to enable the feature flag](https://scale.atlassian.net/wiki/x/C4EgLw))
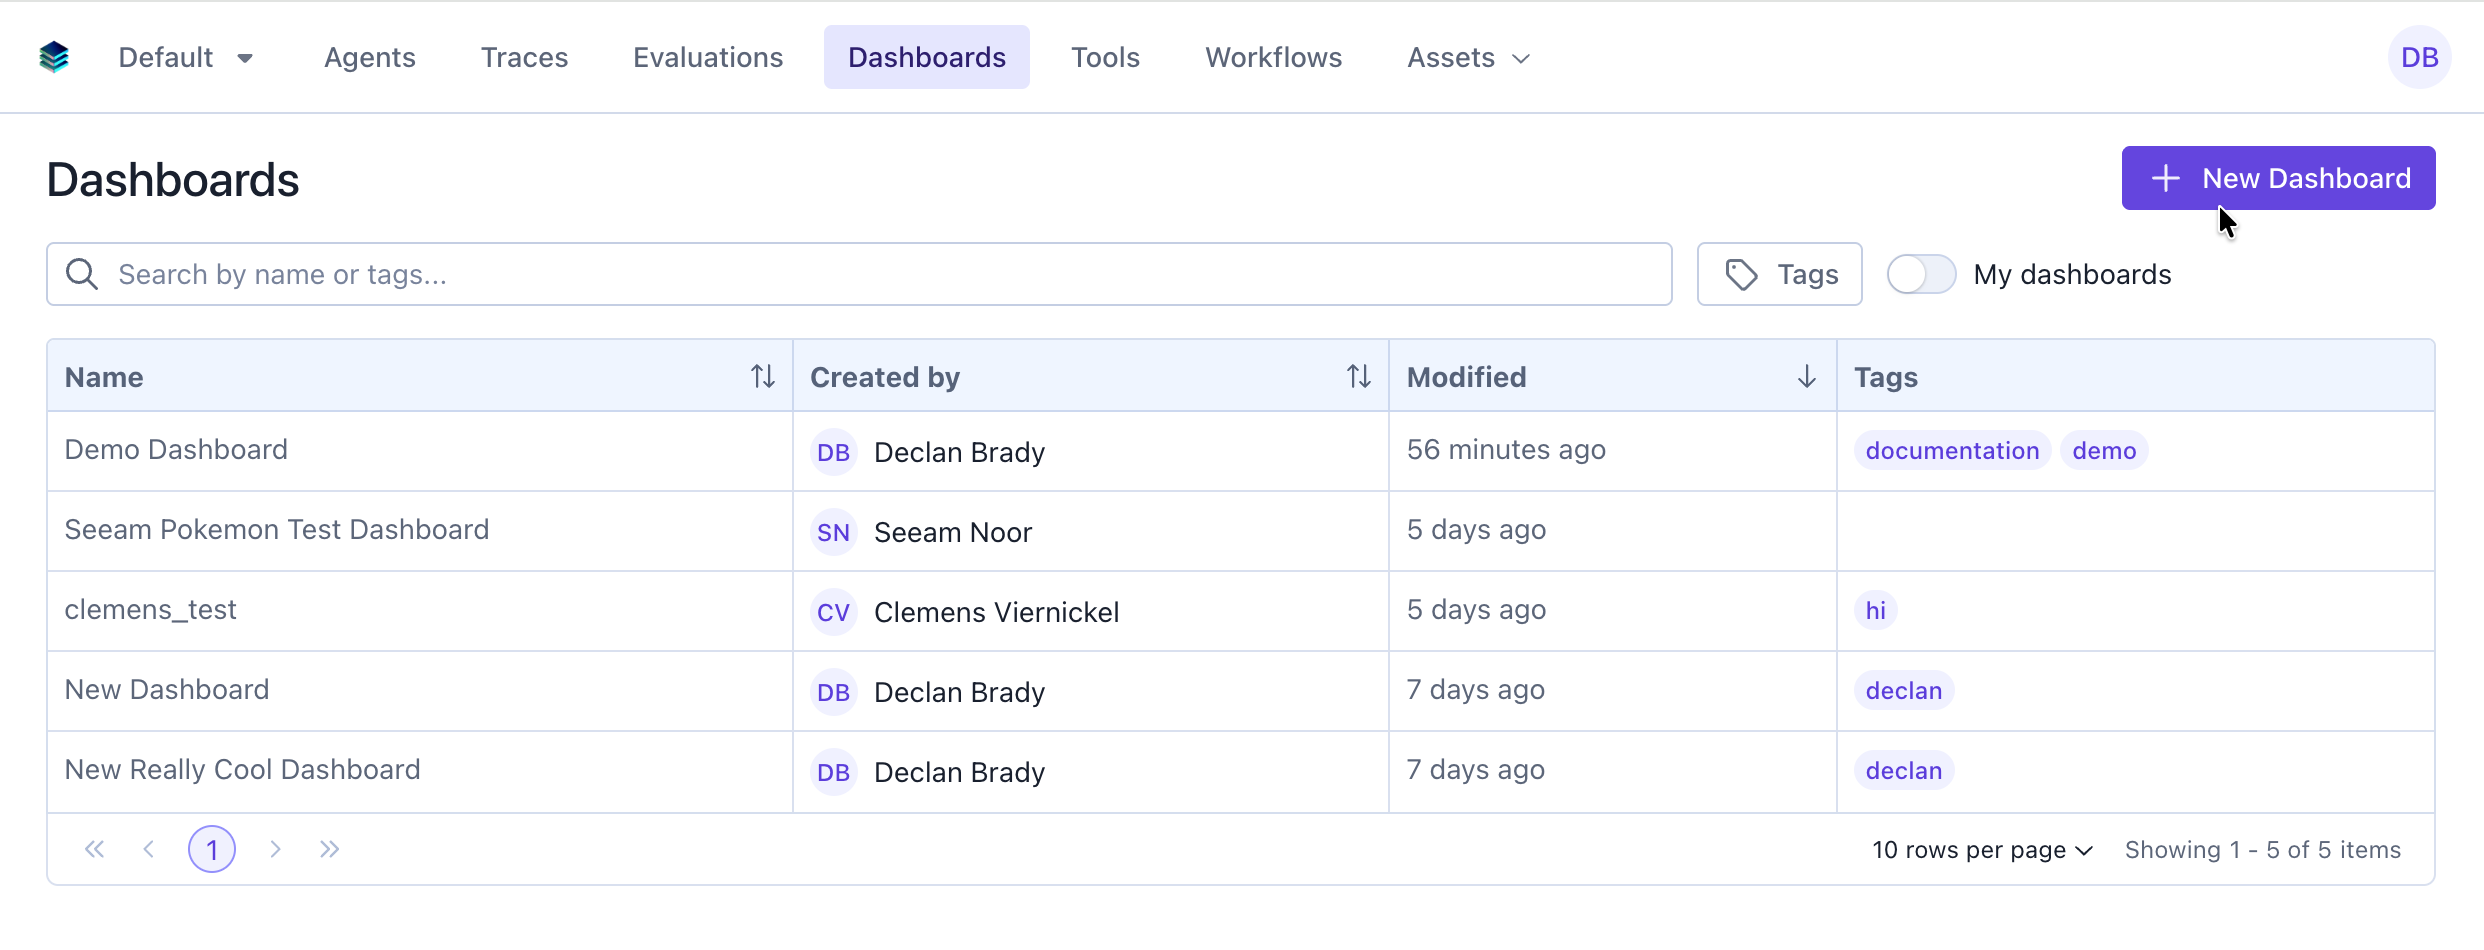
3. Click the "Dashboards" tab
4. Click the "New Dashboard" button
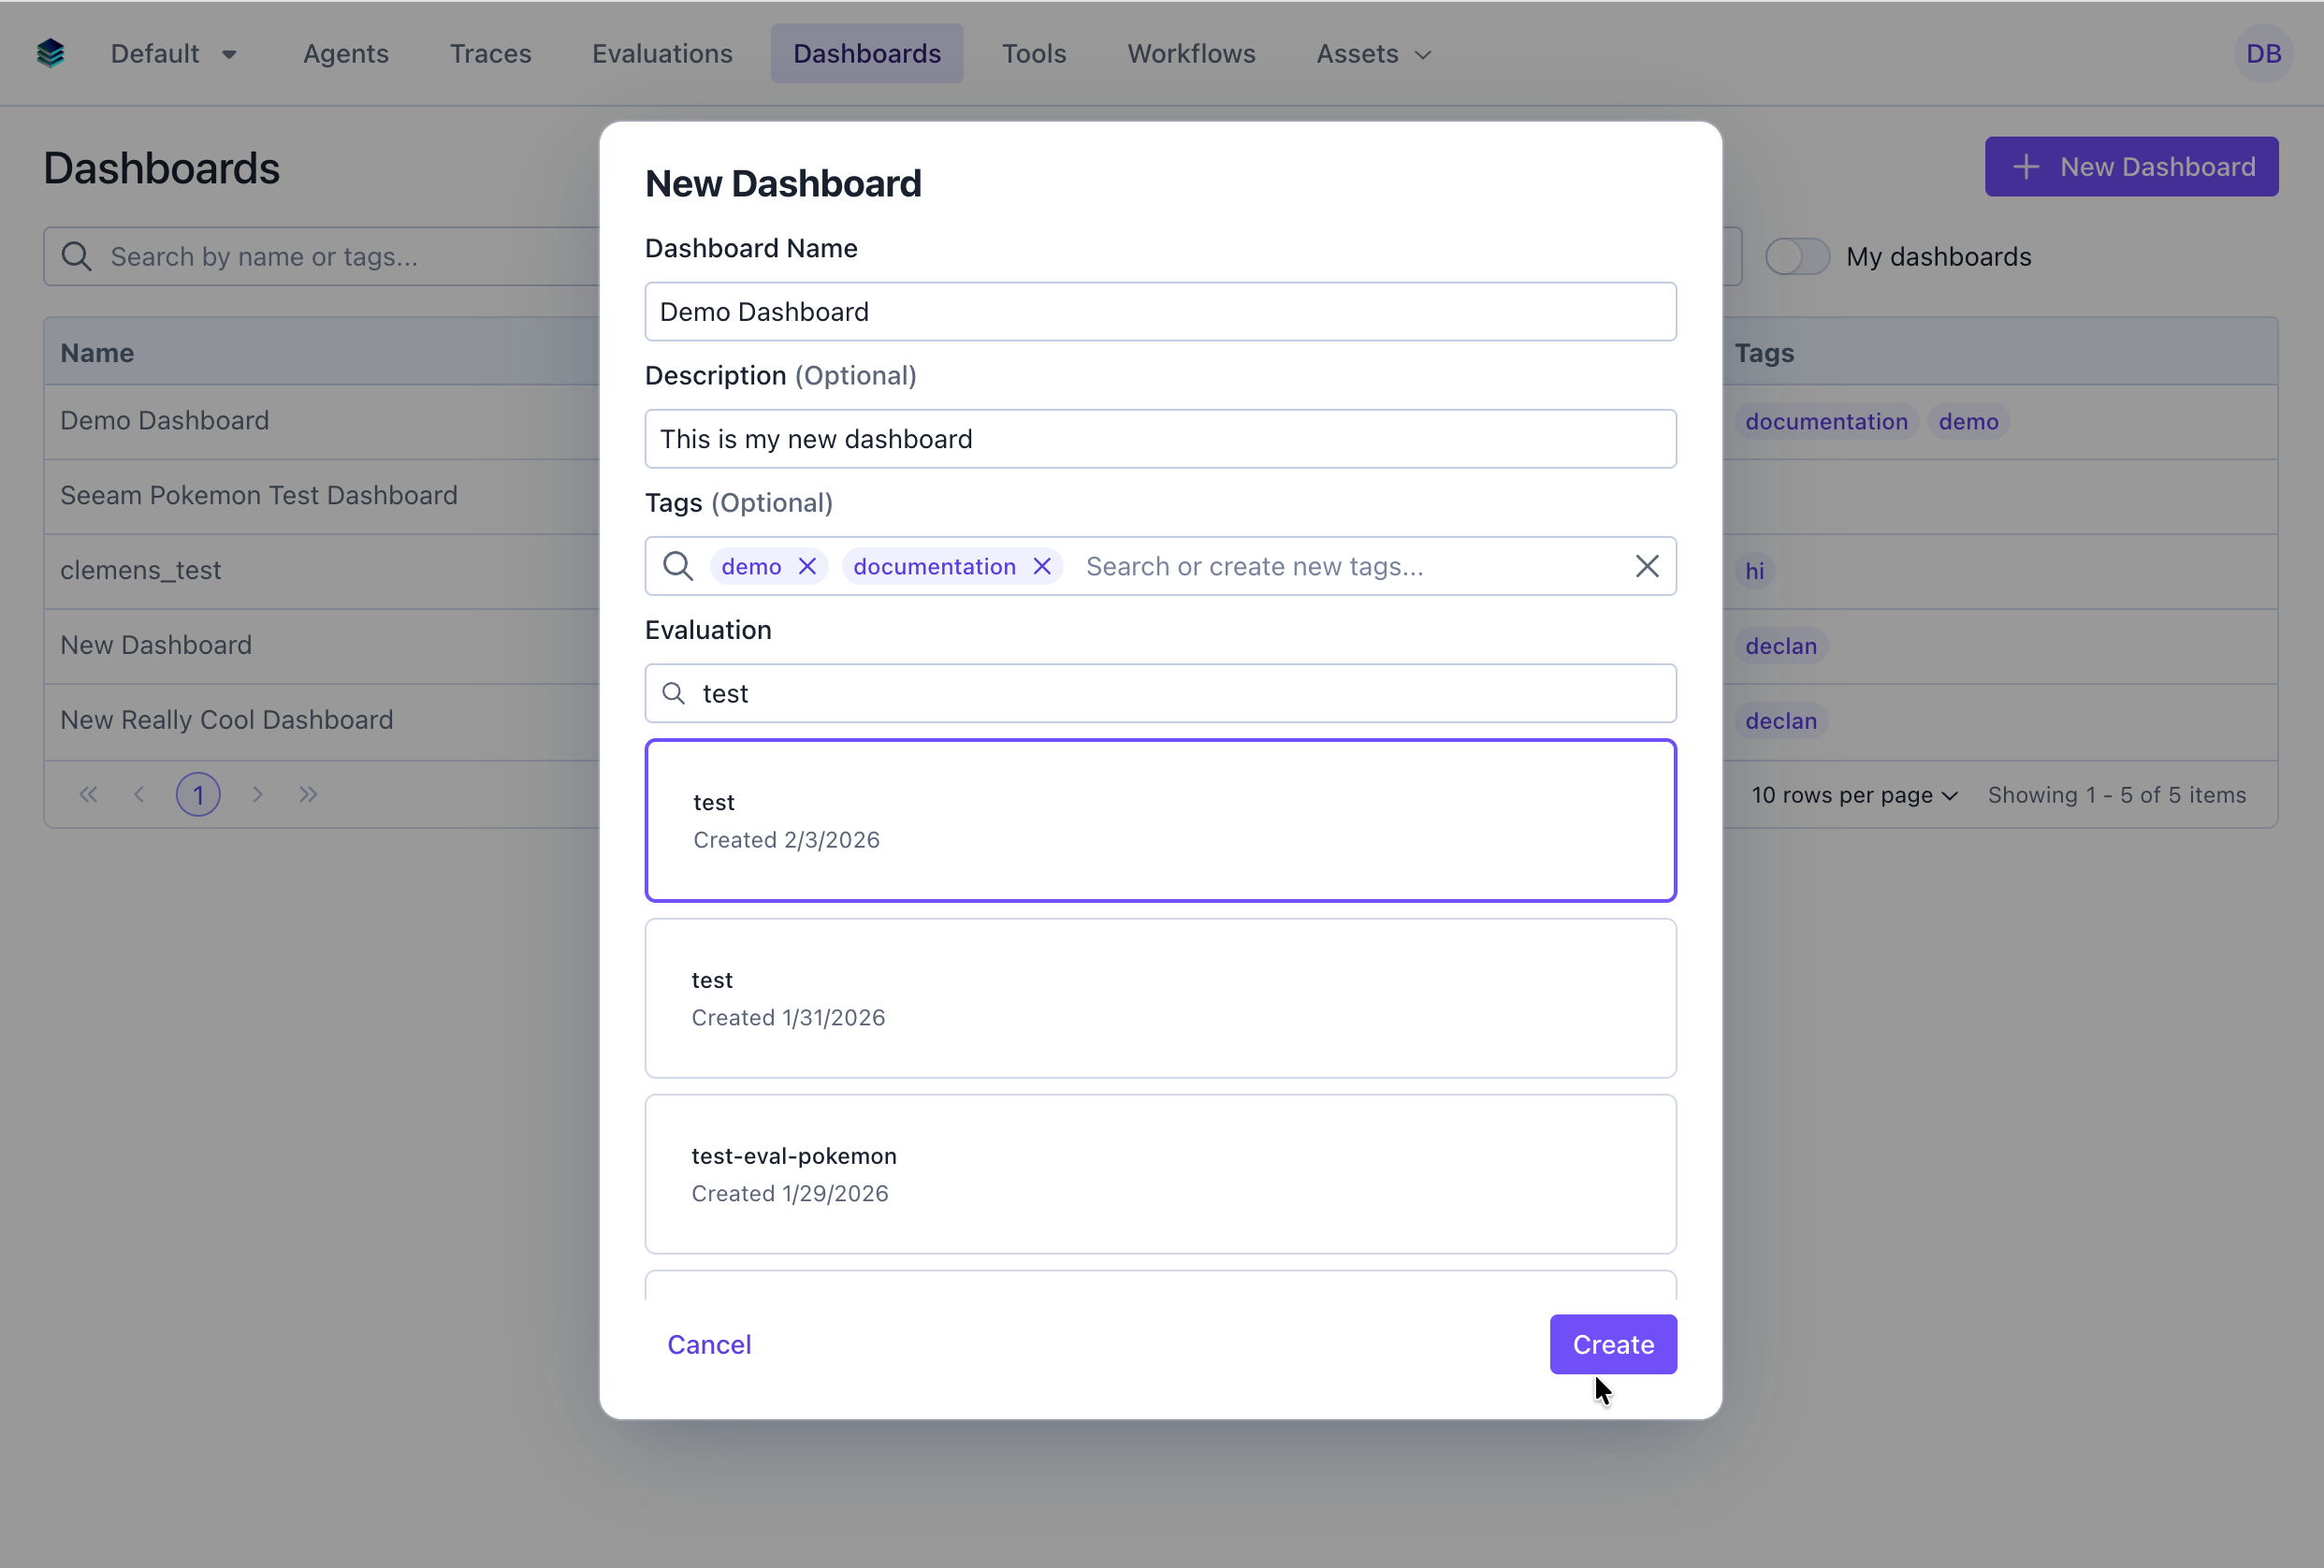
 5. Fill in the dashboard details:
* **Name**: Give your dashboard a descriptive name (e.g., "Model Performance Overview")
* **Description**: Optional description explaining the dashboard's purpose
* **Tags**: Optional tags for organization and filtering
* **Evaluation / Evaluation Group**: Select the evaluation or evaluation group you want to create a dashboard for
* **Template** *(optional)*: Select an existing single-evaluation dashboard to copy its widget layout
6. Click "Create" to save your dashboard
5. Fill in the dashboard details:
* **Name**: Give your dashboard a descriptive name (e.g., "Model Performance Overview")
* **Description**: Optional description explaining the dashboard's purpose
* **Tags**: Optional tags for organization and filtering
* **Evaluation / Evaluation Group**: Select the evaluation or evaluation group you want to create a dashboard for
* **Template** *(optional)*: Select an existing single-evaluation dashboard to copy its widget layout
6. Click "Create" to save your dashboard
 ### Via the SDK
```python theme={null}
from scale_gp_beta import SGPClient
client = SGPClient(
api_key="your-api-key",
account_id="your-account-id",
environment="development"
)
# Create dashboard for a single evaluation
dashboard = client.evaluation_dashboards.create(
name="Demo Dashboard",
description="A demo dashboard for the demo evaluation",
evaluation_id="eval-123",
tags=["demo", "documentation"]
)
# Create dashboard from an existing template (single-evaluation dashboards only)
dashboard_from_template = client.evaluation_dashboards.create(
name="Q2 Model Performance",
evaluation_id="eval-456",
template_dashboard_id="dash-template-abc" # Copies widget layout from this dashboard
)
# Or create dashboard for an evaluation group
group_dashboard = client.evaluation_dashboards.create(
name="Cross-Evaluation Comparison",
evaluation_group_id="eval-group-456",
tags=["comparison"]
)
```
## Step 2: Add Your First Widget (Metric)
Let's add a metric widget to display the average score across all evaluation items.
### Via the UI
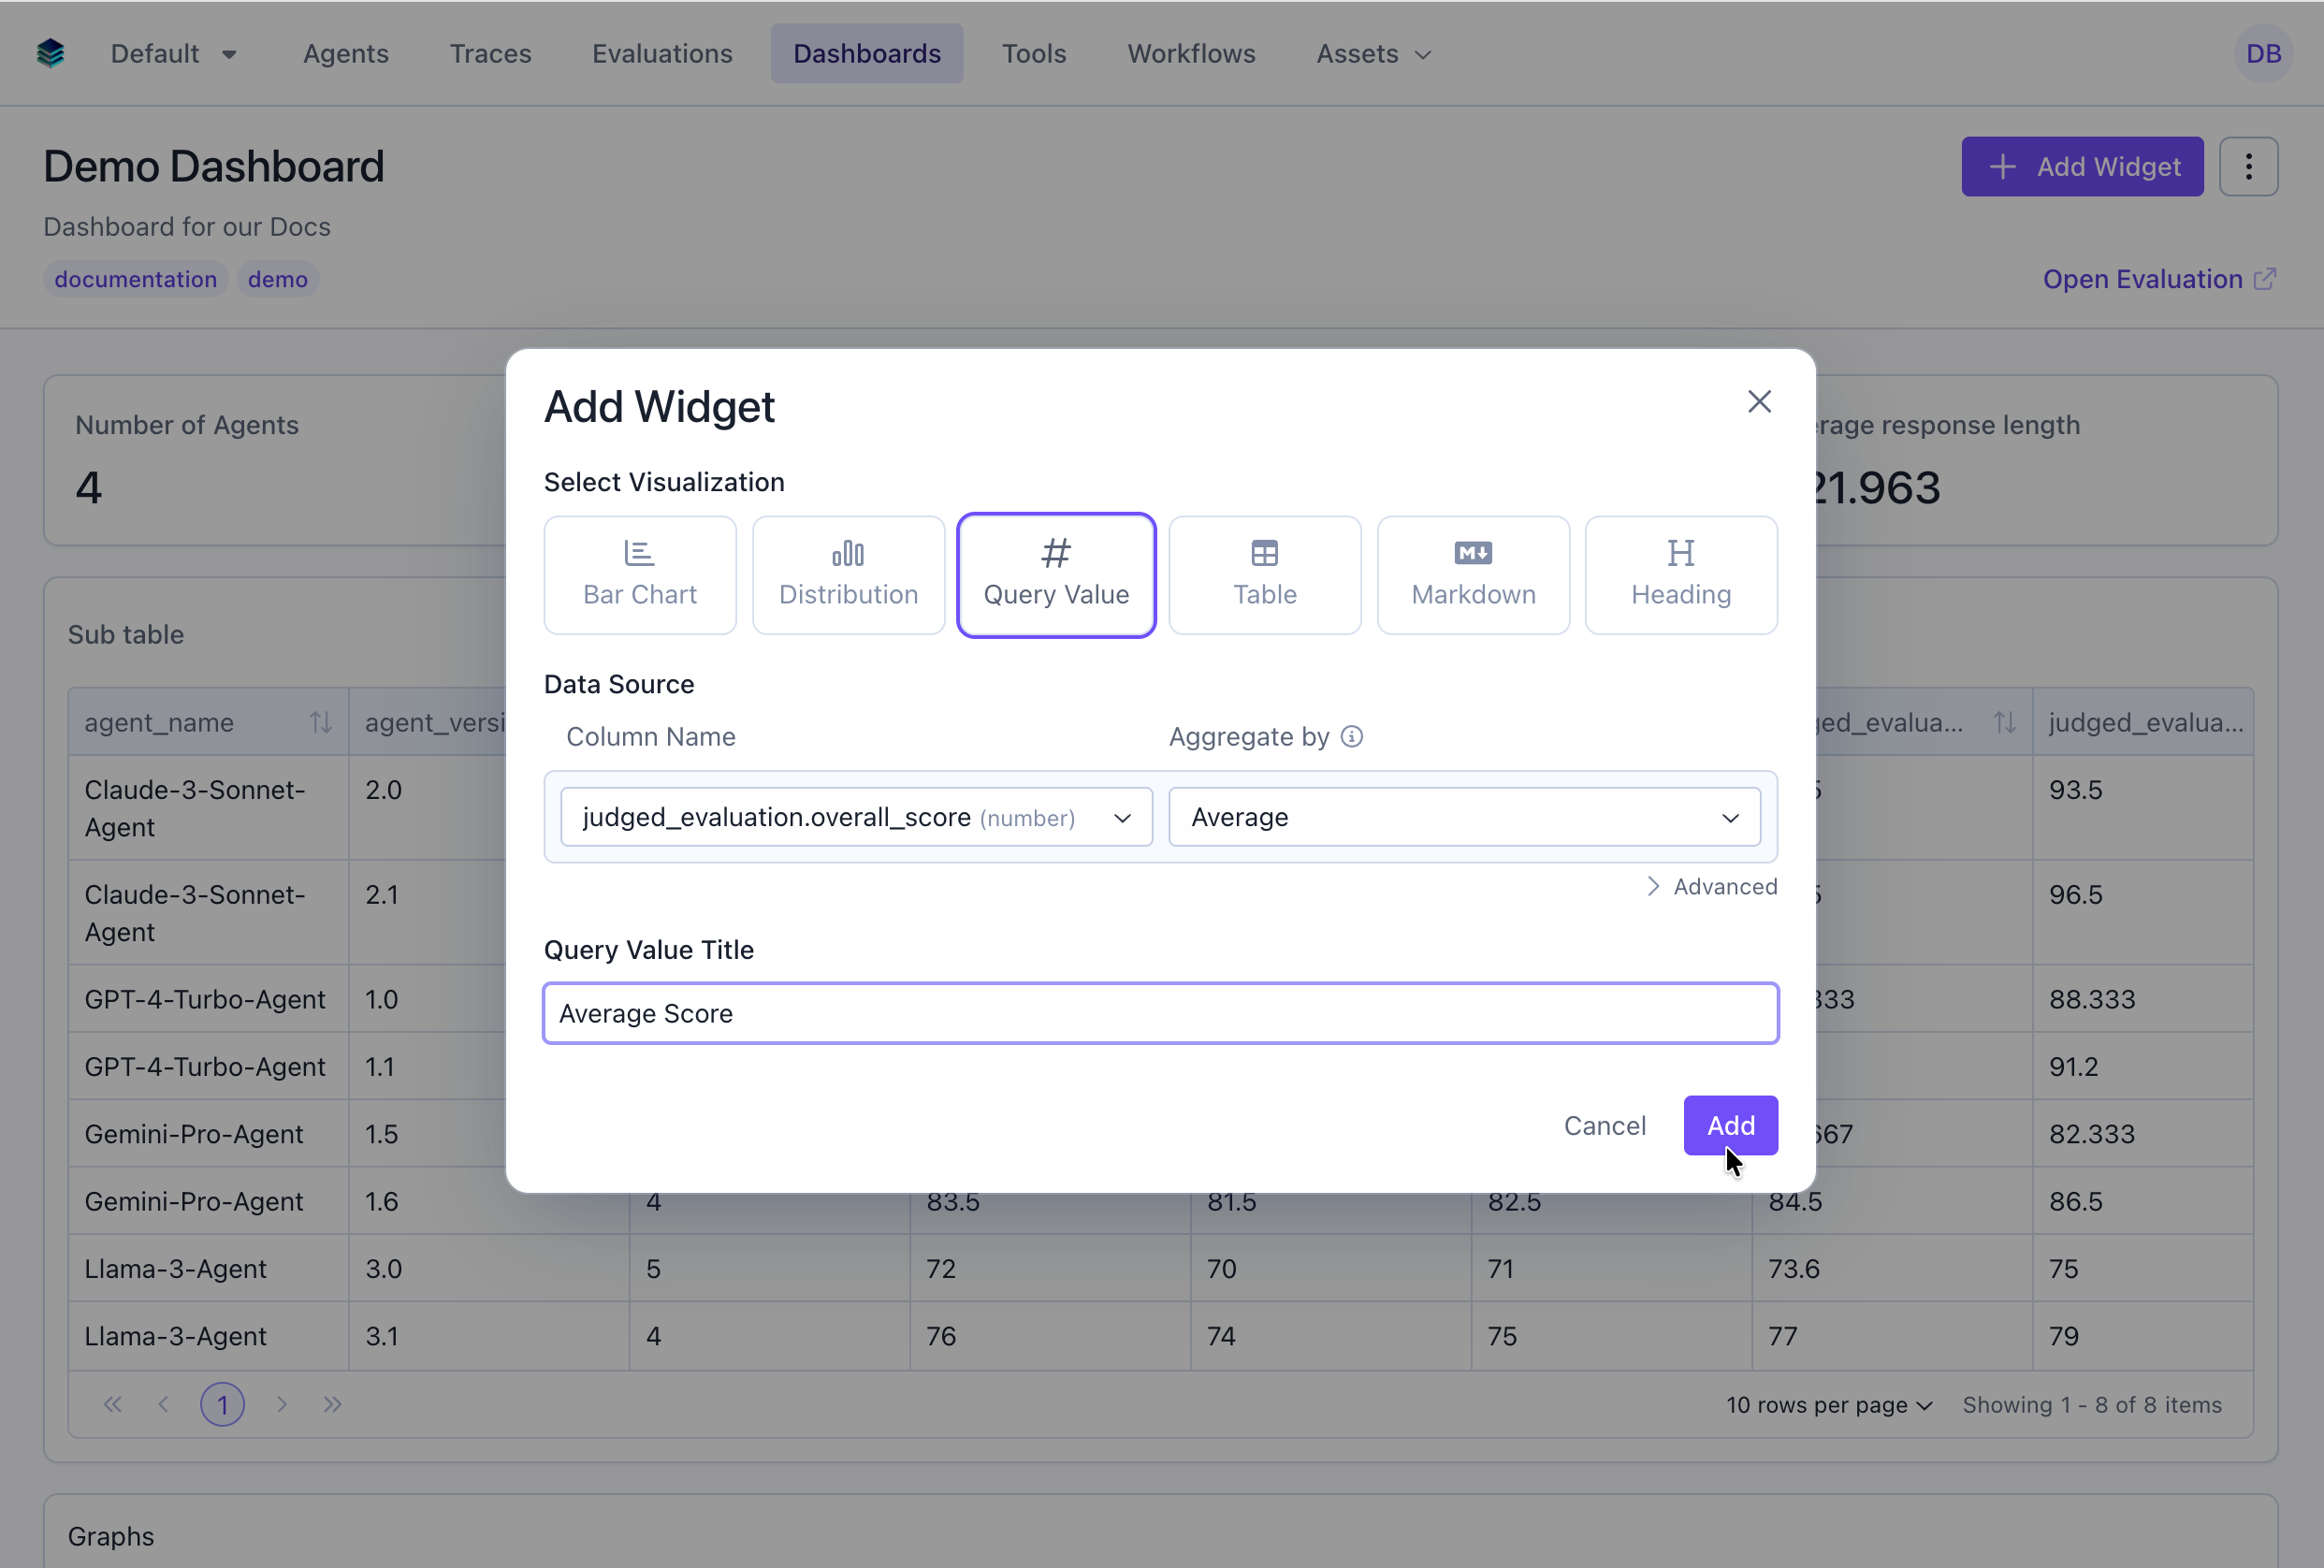
1. From your dashboard page, click "Add Widget"
2. Select "Query Value" as the widget type
3. Configure the widget:
* **Title**: "Average Score"
* **Query**: Select the average of the "score" column
4. Click "Add"
### Via the SDK
```python theme={null}
from scale_gp_beta import SGPClient
client = SGPClient(
api_key="your-api-key",
account_id="your-account-id",
environment="development"
)
# Create dashboard for a single evaluation
dashboard = client.evaluation_dashboards.create(
name="Demo Dashboard",
description="A demo dashboard for the demo evaluation",
evaluation_id="eval-123",
tags=["demo", "documentation"]
)
# Create dashboard from an existing template (single-evaluation dashboards only)
dashboard_from_template = client.evaluation_dashboards.create(
name="Q2 Model Performance",
evaluation_id="eval-456",
template_dashboard_id="dash-template-abc" # Copies widget layout from this dashboard
)
# Or create dashboard for an evaluation group
group_dashboard = client.evaluation_dashboards.create(
name="Cross-Evaluation Comparison",
evaluation_group_id="eval-group-456",
tags=["comparison"]
)
```
## Step 2: Add Your First Widget (Metric)
Let's add a metric widget to display the average score across all evaluation items.
### Via the UI
1. From your dashboard page, click "Add Widget"
2. Select "Query Value" as the widget type
3. Configure the widget:
* **Title**: "Average Score"
* **Query**: Select the average of the "score" column
4. Click "Add"
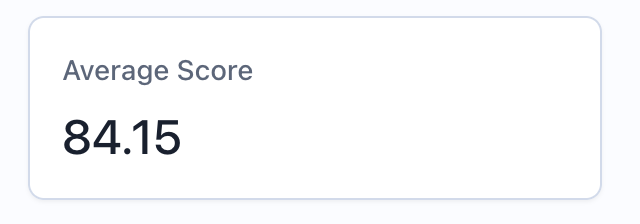 Widget results are automatically computed when you create or update a widget. The response includes both the widget configuration and the computed result.
### Via the API
```python theme={null}
# Add a metric widget showing average score
widget = client.evaluation_dashboards.widgets.create(
dashboard_id=dashboard.id,
title="Average Score",
type="metric",
query={
"select": [
{
"expression": {
"type": "AGGREGATION",
"function": "AVG",
"column": "overall_score",
"source": "data"
}
}
]
}
)
print(f"Computed result: {widget.result.computed_result}")
# Output: {'type': 'metric', 'data': 0.873}
```
## Step 3: Add a Chart Widget (Bar Chart)
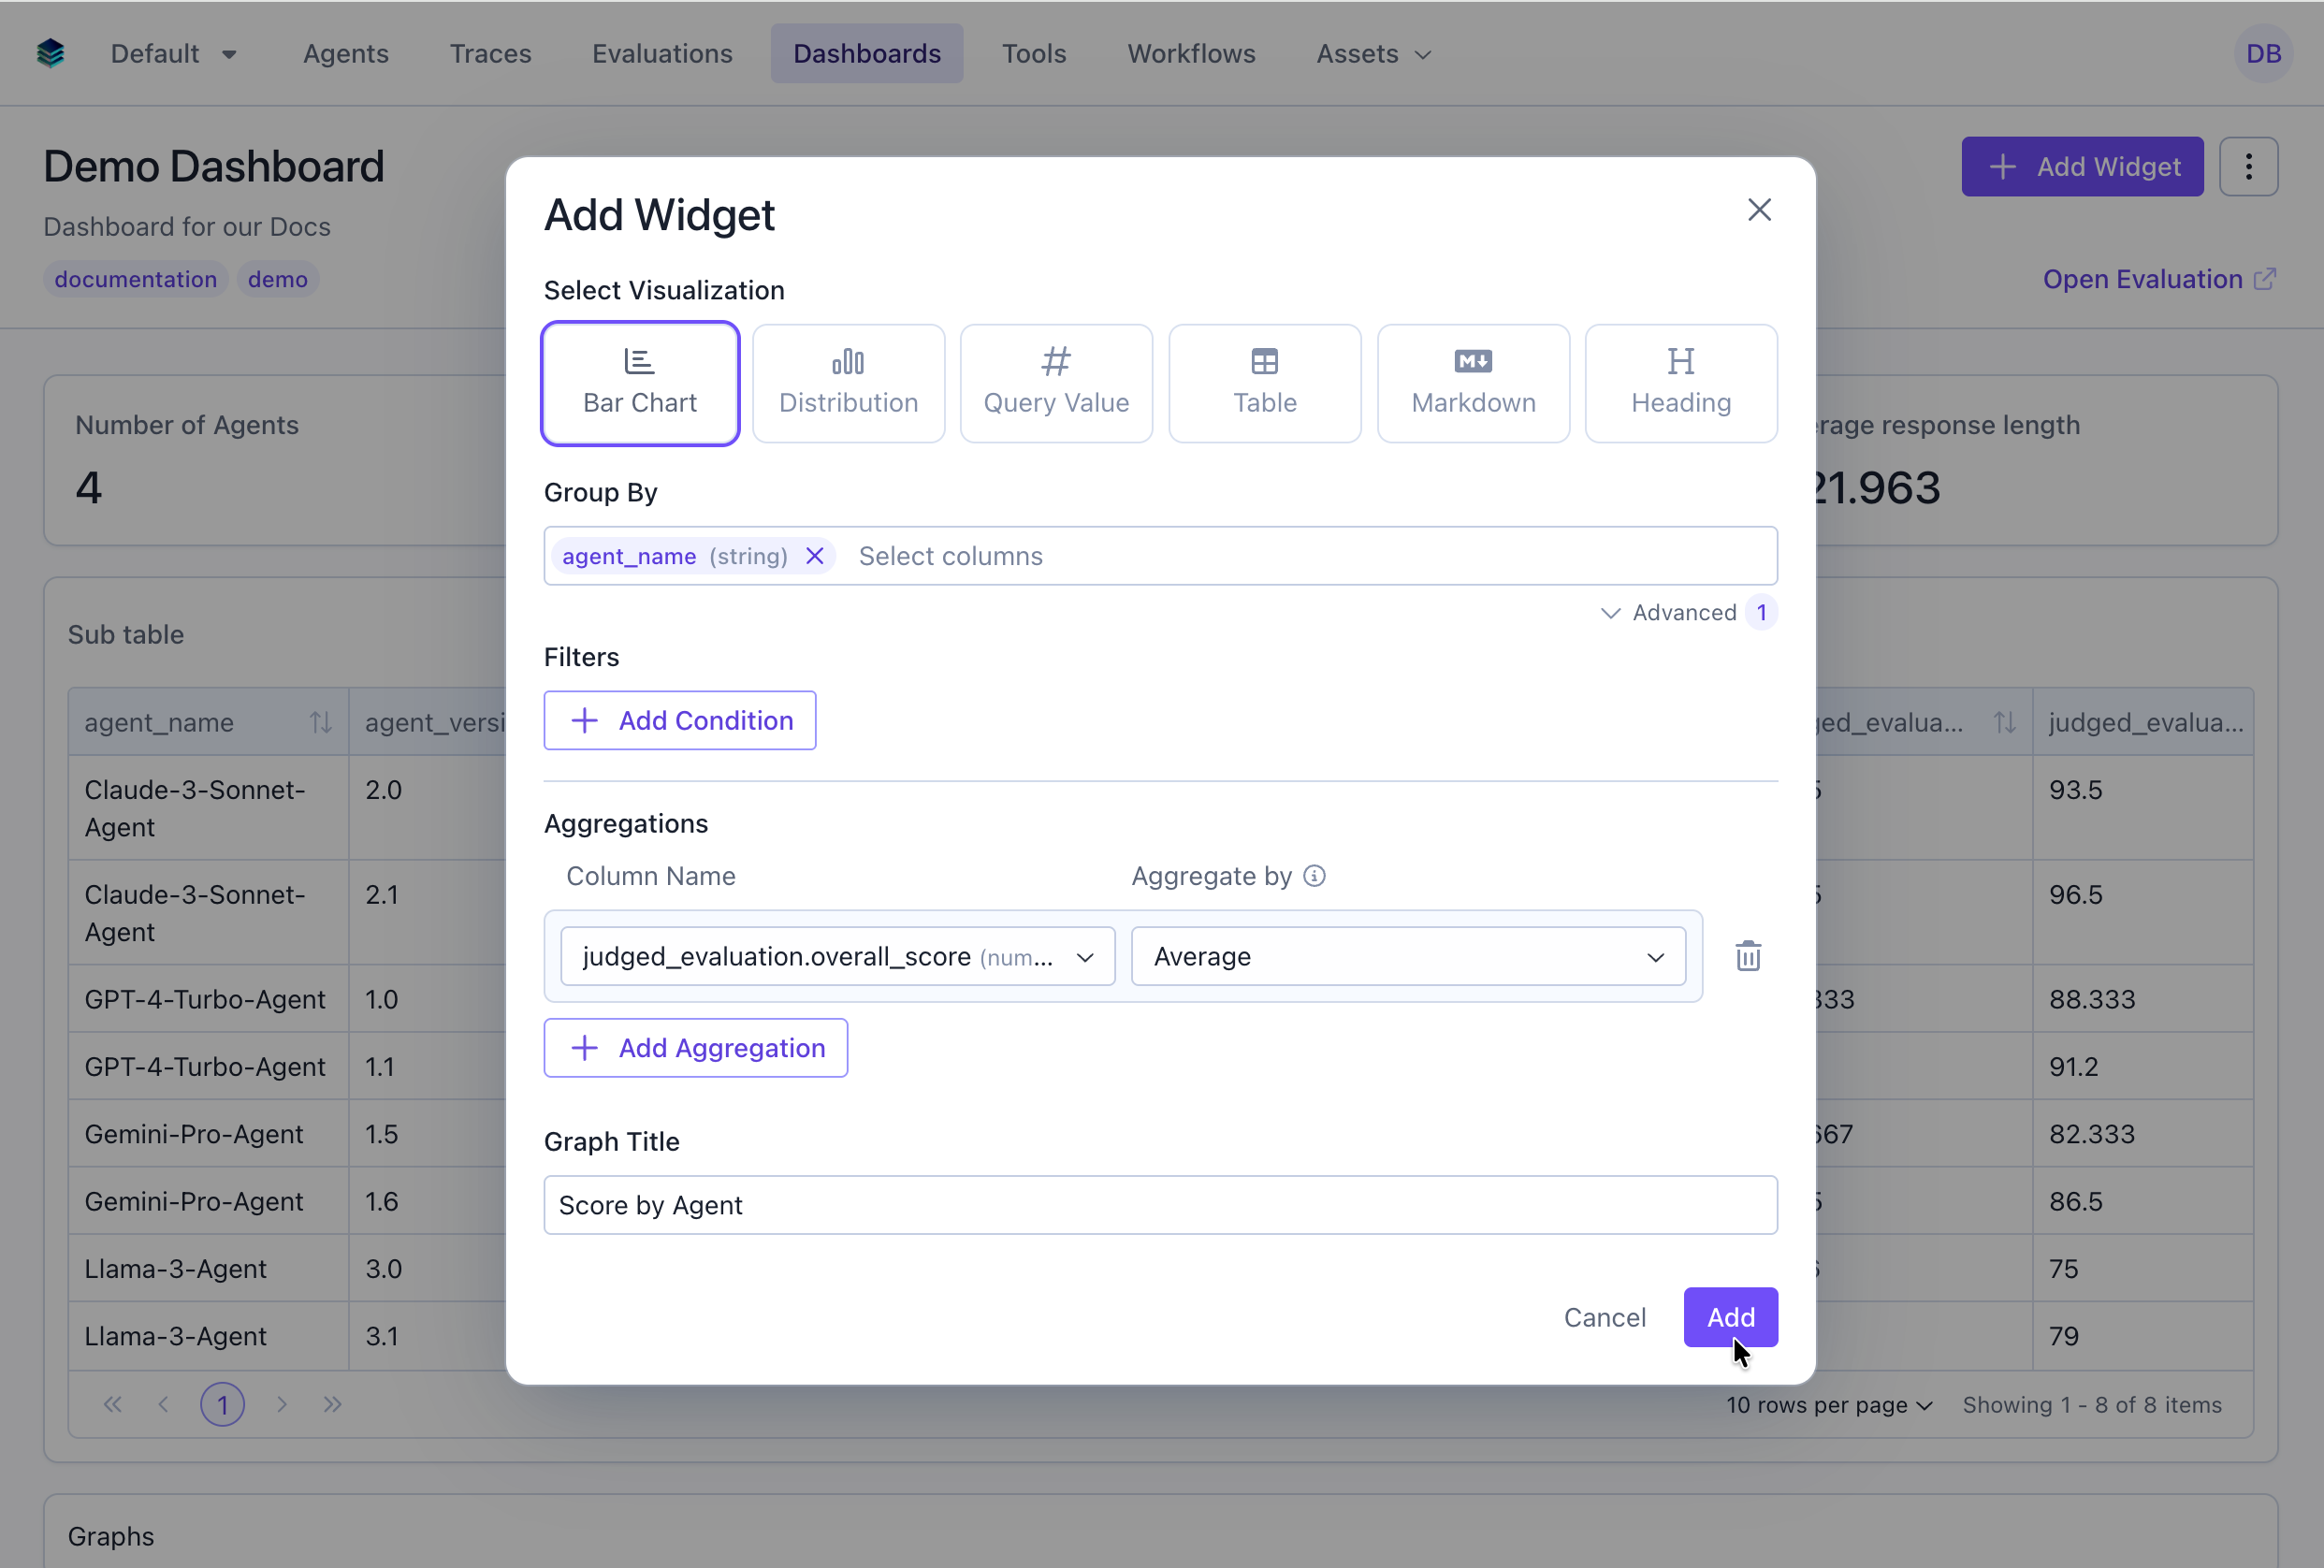
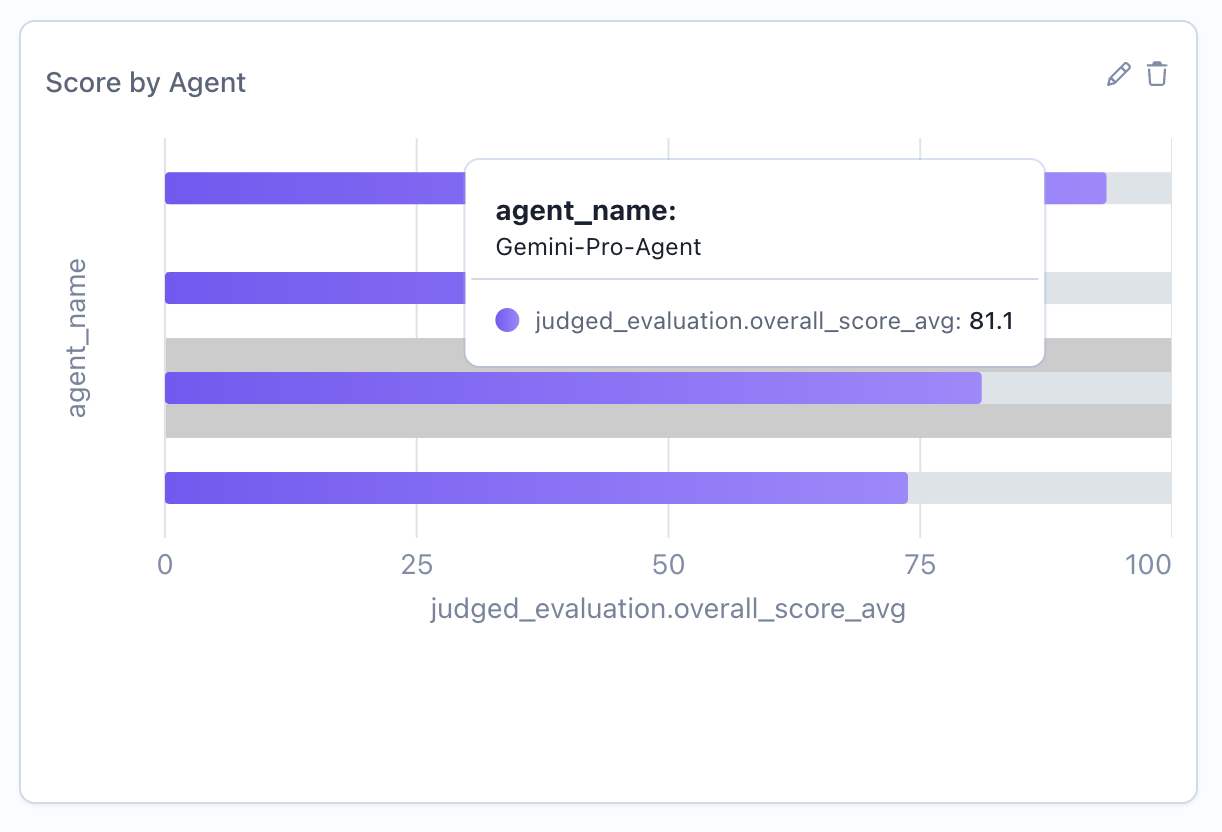
Now let's add a bar chart to show score distribution across different models.
### Via the UI
1. Click "Add Widget" again
2. Select "Bar Chart" as the widget type
3. Configure the widget:
* **Title**: "Score by Agent"
* **Group By**: Select "agent\_name"
* Under the Advanced Options
* Add an aggregation, select "Average" on "overall\_score"
4. Click "Add"
Widget results are automatically computed when you create or update a widget. The response includes both the widget configuration and the computed result.
### Via the API
```python theme={null}
# Add a metric widget showing average score
widget = client.evaluation_dashboards.widgets.create(
dashboard_id=dashboard.id,
title="Average Score",
type="metric",
query={
"select": [
{
"expression": {
"type": "AGGREGATION",
"function": "AVG",
"column": "overall_score",
"source": "data"
}
}
]
}
)
print(f"Computed result: {widget.result.computed_result}")
# Output: {'type': 'metric', 'data': 0.873}
```
## Step 3: Add a Chart Widget (Bar Chart)
Now let's add a bar chart to show score distribution across different models.
### Via the UI
1. Click "Add Widget" again
2. Select "Bar Chart" as the widget type
3. Configure the widget:
* **Title**: "Score by Agent"
* **Group By**: Select "agent\_name"
* Under the Advanced Options
* Add an aggregation, select "Average" on "overall\_score"
4. Click "Add"
 ### Via the SDK
```python theme={null}
# Add a bar chart widget showing average score by category
widget = client.evaluation_dashboards.widgets.create(
dashboard_id=dashboard.id,
title="Score by Agent",
type="bar",
query={
"select": [
{
"expression": {
"type": "COLUMN",
"column": "agent_name",
"source": "data"
}
},
{
"expression": {
"type": "AGGREGATION",
"function": "AVG",
"column": "overall_score",
"source": "data"
}
}
],
"groupBy": ["agent_name"]
},
config={
"x_column": "agent_name"
}
)
```
## Step 4: Add Section Headers
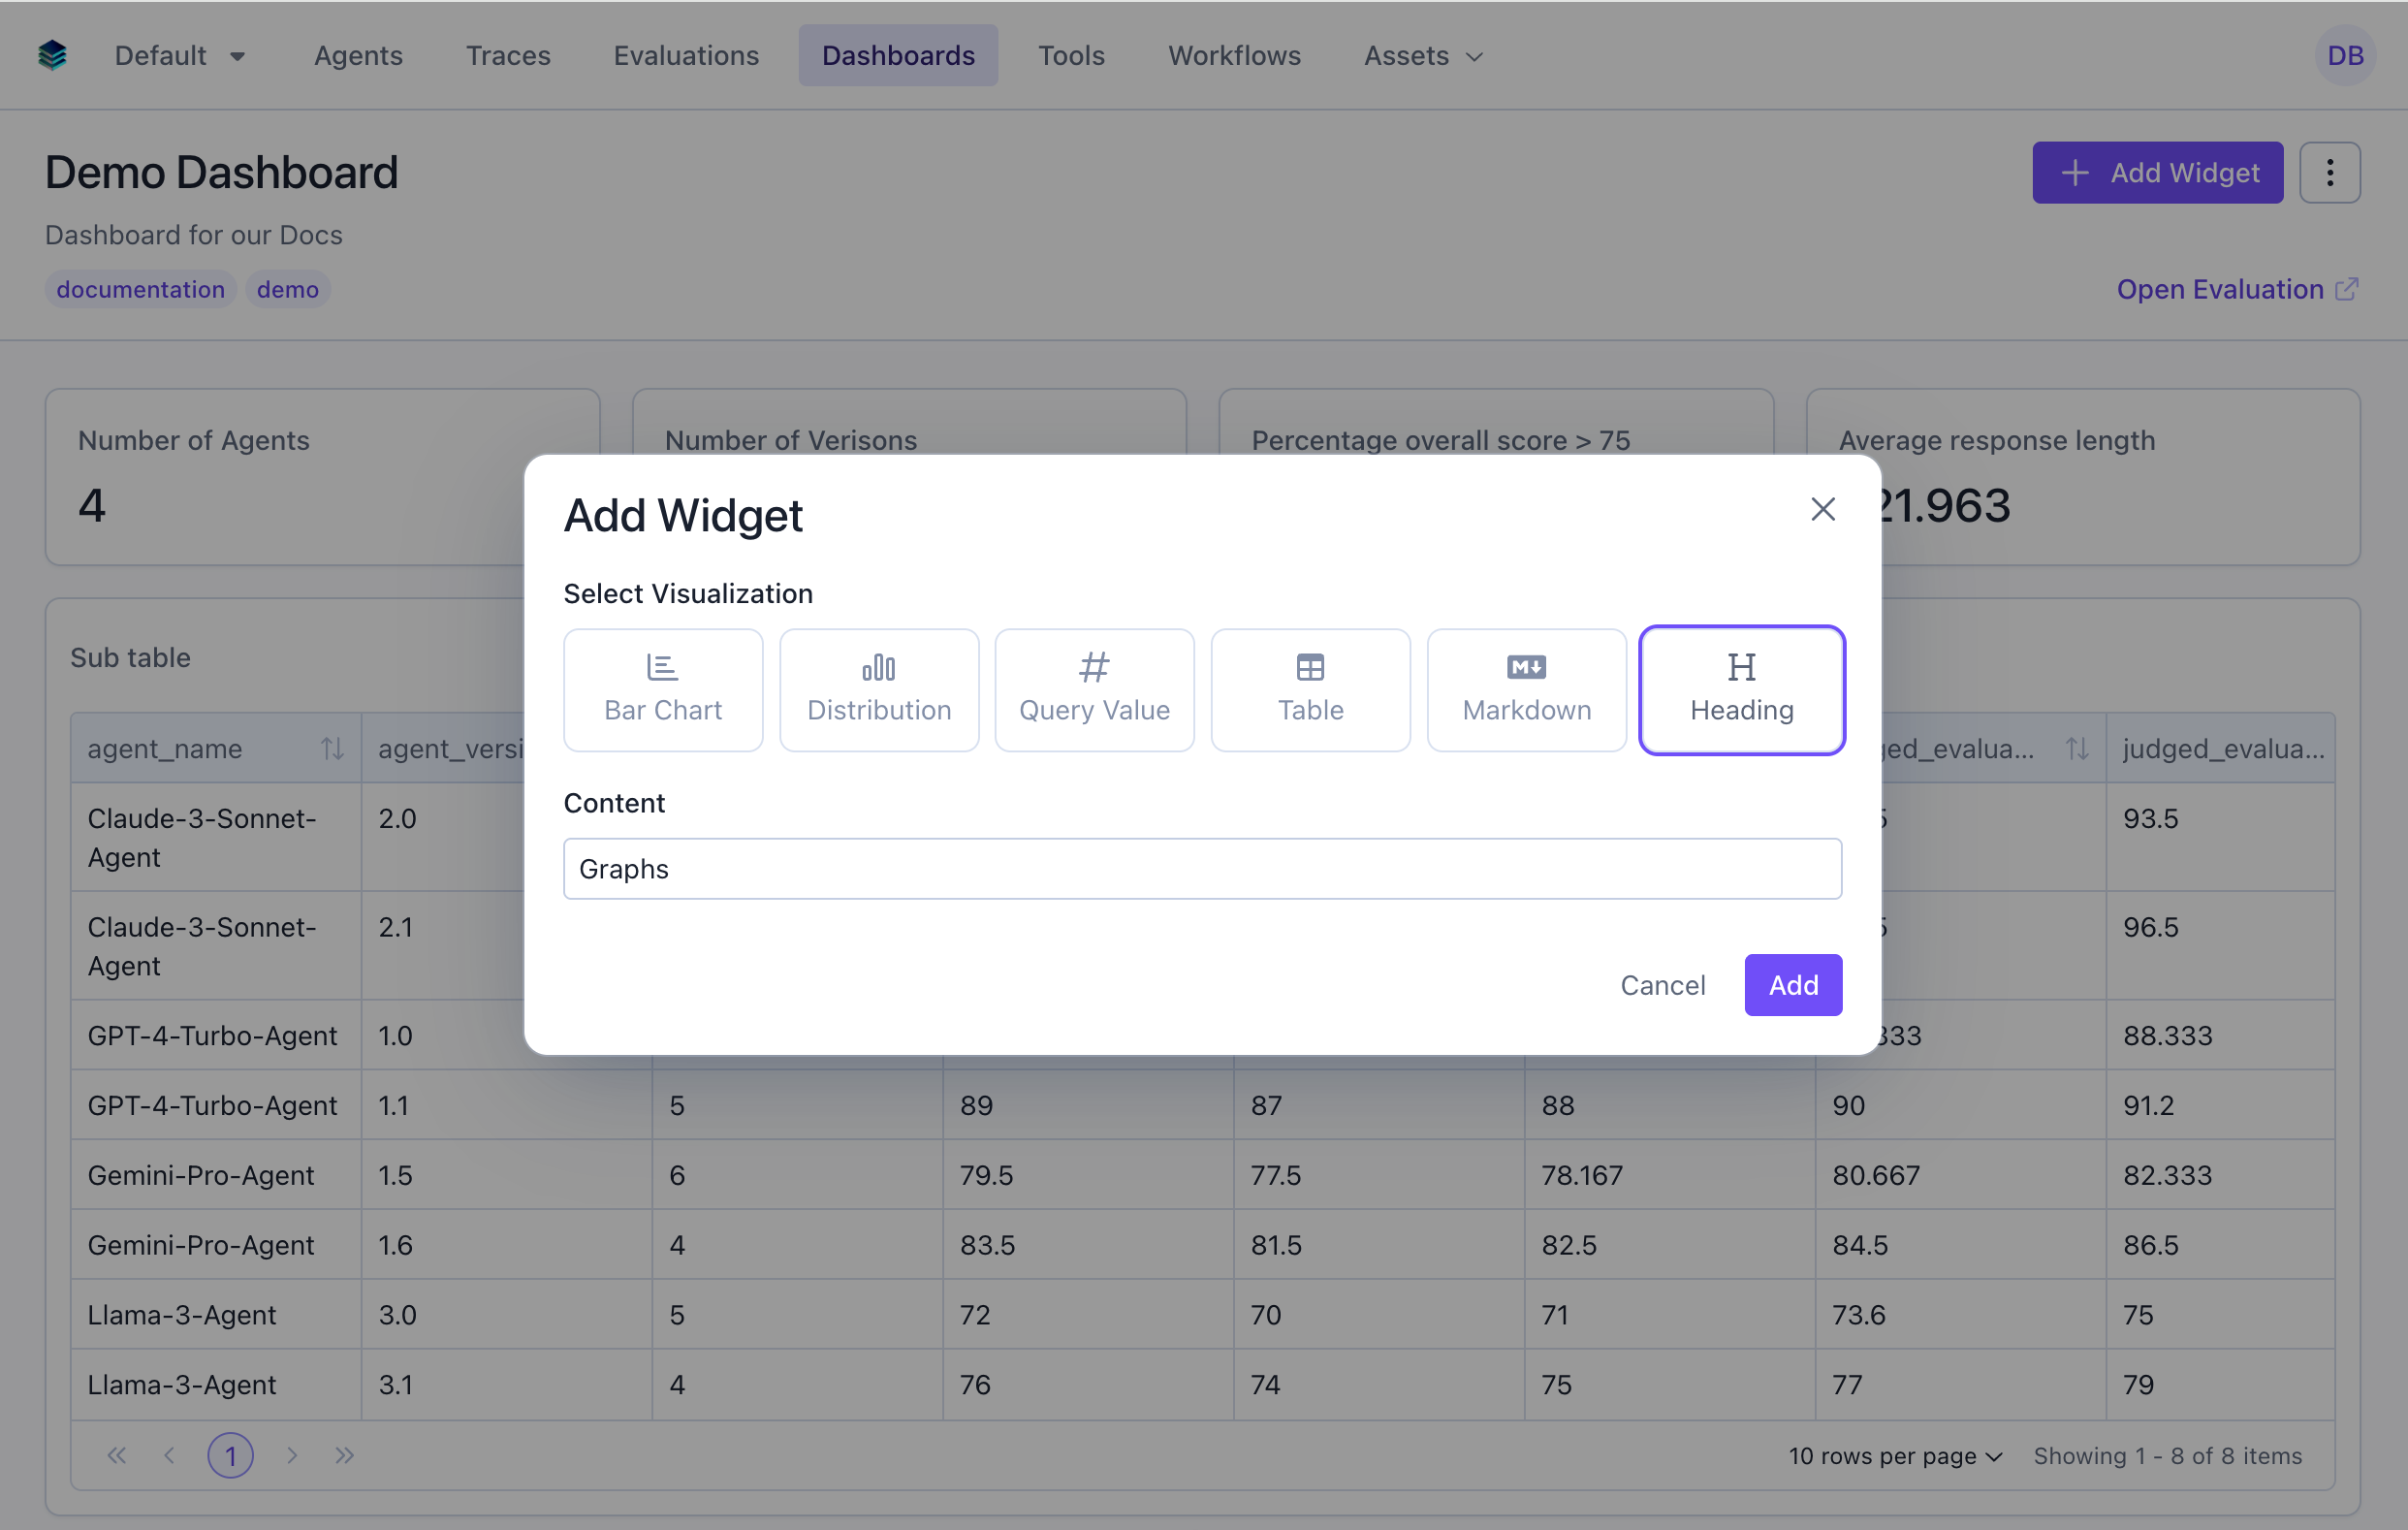
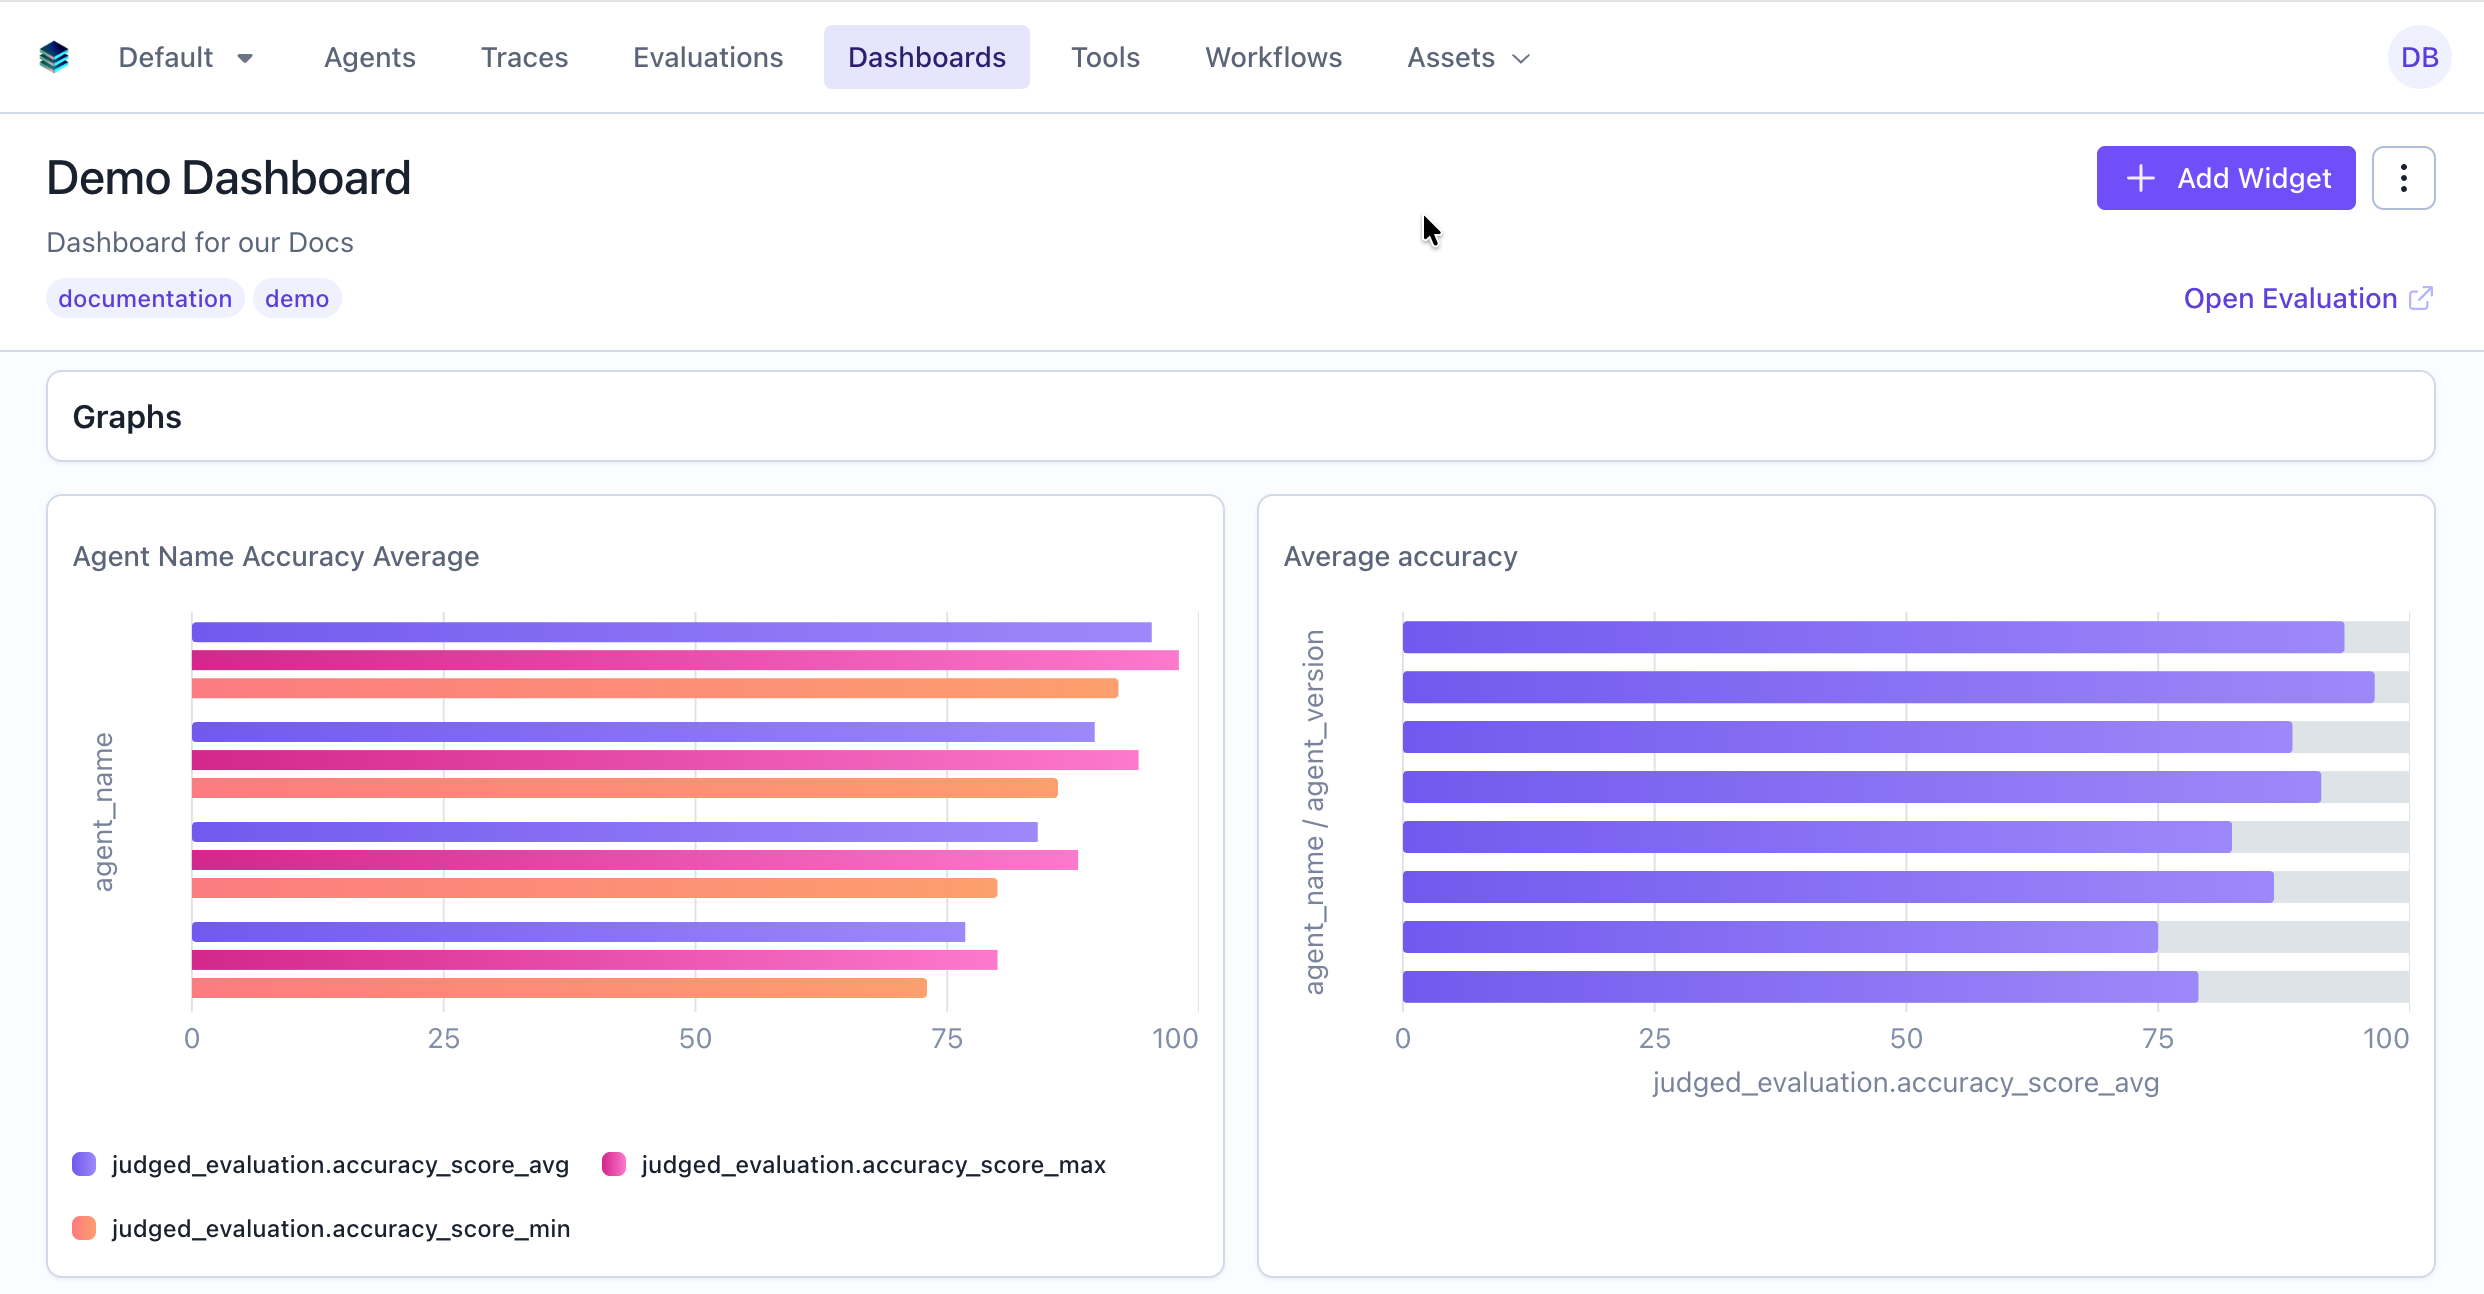
Use heading widgets to organize your dashboard into logical sections.
### Via the UI
1. Click "Add Widget"
2. Select "Heading" as the widget type
3. Configure the widget:
* **Title**: "Graphs"
4. Click "Add"
### Via the SDK
```python theme={null}
# Add a bar chart widget showing average score by category
widget = client.evaluation_dashboards.widgets.create(
dashboard_id=dashboard.id,
title="Score by Agent",
type="bar",
query={
"select": [
{
"expression": {
"type": "COLUMN",
"column": "agent_name",
"source": "data"
}
},
{
"expression": {
"type": "AGGREGATION",
"function": "AVG",
"column": "overall_score",
"source": "data"
}
}
],
"groupBy": ["agent_name"]
},
config={
"x_column": "agent_name"
}
)
```
## Step 4: Add Section Headers
Use heading widgets to organize your dashboard into logical sections.
### Via the UI
1. Click "Add Widget"
2. Select "Heading" as the widget type
3. Configure the widget:
* **Title**: "Graphs"
4. Click "Add"
 ### Via the SDK
```python theme={null}
# Add a heading widget
heading = client.evaluation_dashboards.widgets.create(
dashboard_id=dashboard.id,
title="Graphs",
type="heading"
)
```
## Step 5: Organize and Configure Layout
### Reorder Widgets
Arrange widgets in your preferred order by dragging and dropping in the UI, or update the widget order via the API:
```python theme={null}
# Reorder widgets - first widget appears at top
client.evaluation_dashboards.update(
dashboard_id=dashboard.id,
widget_order=[heading.id, widget1.id, widget2.id]
)
```
For evaluation group dashboards, see the dedicated [Evaluation Group Dashboards](./eval-group-dashboards) guide for group-specific features like cross-evaluation queries, per-evaluation selection, and auto-recomputation.
## Next Steps
* Learn about all available [Widget Types](./widget-types/overview)
* Compare across evaluations with [Evaluation Group Dashboards](./eval-group-dashboards)
* Capture [Latest Snapshots](./eval-group-latest-snapshots) of your evaluation group
* Master the [Query Language](./query-language) for advanced filtering and aggregations
* Explore [API Reference](/reference/v5/evaluation-dashboards) for programmatic query creation
### Via the SDK
```python theme={null}
# Add a heading widget
heading = client.evaluation_dashboards.widgets.create(
dashboard_id=dashboard.id,
title="Graphs",
type="heading"
)
```
## Step 5: Organize and Configure Layout
### Reorder Widgets
Arrange widgets in your preferred order by dragging and dropping in the UI, or update the widget order via the API:
```python theme={null}
# Reorder widgets - first widget appears at top
client.evaluation_dashboards.update(
dashboard_id=dashboard.id,
widget_order=[heading.id, widget1.id, widget2.id]
)
```
For evaluation group dashboards, see the dedicated [Evaluation Group Dashboards](./eval-group-dashboards) guide for group-specific features like cross-evaluation queries, per-evaluation selection, and auto-recomputation.
## Next Steps
* Learn about all available [Widget Types](./widget-types/overview)
* Compare across evaluations with [Evaluation Group Dashboards](./eval-group-dashboards)
* Capture [Latest Snapshots](./eval-group-latest-snapshots) of your evaluation group
* Master the [Query Language](./query-language) for advanced filtering and aggregations
* Explore [API Reference](/reference/v5/evaluation-dashboards) for programmatic query creation