> ## Documentation Index
> Fetch the complete documentation index at: https://docs.gp.scale.com/llms.txt
> Use this file to discover all available pages before exploring further.
# Evaluation Group Dashboards
> Compare metrics across multiple evaluations with evaluation group dashboards
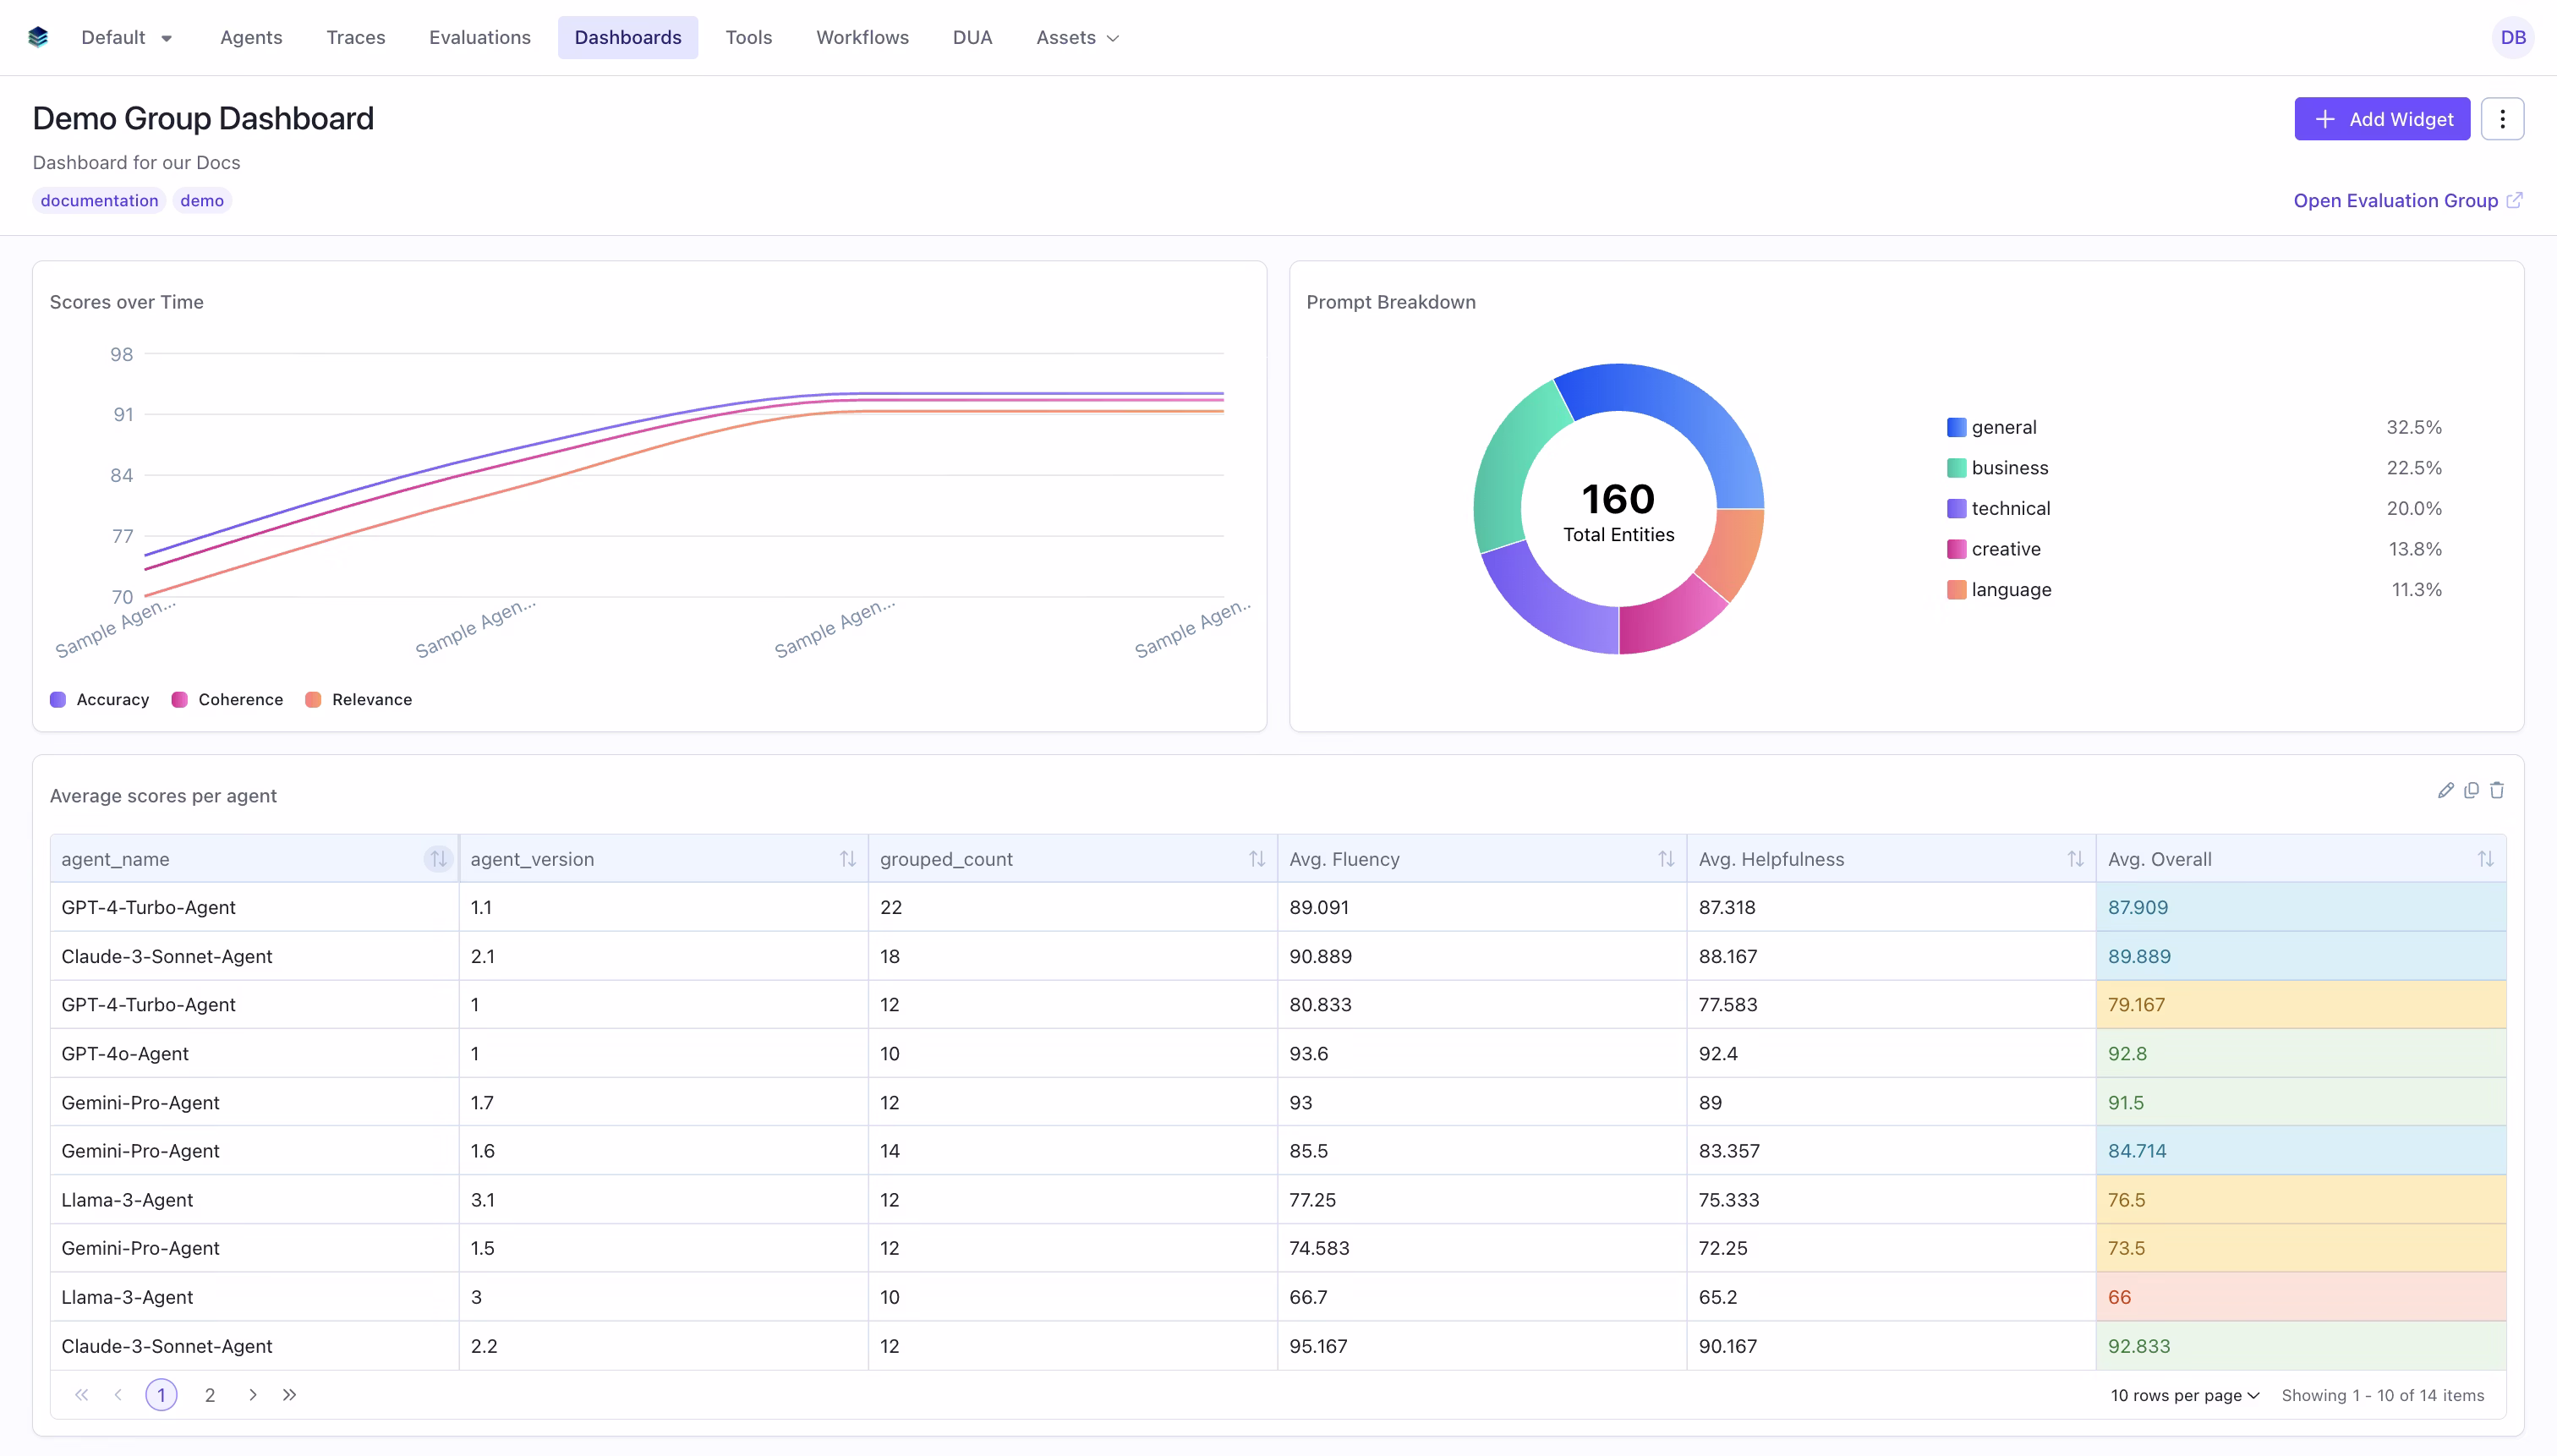 ## What are Evaluation Group Dashboards?
Evaluation group dashboards let you aggregate and compare data across multiple evaluations in a single dashboard. Instead of viewing metrics for one evaluation at a time, you can visualize trends, compare performance, and track progress across an entire group of related evaluations.
Evaluation group dashboards support all the same widget types and query language as single-evaluation dashboards, with additional features for cross-evaluation analysis.
Watch the [evaluation group dashboard demo video](./overview#evaluation-group-dashboard) for a walkthrough.
Dashboards use an XOR constraint -- they belong to either a single evaluation OR an evaluation group, never both.
## Creating an Evaluation Group Dashboard
### Via the UI
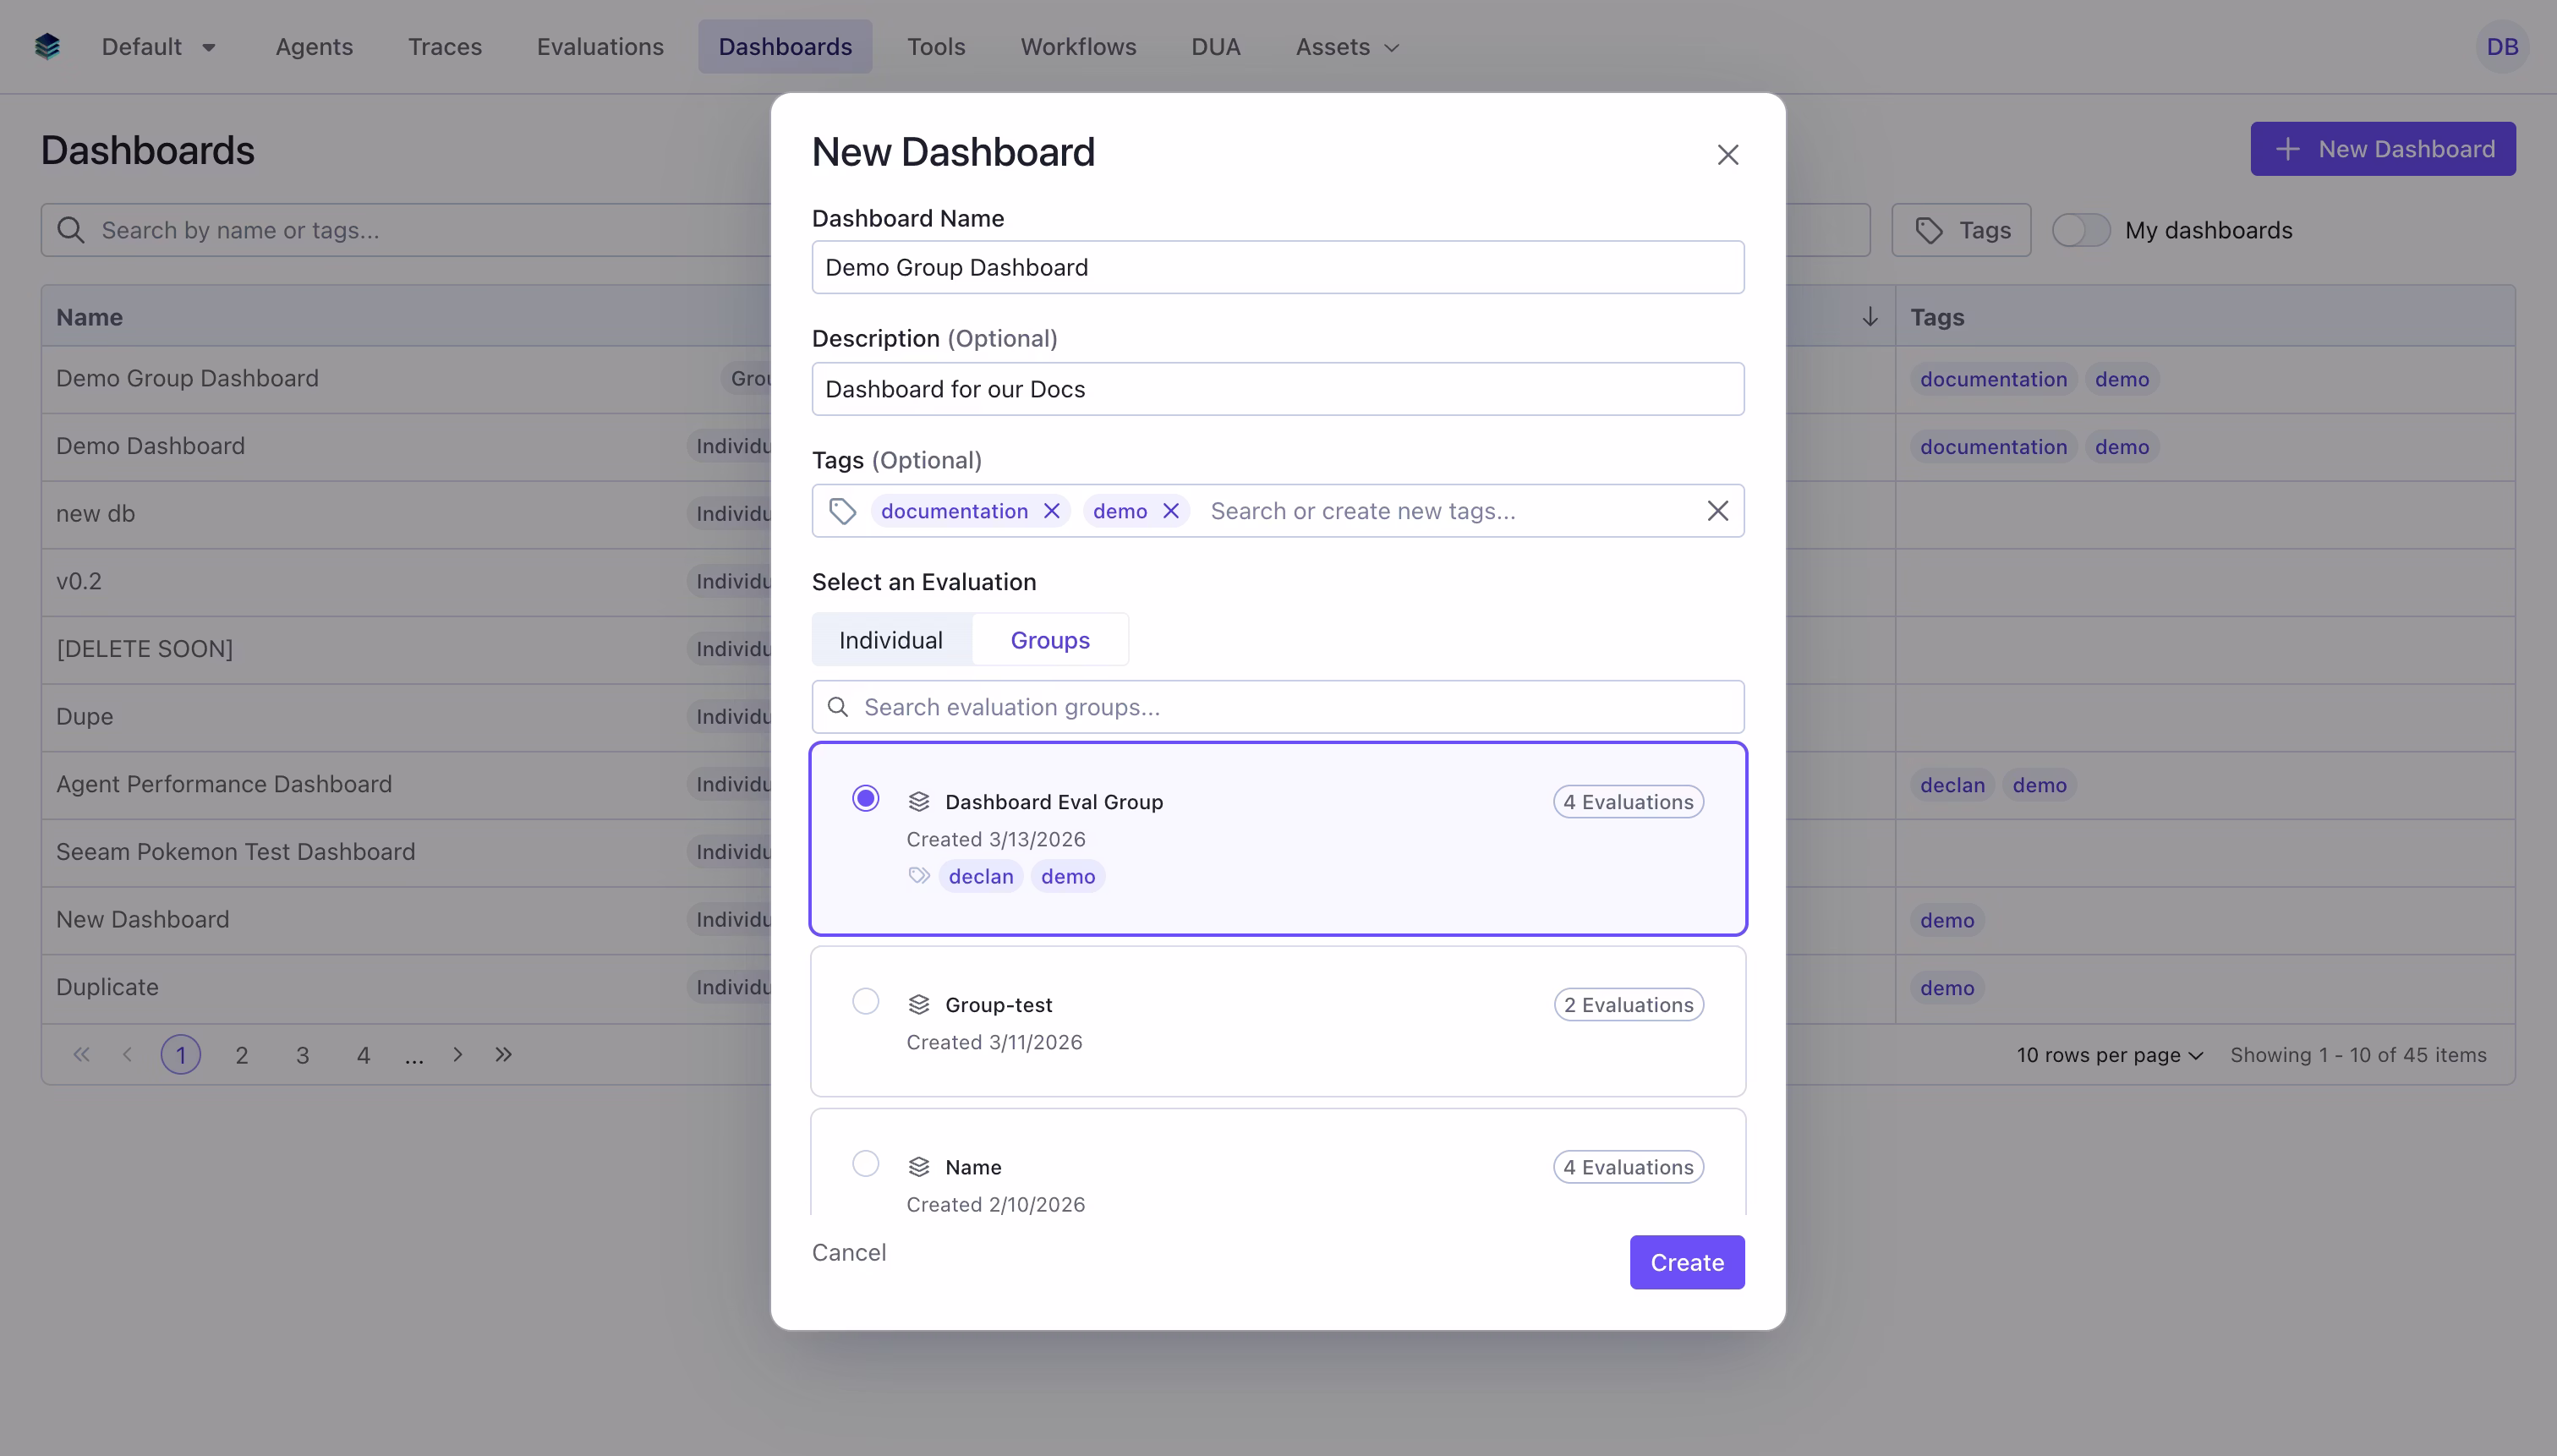
Navigate to the Dashboards page and click "New Dashboard"
In the create dialog, select the "Groups" tab and choose the evaluation group you want to create a dashboard for.
* **Name**: Give your dashboard a descriptive name
* **Description**: Optional description explaining the dashboard's purpose
* **Tags**: Optional tags for organization and filtering
## What are Evaluation Group Dashboards?
Evaluation group dashboards let you aggregate and compare data across multiple evaluations in a single dashboard. Instead of viewing metrics for one evaluation at a time, you can visualize trends, compare performance, and track progress across an entire group of related evaluations.
Evaluation group dashboards support all the same widget types and query language as single-evaluation dashboards, with additional features for cross-evaluation analysis.
Watch the [evaluation group dashboard demo video](./overview#evaluation-group-dashboard) for a walkthrough.
Dashboards use an XOR constraint -- they belong to either a single evaluation OR an evaluation group, never both.
## Creating an Evaluation Group Dashboard
### Via the UI
Navigate to the Dashboards page and click "New Dashboard"
In the create dialog, select the "Groups" tab and choose the evaluation group you want to create a dashboard for.
* **Name**: Give your dashboard a descriptive name
* **Description**: Optional description explaining the dashboard's purpose
* **Tags**: Optional tags for organization and filtering
 Click "Create" to save your dashboard. You can now add widgets to visualize your group data.
### Via the SDK
```python theme={null}
from scale_gp_beta import SGPClient
client = SGPClient(
api_key="your-api-key",
account_id="your-account-id",
environment="development"
)
# Create dashboard for an evaluation group
dashboard = client.evaluation_dashboards.create(
name="Cross-Evaluation Comparison",
evaluation_group_id="eval-group-456",
description="Compare performance across weekly evaluation runs",
tags=["comparison", "weekly"]
)
```
## Querying Across Evaluations
Evaluation group dashboards extend the standard query language with fields for controlling which evaluations to include in computations.
### The `evaluation_ids` Field
Add `evaluation_ids` to a query to specify which evaluations in the group to include. If omitted, all evaluations in the group are used.
```json theme={null}
{
"select": [
{
"expression": {
"type": "AGGREGATION",
"function": "AVG",
"column": "overall_score",
"source": "data"
},
"alias": "avg_score"
}
],
"evaluation_ids": ["eval-abc", "eval-def", "eval-ghi"]
}
```
This computes the average score across only the three specified evaluations, rather than all evaluations in the group.
### Per-Aggregation `evaluation_ids`
Individual aggregation nodes can also specify their own `evaluation_ids`, which must be a subset of the query-level `evaluation_ids`. This allows you to compare metrics across different evaluation subsets within the same widget.
```json theme={null}
{
"select": [
{
"expression": {
"type": "AGGREGATION",
"function": "AVG",
"column": "overall_score",
"source": "data",
"evaluation_ids": ["eval-abc"]
},
"alias": "eval_a_avg"
},
{
"expression": {
"type": "AGGREGATION",
"function": "AVG",
"column": "overall_score",
"source": "data",
"evaluation_ids": ["eval-def"]
},
"alias": "eval_b_avg"
}
],
"evaluation_ids": ["eval-abc", "eval-def"]
}
```
Per-aggregation `evaluation_ids` must be a subset of the query-level `evaluation_ids`. The system validates this constraint and will reject queries where a per-node set includes IDs not present at the query level.
### The `_evaluation_id` Column
A special `_evaluation_id` column is automatically available in evaluation group dashboard queries. This column contains the ID of the evaluation that each data row belongs to, allowing you to group or filter by evaluation source.
```json theme={null}
{
"select": [
{"expression": {"type": "COLUMN", "column": "_evaluation_id"}},
{
"expression": {"type": "AGGREGATION", "function": "AVG", "column": "overall_score", "source": "data"},
"alias": "avg_score"
},
{
"expression": {"type": "AGGREGATION", "function": "COUNT", "column": "*"},
"alias": "item_count"
}
],
"groupBy": ["_evaluation_id"]
}
```
This produces a row per evaluation in the group, showing the average score and item count for each.
## Per-Evaluation Selection in Widgets
When creating widgets in the UI for an evaluation group dashboard, the widget creator allows you to select which evaluations to include per aggregation. This is particularly useful for:
* **Metric widgets**: Compare the same metric across specific evaluations
* **Chart widgets**: Compare multiple metrics across specific evaluations
* **Table widgets**: Include different evaluation subsets for different columns
The UI evaluation selector maps directly to the `evaluation_ids` field on aggregation nodes in the query.
## Auto-Recomputation on Group Changes
When evaluations are added to or removed from an evaluation group, all dashboard widgets for that group are automatically recomputed. This ensures your dashboards always reflect the current state of the group.
### How it Works
1. **Membership change detected**: When you add or remove evaluations from a group, the system triggers an asynchronous recomputation workflow
2. **Smart `evaluation_ids` updates**: Widgets whose `evaluation_ids` covered all previous group members are automatically expanded or contracted to reflect the new membership. For example, if a group had evaluations \[A, B] and you add C, widgets covering \[A, B] are updated to \[A, B, C]
3. **Results marked as pending**: Existing widget results are marked with `computation_status: "pending"` while recomputation runs
4. **Recomputation completes**: Each widget is recomputed with the updated evaluation data, and results are updated to `computation_status: "completed"`
This allows for widgets to be updated as new evaluations are added to the group. Any widgets computed across all evaluations in the group will be updated to include the new evaluation.
This is particularly useful for the timeseries widget, where each evaluation is plotted as a member of the x-axis.
## Example: Cross-Evaluation Comparison Dashboard
Here's a full example creating an evaluation group dashboard with multiple widget types.
### Step 1: Create the Dashboard
```python theme={null}
dashboard = client.evaluation_dashboards.create(
name="Weekly Agent Performance",
evaluation_group_id="eval-group-weekly",
tags=["weekly-review"]
)
```
### Step 2: Add a Heading
```python theme={null}
client.evaluation_dashboards.widgets.create(
dashboard_id=dashboard.id,
title="Performance Overview",
type="heading"
)
```
### Step 3: Add Metric Widgets per Evaluation
```python theme={null}
# Average score across all evaluations in the group
client.evaluation_dashboards.widgets.create(
dashboard_id=dashboard.id,
title="Overall Average Score",
type="metric",
query={
"select": [
{
"expression": {
"type": "AGGREGATION",
"function": "AVG",
"column": "overall_score",
"source": "data"
}
}
]
}
)
```
### Step 4: Add a Timeseries Showing Trends
```python theme={null}
client.evaluation_dashboards.widgets.create(
dashboard_id=dashboard.id,
title="Score Trend Over Evaluations",
type="timeseries",
query={
"select": [
{
"expression": {
"type": "AGGREGATION",
"function": "AVG",
"column": "overall_score",
"source": "data"
},
"alias": "avg_score"
},
{
"expression": {
"type": "AGGREGATION",
"function": "AVG",
"column": "accuracy_score",
"source": "data"
},
"alias": "avg_accuracy"
}
]
}
)
```
### Step 5: Add a Table Grouped by Evaluation
```python theme={null}
client.evaluation_dashboards.widgets.create(
dashboard_id=dashboard.id,
title="Per-Evaluation Breakdown",
type="table",
query={
"select": [
{"expression": {"type": "COLUMN", "column": "_evaluation_id"}},
{
"expression": {"type": "AGGREGATION", "function": "COUNT", "column": "*"},
"alias": "items"
},
{
"expression": {"type": "AGGREGATION", "function": "AVG", "column": "overall_score", "source": "data"},
"alias": "avg_score"
},
{
"expression": {
"type": "AGGREGATION",
"function": "PERCENTAGE",
"column": "*",
"params": {
"percentage_filters": {
"conditions": [{"column": "overall_score", "source": "data", "operator": ">=", "value": 85}]
}
}
},
"alias": "pass_rate"
}
],
"groupBy": ["_evaluation_id"]
}
)
```
## Related Documentation
* [Evaluation Dashboards Overview](./overview) - Introduction to dashboards
* [Getting Started](./getting-started) - Create your first dashboard
* [Timeseries Widget](./widget-types/timeseries) - Ideal for group trend visualization
* [Query Language](./query-language) - Complete query syntax reference
* [API Reference](/reference/v5/evaluation-dashboards) - Programmatic dashboard management
Click "Create" to save your dashboard. You can now add widgets to visualize your group data.
### Via the SDK
```python theme={null}
from scale_gp_beta import SGPClient
client = SGPClient(
api_key="your-api-key",
account_id="your-account-id",
environment="development"
)
# Create dashboard for an evaluation group
dashboard = client.evaluation_dashboards.create(
name="Cross-Evaluation Comparison",
evaluation_group_id="eval-group-456",
description="Compare performance across weekly evaluation runs",
tags=["comparison", "weekly"]
)
```
## Querying Across Evaluations
Evaluation group dashboards extend the standard query language with fields for controlling which evaluations to include in computations.
### The `evaluation_ids` Field
Add `evaluation_ids` to a query to specify which evaluations in the group to include. If omitted, all evaluations in the group are used.
```json theme={null}
{
"select": [
{
"expression": {
"type": "AGGREGATION",
"function": "AVG",
"column": "overall_score",
"source": "data"
},
"alias": "avg_score"
}
],
"evaluation_ids": ["eval-abc", "eval-def", "eval-ghi"]
}
```
This computes the average score across only the three specified evaluations, rather than all evaluations in the group.
### Per-Aggregation `evaluation_ids`
Individual aggregation nodes can also specify their own `evaluation_ids`, which must be a subset of the query-level `evaluation_ids`. This allows you to compare metrics across different evaluation subsets within the same widget.
```json theme={null}
{
"select": [
{
"expression": {
"type": "AGGREGATION",
"function": "AVG",
"column": "overall_score",
"source": "data",
"evaluation_ids": ["eval-abc"]
},
"alias": "eval_a_avg"
},
{
"expression": {
"type": "AGGREGATION",
"function": "AVG",
"column": "overall_score",
"source": "data",
"evaluation_ids": ["eval-def"]
},
"alias": "eval_b_avg"
}
],
"evaluation_ids": ["eval-abc", "eval-def"]
}
```
Per-aggregation `evaluation_ids` must be a subset of the query-level `evaluation_ids`. The system validates this constraint and will reject queries where a per-node set includes IDs not present at the query level.
### The `_evaluation_id` Column
A special `_evaluation_id` column is automatically available in evaluation group dashboard queries. This column contains the ID of the evaluation that each data row belongs to, allowing you to group or filter by evaluation source.
```json theme={null}
{
"select": [
{"expression": {"type": "COLUMN", "column": "_evaluation_id"}},
{
"expression": {"type": "AGGREGATION", "function": "AVG", "column": "overall_score", "source": "data"},
"alias": "avg_score"
},
{
"expression": {"type": "AGGREGATION", "function": "COUNT", "column": "*"},
"alias": "item_count"
}
],
"groupBy": ["_evaluation_id"]
}
```
This produces a row per evaluation in the group, showing the average score and item count for each.
## Per-Evaluation Selection in Widgets
When creating widgets in the UI for an evaluation group dashboard, the widget creator allows you to select which evaluations to include per aggregation. This is particularly useful for:
* **Metric widgets**: Compare the same metric across specific evaluations
* **Chart widgets**: Compare multiple metrics across specific evaluations
* **Table widgets**: Include different evaluation subsets for different columns
The UI evaluation selector maps directly to the `evaluation_ids` field on aggregation nodes in the query.
## Auto-Recomputation on Group Changes
When evaluations are added to or removed from an evaluation group, all dashboard widgets for that group are automatically recomputed. This ensures your dashboards always reflect the current state of the group.
### How it Works
1. **Membership change detected**: When you add or remove evaluations from a group, the system triggers an asynchronous recomputation workflow
2. **Smart `evaluation_ids` updates**: Widgets whose `evaluation_ids` covered all previous group members are automatically expanded or contracted to reflect the new membership. For example, if a group had evaluations \[A, B] and you add C, widgets covering \[A, B] are updated to \[A, B, C]
3. **Results marked as pending**: Existing widget results are marked with `computation_status: "pending"` while recomputation runs
4. **Recomputation completes**: Each widget is recomputed with the updated evaluation data, and results are updated to `computation_status: "completed"`
This allows for widgets to be updated as new evaluations are added to the group. Any widgets computed across all evaluations in the group will be updated to include the new evaluation.
This is particularly useful for the timeseries widget, where each evaluation is plotted as a member of the x-axis.
## Example: Cross-Evaluation Comparison Dashboard
Here's a full example creating an evaluation group dashboard with multiple widget types.
### Step 1: Create the Dashboard
```python theme={null}
dashboard = client.evaluation_dashboards.create(
name="Weekly Agent Performance",
evaluation_group_id="eval-group-weekly",
tags=["weekly-review"]
)
```
### Step 2: Add a Heading
```python theme={null}
client.evaluation_dashboards.widgets.create(
dashboard_id=dashboard.id,
title="Performance Overview",
type="heading"
)
```
### Step 3: Add Metric Widgets per Evaluation
```python theme={null}
# Average score across all evaluations in the group
client.evaluation_dashboards.widgets.create(
dashboard_id=dashboard.id,
title="Overall Average Score",
type="metric",
query={
"select": [
{
"expression": {
"type": "AGGREGATION",
"function": "AVG",
"column": "overall_score",
"source": "data"
}
}
]
}
)
```
### Step 4: Add a Timeseries Showing Trends
```python theme={null}
client.evaluation_dashboards.widgets.create(
dashboard_id=dashboard.id,
title="Score Trend Over Evaluations",
type="timeseries",
query={
"select": [
{
"expression": {
"type": "AGGREGATION",
"function": "AVG",
"column": "overall_score",
"source": "data"
},
"alias": "avg_score"
},
{
"expression": {
"type": "AGGREGATION",
"function": "AVG",
"column": "accuracy_score",
"source": "data"
},
"alias": "avg_accuracy"
}
]
}
)
```
### Step 5: Add a Table Grouped by Evaluation
```python theme={null}
client.evaluation_dashboards.widgets.create(
dashboard_id=dashboard.id,
title="Per-Evaluation Breakdown",
type="table",
query={
"select": [
{"expression": {"type": "COLUMN", "column": "_evaluation_id"}},
{
"expression": {"type": "AGGREGATION", "function": "COUNT", "column": "*"},
"alias": "items"
},
{
"expression": {"type": "AGGREGATION", "function": "AVG", "column": "overall_score", "source": "data"},
"alias": "avg_score"
},
{
"expression": {
"type": "AGGREGATION",
"function": "PERCENTAGE",
"column": "*",
"params": {
"percentage_filters": {
"conditions": [{"column": "overall_score", "source": "data", "operator": ">=", "value": 85}]
}
}
},
"alias": "pass_rate"
}
],
"groupBy": ["_evaluation_id"]
}
)
```
## Related Documentation
* [Evaluation Dashboards Overview](./overview) - Introduction to dashboards
* [Getting Started](./getting-started) - Create your first dashboard
* [Timeseries Widget](./widget-types/timeseries) - Ideal for group trend visualization
* [Query Language](./query-language) - Complete query syntax reference
* [API Reference](/reference/v5/evaluation-dashboards) - Programmatic dashboard management