> ## Documentation Index
> Fetch the complete documentation index at: https://docs.gp.scale.com/llms.txt
> Use this file to discover all available pages before exploring further.
# Annotation Configuration
> Customize annotation configurations.
By default, the annotation UI which annotators see in SGP shows the test case input, expected output, and output. However, for complex evaluations may want to:
* display data from the trace
* select which parts of test case inputs and test case outputs to display
* modify the layout the annotation UI
The **Annotation Configuration** allows you to do all three.
Here's what an example annotation configuration looks like:
```python theme={null}
from scale_gp.lib.types.data_locator import data_locator # this is a helper to produce
annotation_configuration = dict(
annotation_config_type="flexible", # this is the default, so we could have omitted annotation_config_type entirely.
direction="row", # or "col"
components=[ # 2D array representing how things will be layed out in the UI
[
dict(data_loc=["test_case_output", "output", "string_output"], label="string output"),
dict(data_loc=["test_case_data", "expected_output", "string_expected"]),
],
[
dict(data_loc=data_locator.test_case_output.output["messages_output"]), # The data_locator is an easier way of producing data_locs
],
[
dict(data_loc=data_locator.trace["tool_call"]).input["string_input"] # reference the "tool_call" node from the trace earlier
]
]
)
evaluation = sgp_client.evaluations.create(
account_id=ACCOUNT_ID,
name=f"example flexible evaluation",
description="This is a test evaluation",
type="builder",
evaluation_config_id=evaluation_config.id, # You need to create an evaluation config, evaluation_dataset, and application spec/variant
evaluation_dataset_id=flexible_evaluation_dataset.id,
application_variant_id=application_variant.id,
application_spec_id=application.id,
annotation_config=annotation_configuration,
)
```
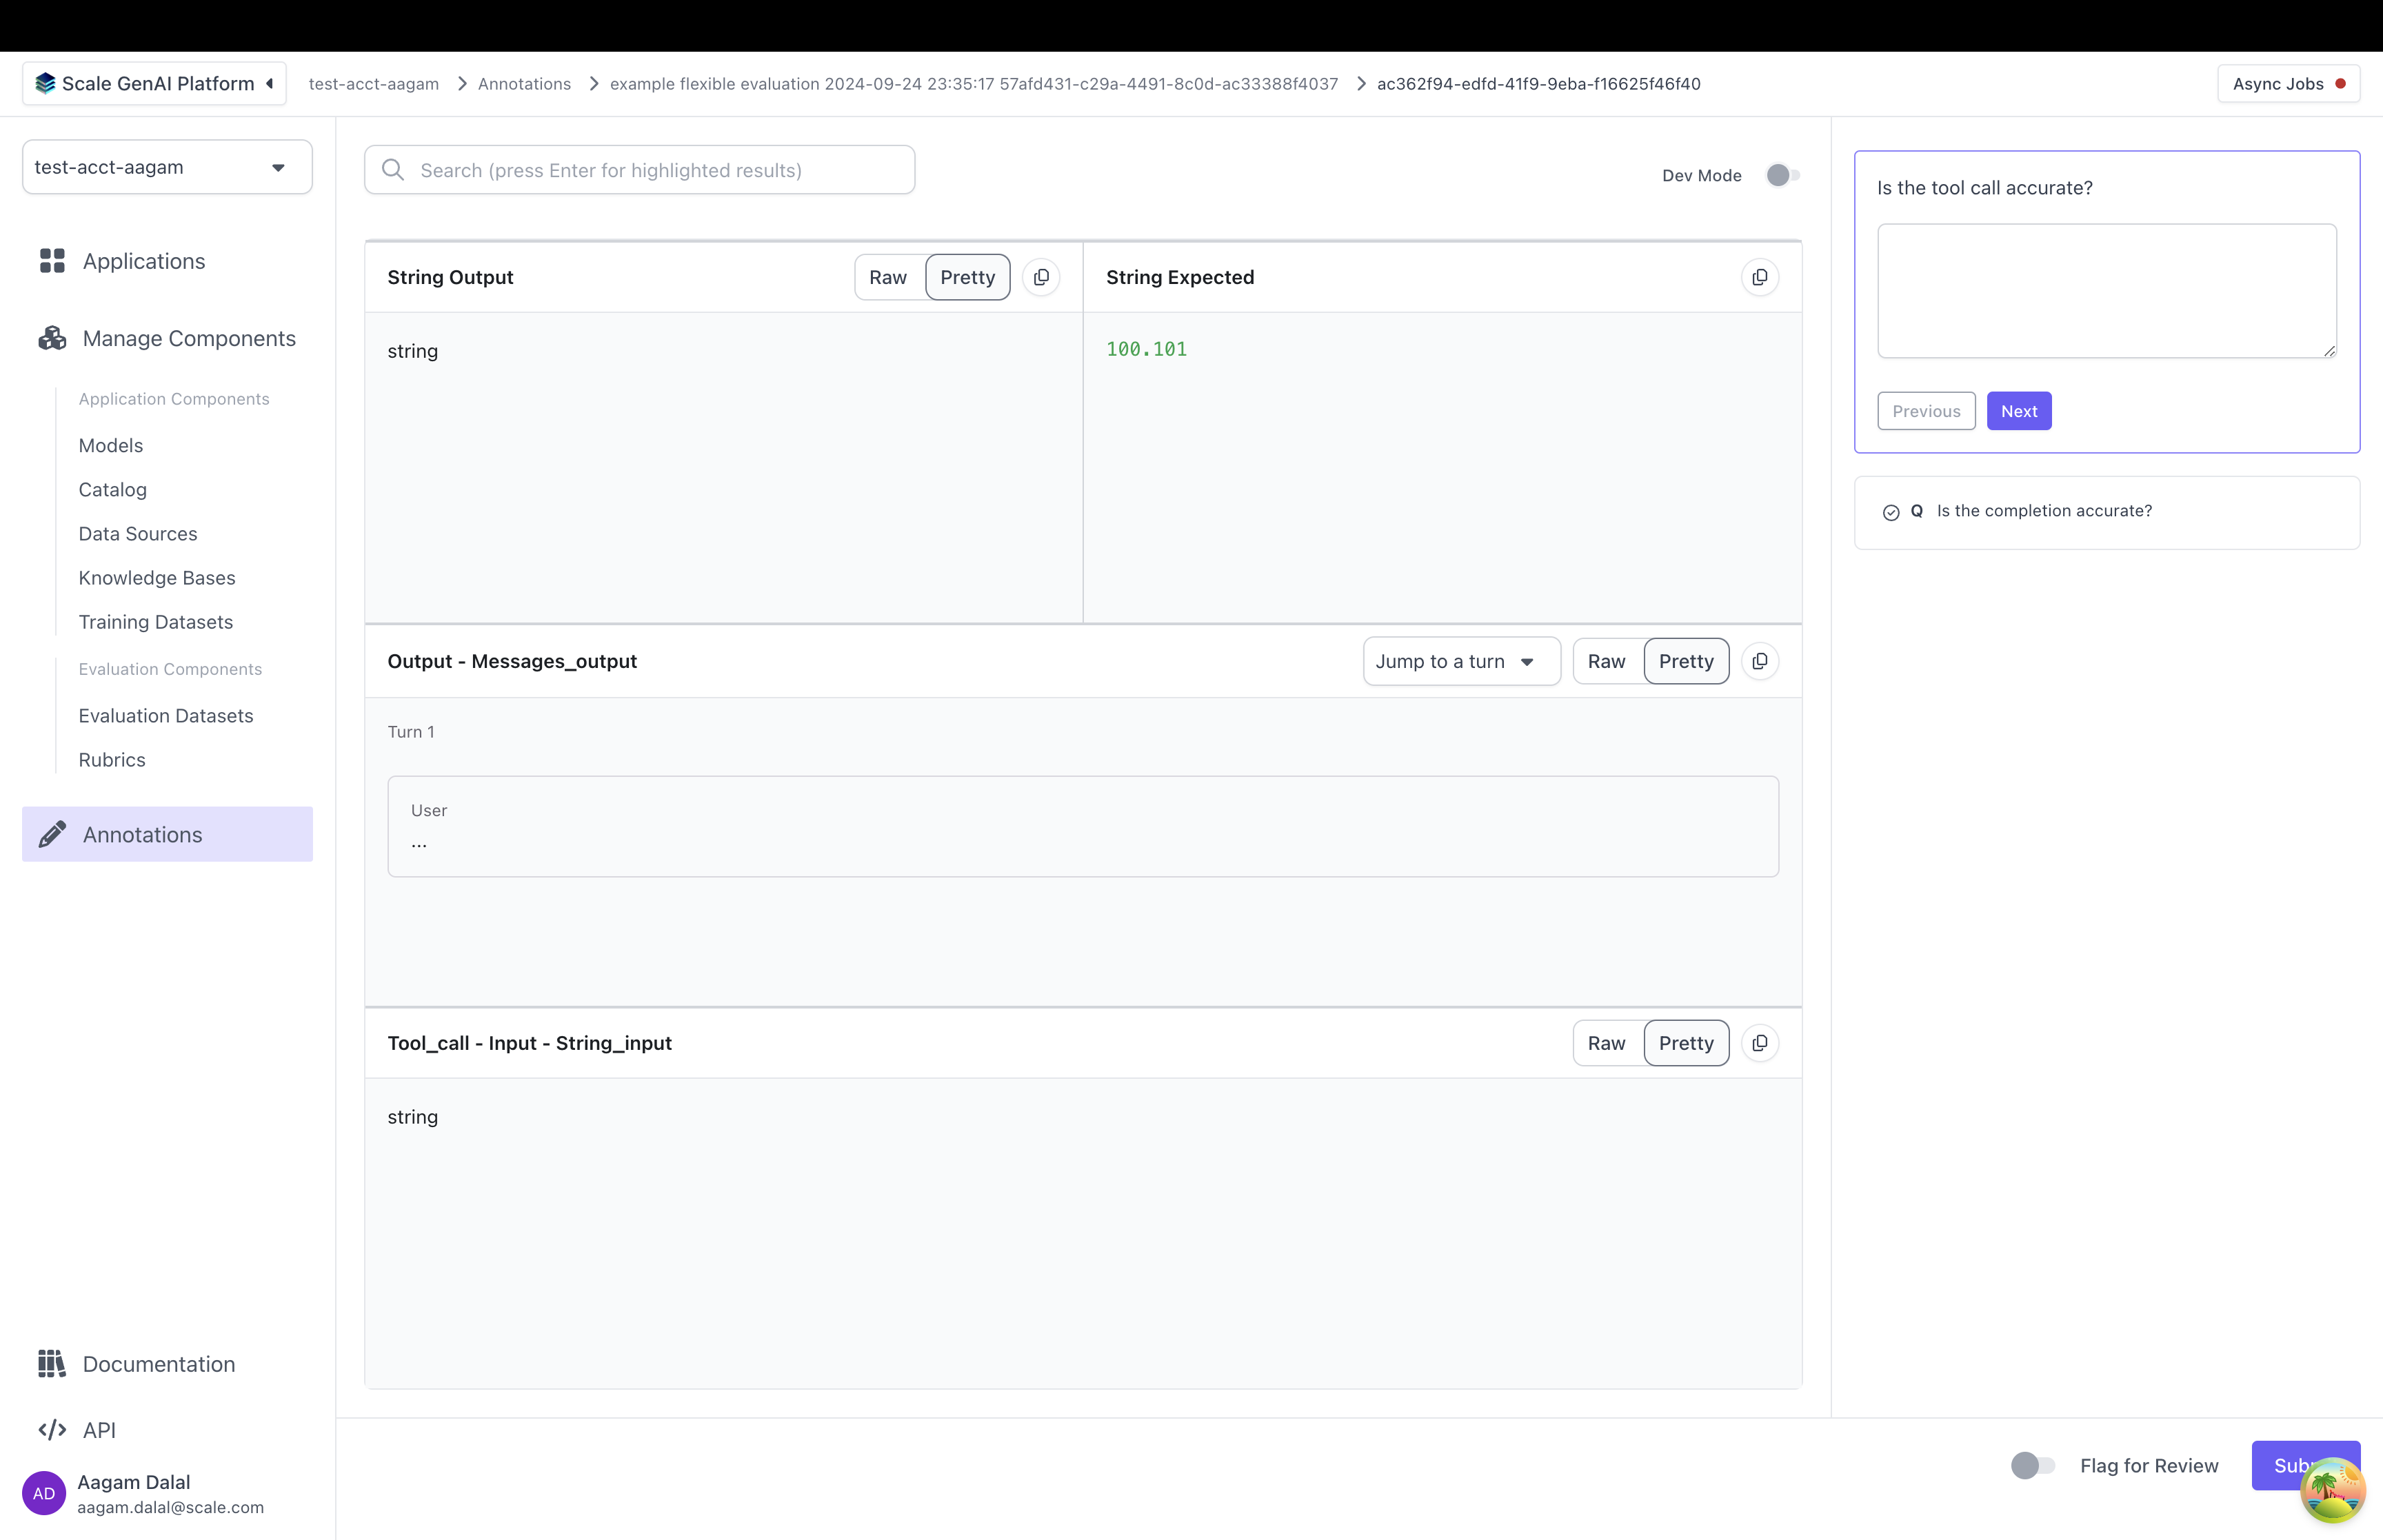
When a contributor annotates this evaluation in the UI, they will see an annotation UI that looks something like this:
Let's break down how a custom annotation config is set up:
* `annotation_config_type`: by default this is "flexible". The other types are "summarization" and "multiturn" which make it easier to work with specific use cases
* `components`: this is a 2D list of annotation items. Each annotation item points to somewhere in the test case data, test case output, or trace. When the annotator grades the test case output, they will see data pulled from each location
* Each annotation item has a "data\_loc" field and an optional "label" field. The "data\_loc" is an array that points to where annotation data should be pulled from. The "label" is a name to be displayed to a user for the "data\_loc".
> ⚠️ if a "data\_loc" points somewhere that doesn't exist for one or more test cases, you will not be able to create the evaluation.
* `direction`: by default "row". Decides whether components are laid out as rows or as columns
Here's are some examples of how different arrangements of components produce different UIs:
`data_loc`s can take any of these shapes:
| `data_locator` Helper | `data_loc` array | Meaning |
| :------------------------------------------------------------------------ | :---------------------------------------------------------------------------- | :----------------------------------------------------------------- |
| `data_locator.test_case_data.input` | `["test_case_data", "input"]` | Display the entire input from the test case |
| `data_locator.test_case_data.input["\"]` | `["test_case_data", "input", "\"]` | Displays a single key from the input |
| `data_locator.test_case_data.expected` | `["test_case_data", "expected_output"]` | Display the entire expected output from the test case |
| `data_locator.test_case_data.expected["\"]` | `["test_case_data", "expected_output", "\"]` | Display a single key from the expected output |
| `data_locator.test_case_output` | `["test_case_output", "output"]` | Display the entire output from the test case output |
| `data_locator.test_case_output["\
 Let's break down how a custom annotation config is set up:
* `annotation_config_type`: by default this is "flexible". The other types are "summarization" and "multiturn" which make it easier to work with specific use cases
* `components`: this is a 2D list of annotation items. Each annotation item points to somewhere in the test case data, test case output, or trace. When the annotator grades the test case output, they will see data pulled from each location
* Each annotation item has a "data\_loc" field and an optional "label" field. The "data\_loc" is an array that points to where annotation data should be pulled from. The "label" is a name to be displayed to a user for the "data\_loc".
> ⚠️ if a "data\_loc" points somewhere that doesn't exist for one or more test cases, you will not be able to create the evaluation.
* `direction`: by default "row". Decides whether components are laid out as rows or as columns
Here's are some examples of how different arrangements of components produce different UIs:
Let's break down how a custom annotation config is set up:
* `annotation_config_type`: by default this is "flexible". The other types are "summarization" and "multiturn" which make it easier to work with specific use cases
* `components`: this is a 2D list of annotation items. Each annotation item points to somewhere in the test case data, test case output, or trace. When the annotator grades the test case output, they will see data pulled from each location
* Each annotation item has a "data\_loc" field and an optional "label" field. The "data\_loc" is an array that points to where annotation data should be pulled from. The "label" is a name to be displayed to a user for the "data\_loc".
> ⚠️ if a "data\_loc" points somewhere that doesn't exist for one or more test cases, you will not be able to create the evaluation.
* `direction`: by default "row". Decides whether components are laid out as rows or as columns
Here's are some examples of how different arrangements of components produce different UIs:
 `data_loc`s can take any of these shapes:
| `data_locator` Helper | `data_loc` array | Meaning |
| :------------------------------------------------------------------------ | :---------------------------------------------------------------------------- | :----------------------------------------------------------------- |
| `data_locator.test_case_data.input` | `["test_case_data", "input"]` | Display the entire input from the test case |
| `data_locator.test_case_data.input["\"]` | `["test_case_data", "input", "\"]` | Displays a single key from the input |
| `data_locator.test_case_data.expected` | `["test_case_data", "expected_output"]` | Display the entire expected output from the test case |
| `data_locator.test_case_data.expected["\
`data_loc`s can take any of these shapes:
| `data_locator` Helper | `data_loc` array | Meaning |
| :------------------------------------------------------------------------ | :---------------------------------------------------------------------------- | :----------------------------------------------------------------- |
| `data_locator.test_case_data.input` | `["test_case_data", "input"]` | Display the entire input from the test case |
| `data_locator.test_case_data.input["\"]` | `["test_case_data", "input", "\"]` | Displays a single key from the input |
| `data_locator.test_case_data.expected` | `["test_case_data", "expected_output"]` | Display the entire expected output from the test case |
| `data_locator.test_case_data.expected["\