> ## Documentation Index
> Fetch the complete documentation index at: https://docs.gp.scale.com/llms.txt
> Use this file to discover all available pages before exploring further.
# Guide to automating evals on Workflows
> Tutorial workflow for automated evals for your agent
This guide walks you through building an automated evaluation workflow in Workflows. You'll learn how to query data, call your agent, join ground truth datasets, run LLM-as-Judge evaluations, and schedule everything to run automatically.
### Step 1: Connect to the data source
Start by navigating to `Workflows` in SGP. Choose from the available data connection options: Traces, Data Sources, or CSV. We add more options based on user demand.
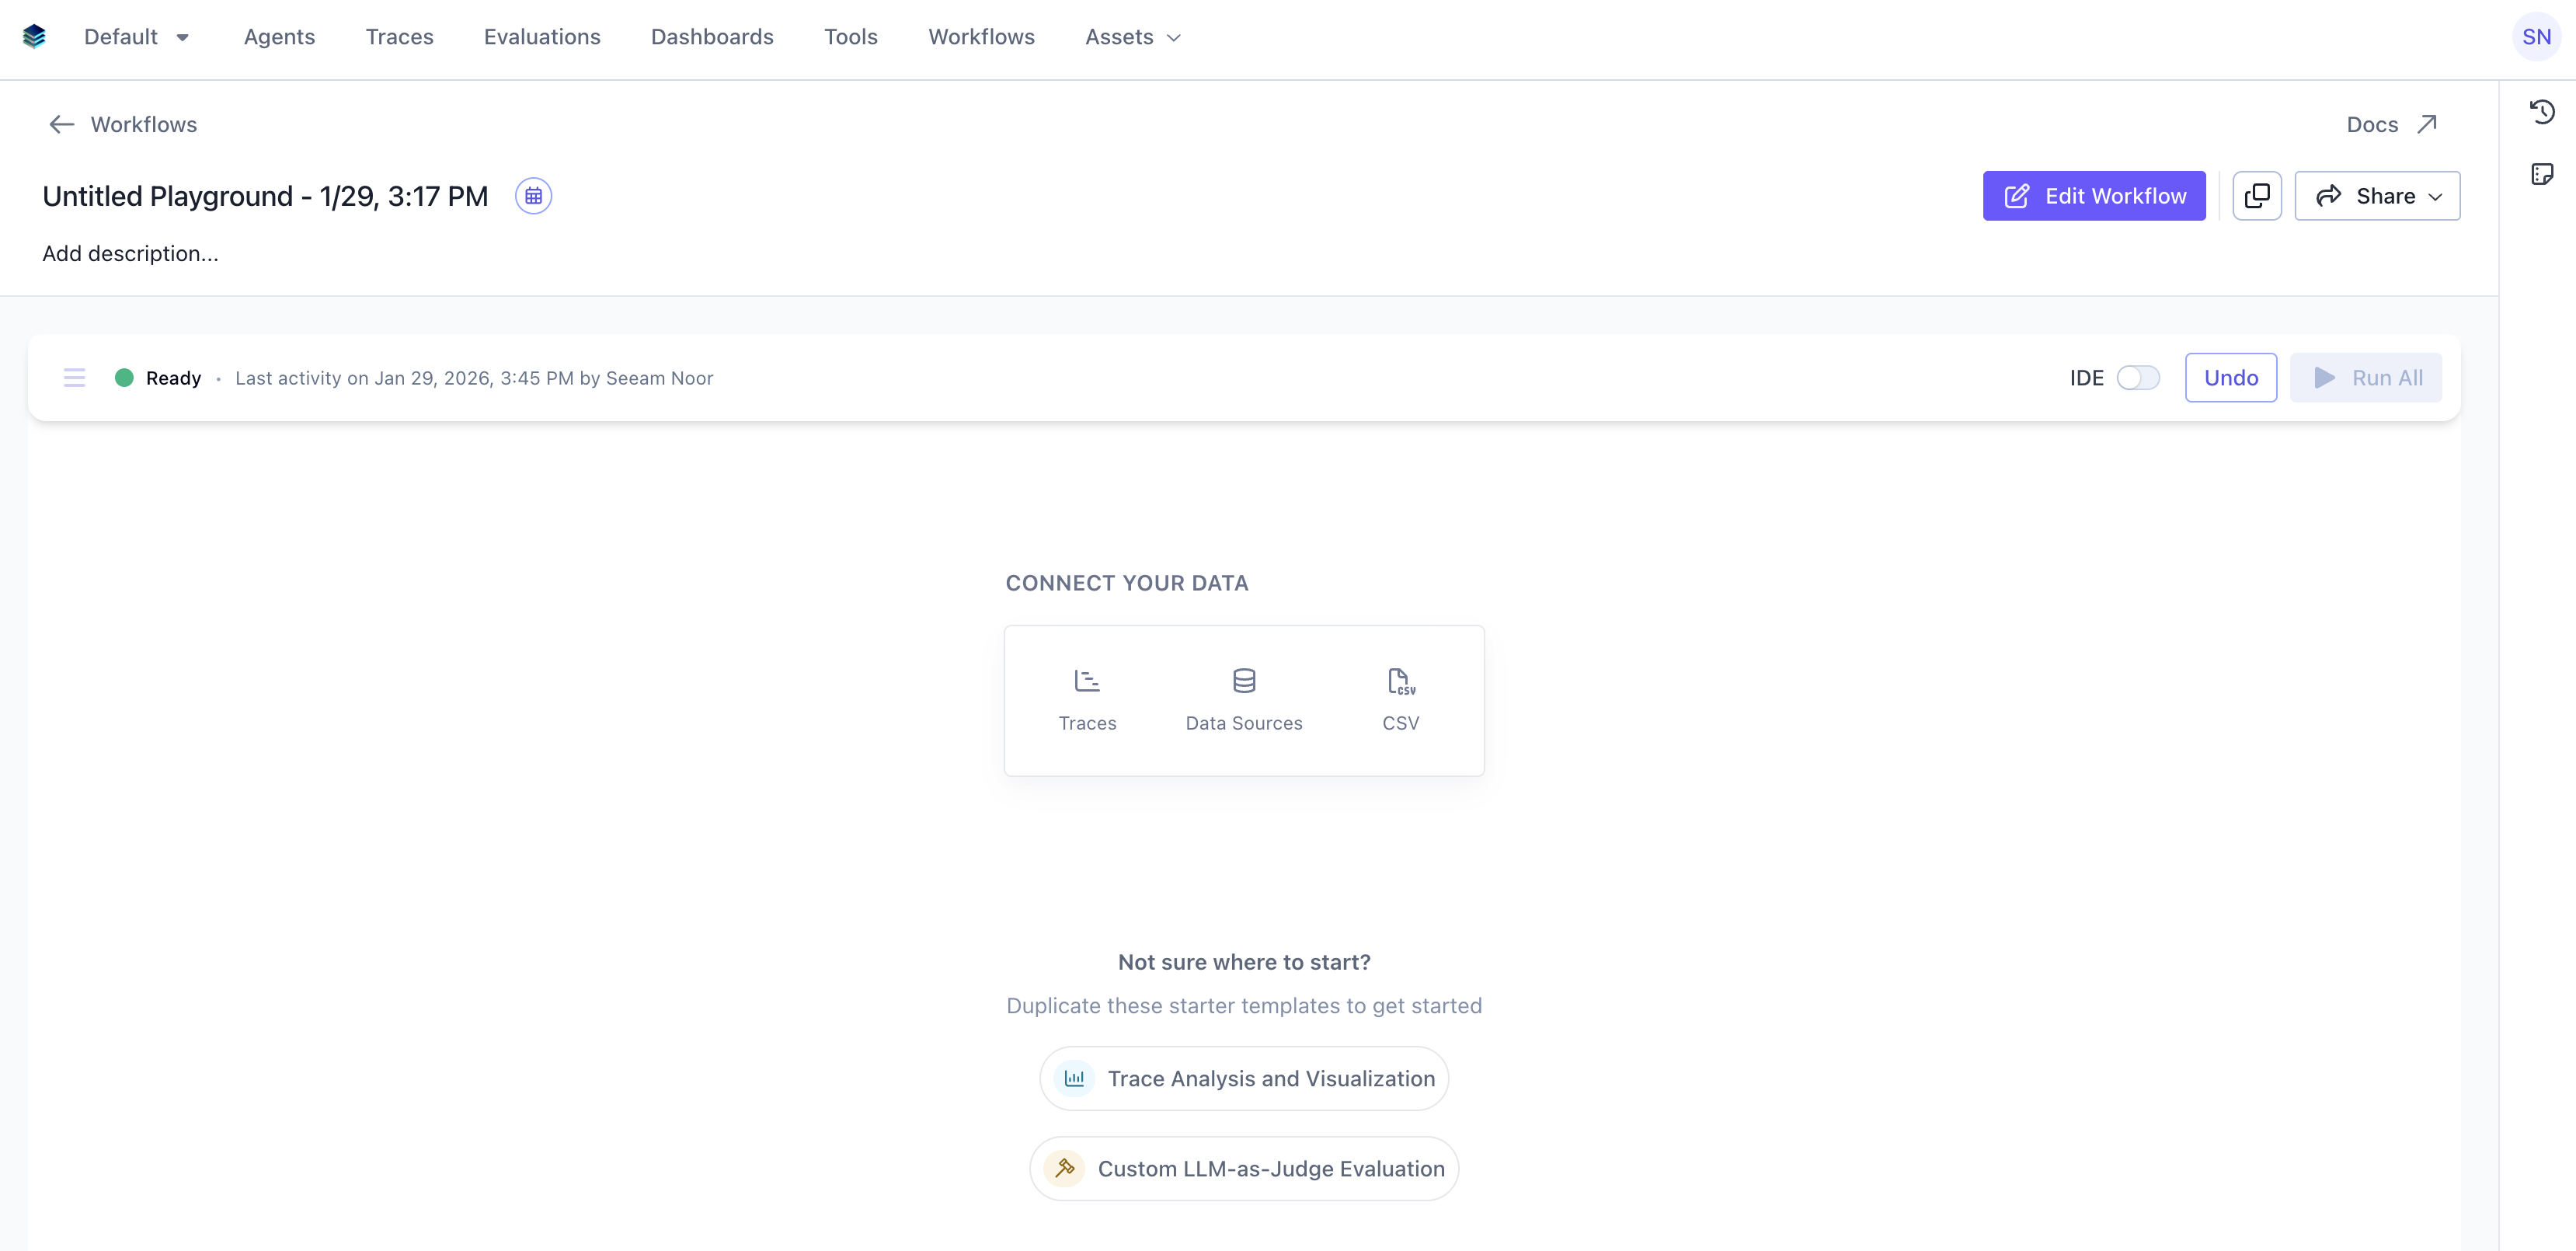 For this example, we'll connect to a Snowflake data source. The data source has a list of supermarket items with product name and description that we must categorize using our agent.
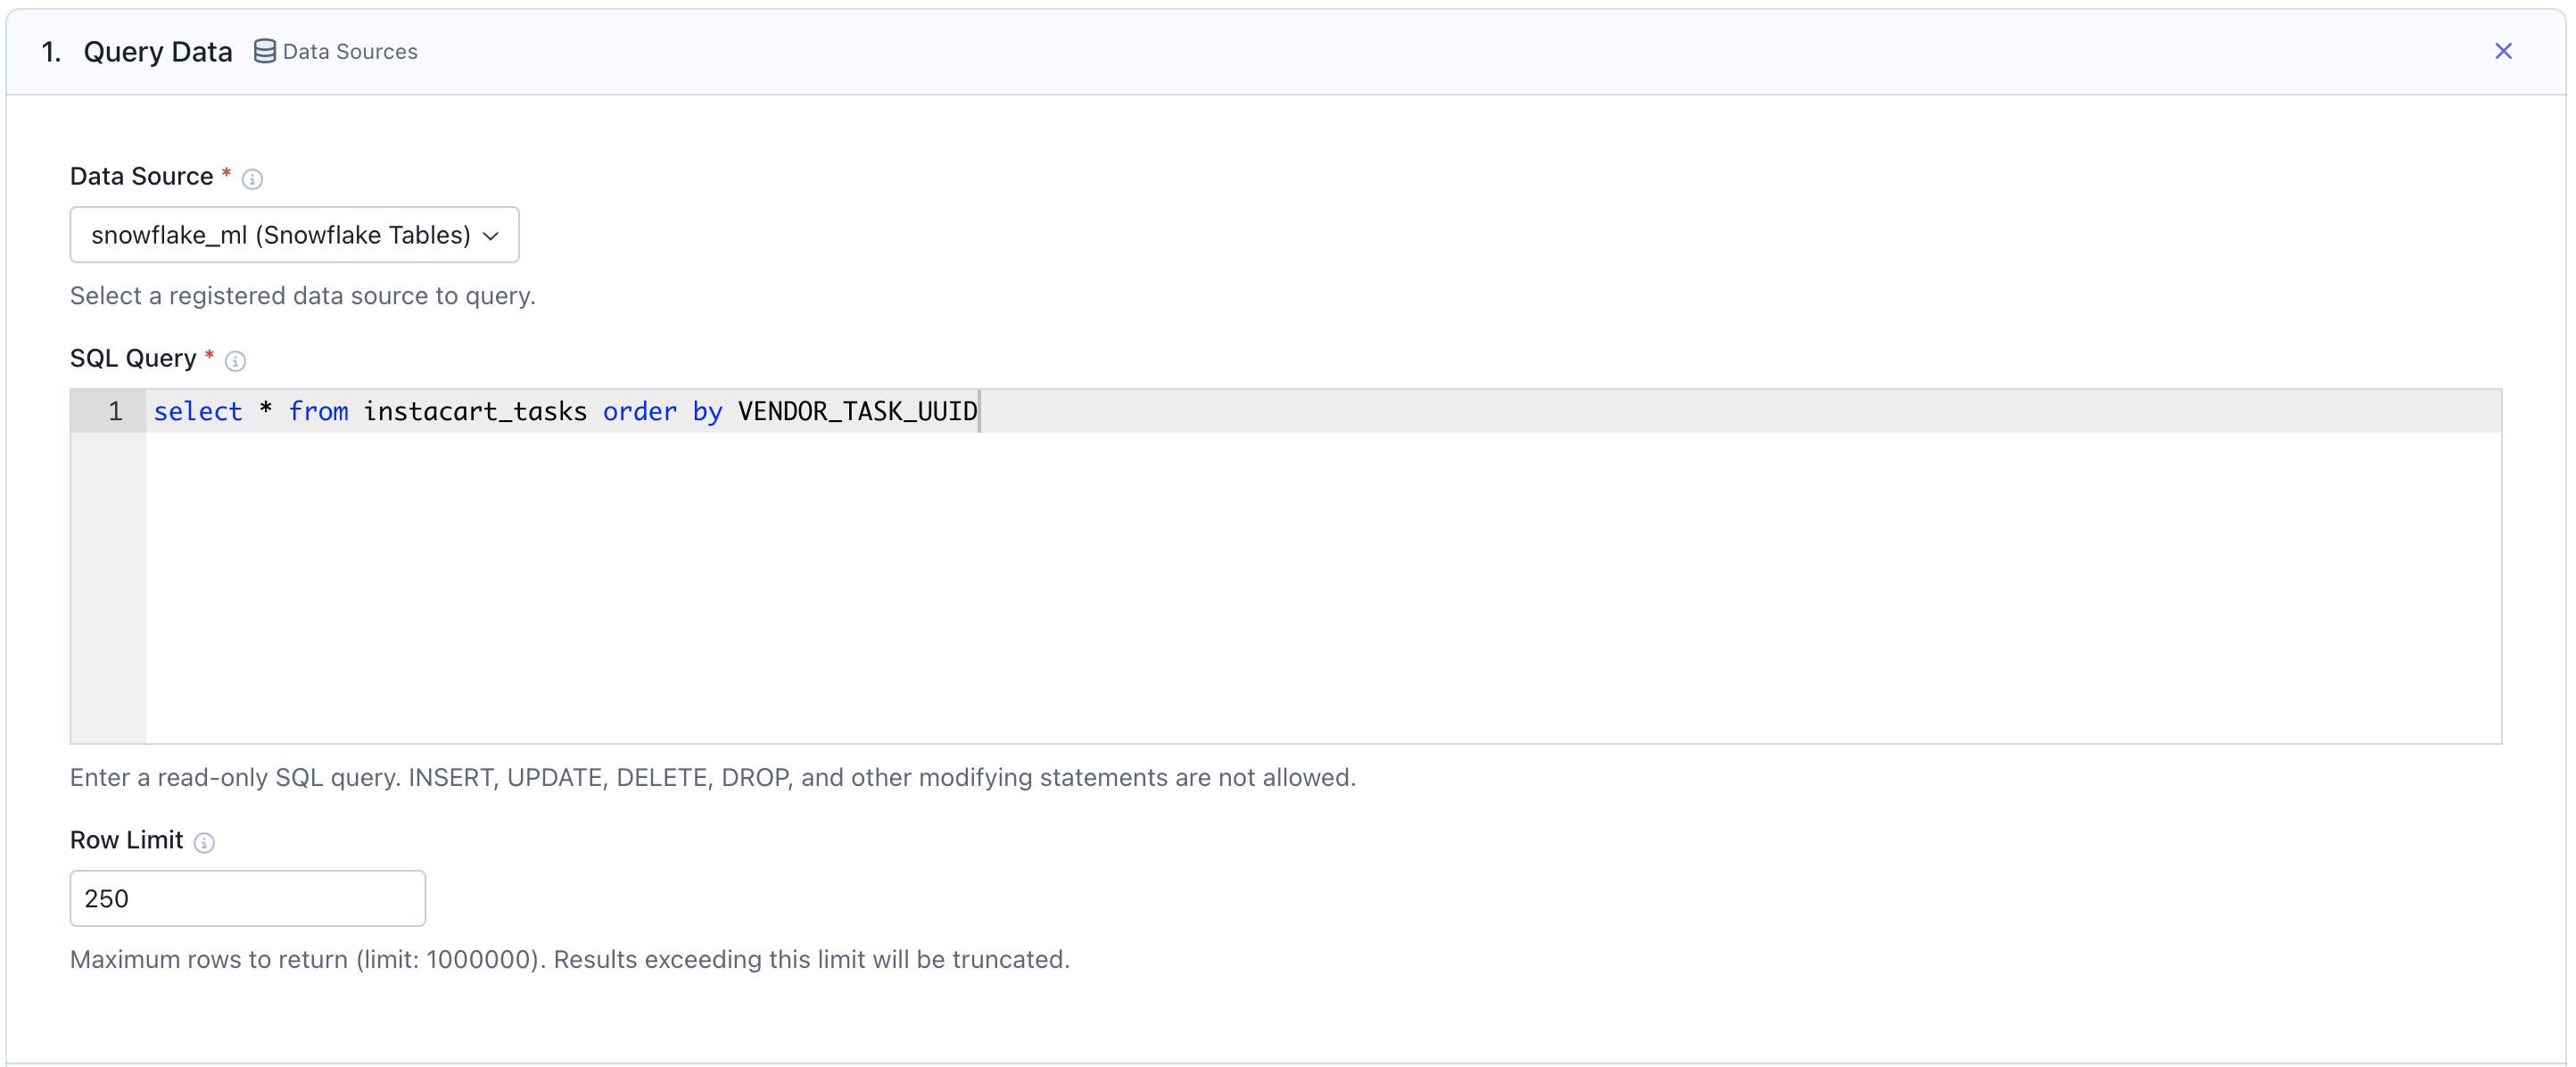 Select `Data Sources`, then choose your registered Snowflake connection from the dropdown. Write a SQL query to fetch the data you want to evaluate. You can set a `Row Limit` up to 1,000,000.
Only read-only SQL queries are allowed. INSERT, UPDATE, DELETE, DROP, and other modifying statements are not permitted.
### Step 2: Call your agent for completions
Use a `Call Agent` card to generate outputs from your agent for each row in your dataset. The `Agentex` agent you select has to be deployed on your SGP instance to be available in the dropdown.
Select `Data Sources`, then choose your registered Snowflake connection from the dropdown. Write a SQL query to fetch the data you want to evaluate. You can set a `Row Limit` up to 1,000,000.
Only read-only SQL queries are allowed. INSERT, UPDATE, DELETE, DROP, and other modifying statements are not permitted.
### Step 2: Call your agent for completions
Use a `Call Agent` card to generate outputs from your agent for each row in your dataset. The `Agentex` agent you select has to be deployed on your SGP instance to be available in the dropdown.
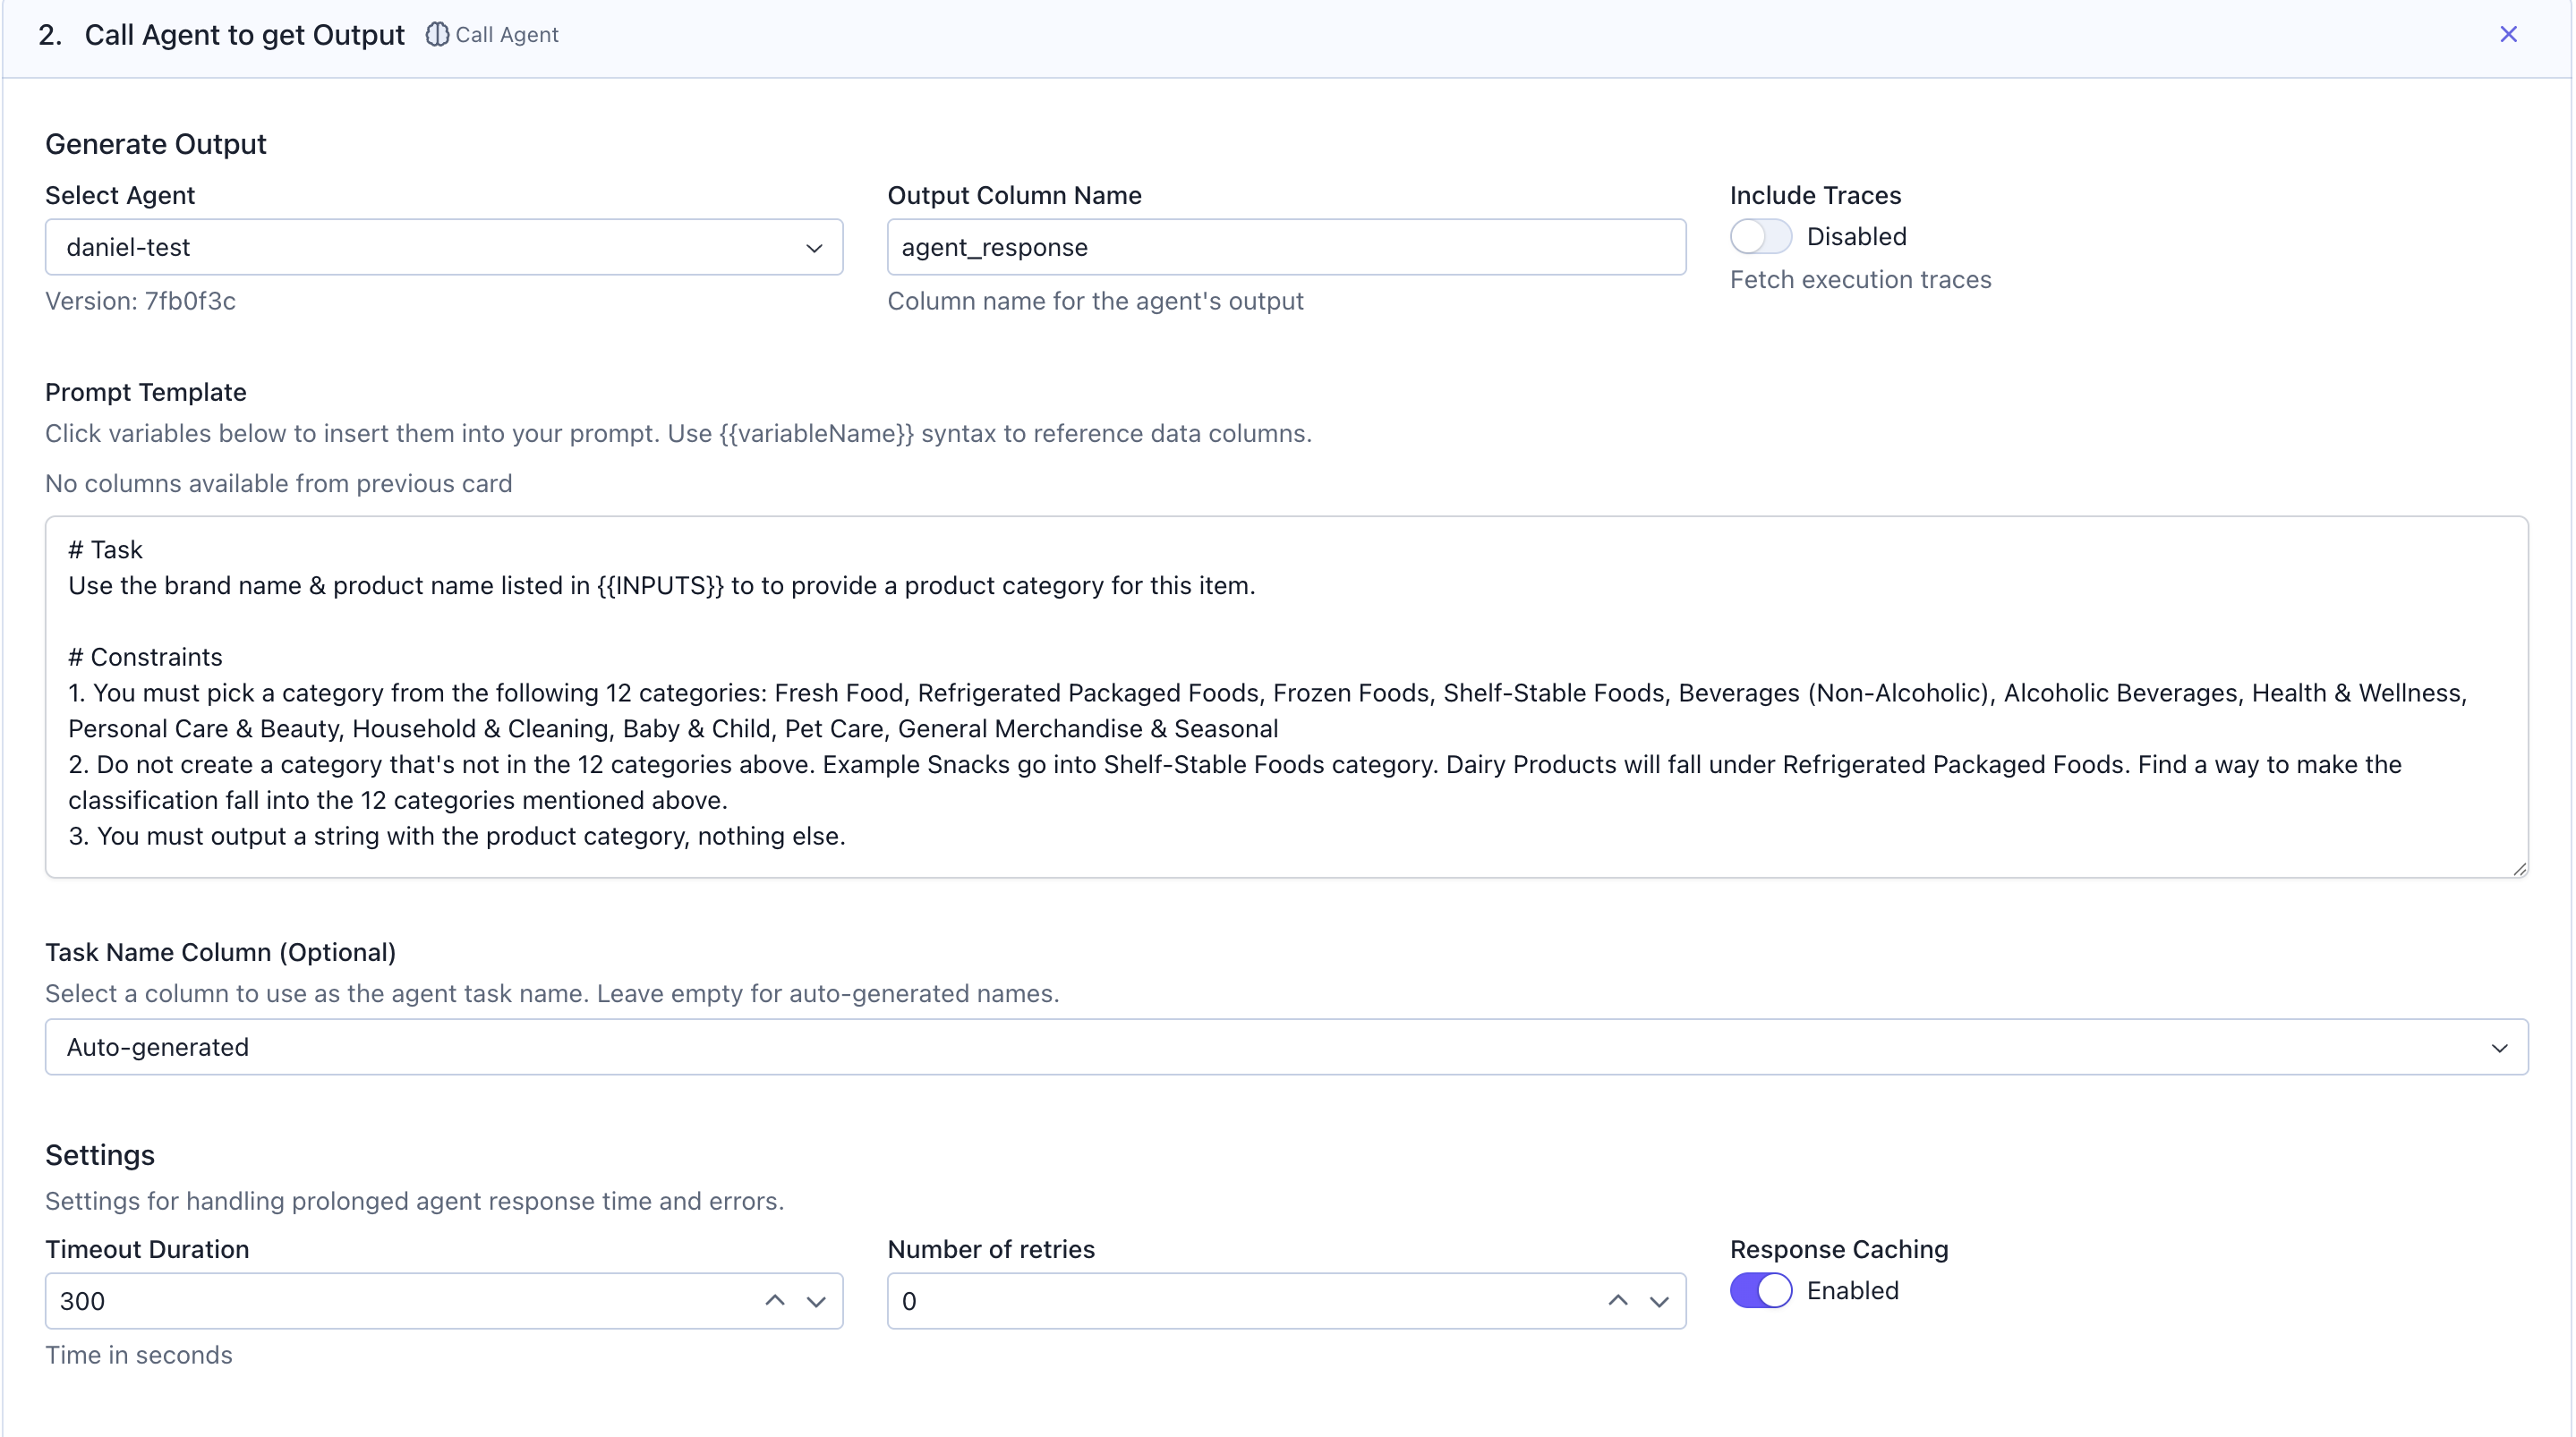 In this example, we ensure our agent categorizes the supermarket items appropriately using our prompt. The configurations are:
* `Select Agent`: Choose the agent you want to evaluate from the dropdown
* `Output Column Name`: Specify the column name where agent responses will be stored (e.g., `agent_response`)
* `Include Traces`: Toggle on if you want to fetch execution traces for debugging
* `Prompt Template`: Write your prompt using `{{variableName}}` syntax to reference columns from your data. Click the variable buttons to insert column references automatically.
Under `Settings`, you can configure:
* `Timeout Duration`: Maximum time in seconds to wait for agent responses (default: 300)
* `Number of retries`: How many times to retry failed calls
* `Response Caching`: Enable to cache responses and avoid redundant API calls
Under `Advanced` settings, you can configure the `completion criteria` that determines when to stop polling for agent messages and the `batch size` that determines how many rows to process concurrently. This card generates the agent task IDs immediately as output.
In this example, we ensure our agent categorizes the supermarket items appropriately using our prompt. The configurations are:
* `Select Agent`: Choose the agent you want to evaluate from the dropdown
* `Output Column Name`: Specify the column name where agent responses will be stored (e.g., `agent_response`)
* `Include Traces`: Toggle on if you want to fetch execution traces for debugging
* `Prompt Template`: Write your prompt using `{{variableName}}` syntax to reference columns from your data. Click the variable buttons to insert column references automatically.
Under `Settings`, you can configure:
* `Timeout Duration`: Maximum time in seconds to wait for agent responses (default: 300)
* `Number of retries`: How many times to retry failed calls
* `Response Caching`: Enable to cache responses and avoid redundant API calls
Under `Advanced` settings, you can configure the `completion criteria` that determines when to stop polling for agent messages and the `batch size` that determines how many rows to process concurrently. This card generates the agent task IDs immediately as output.
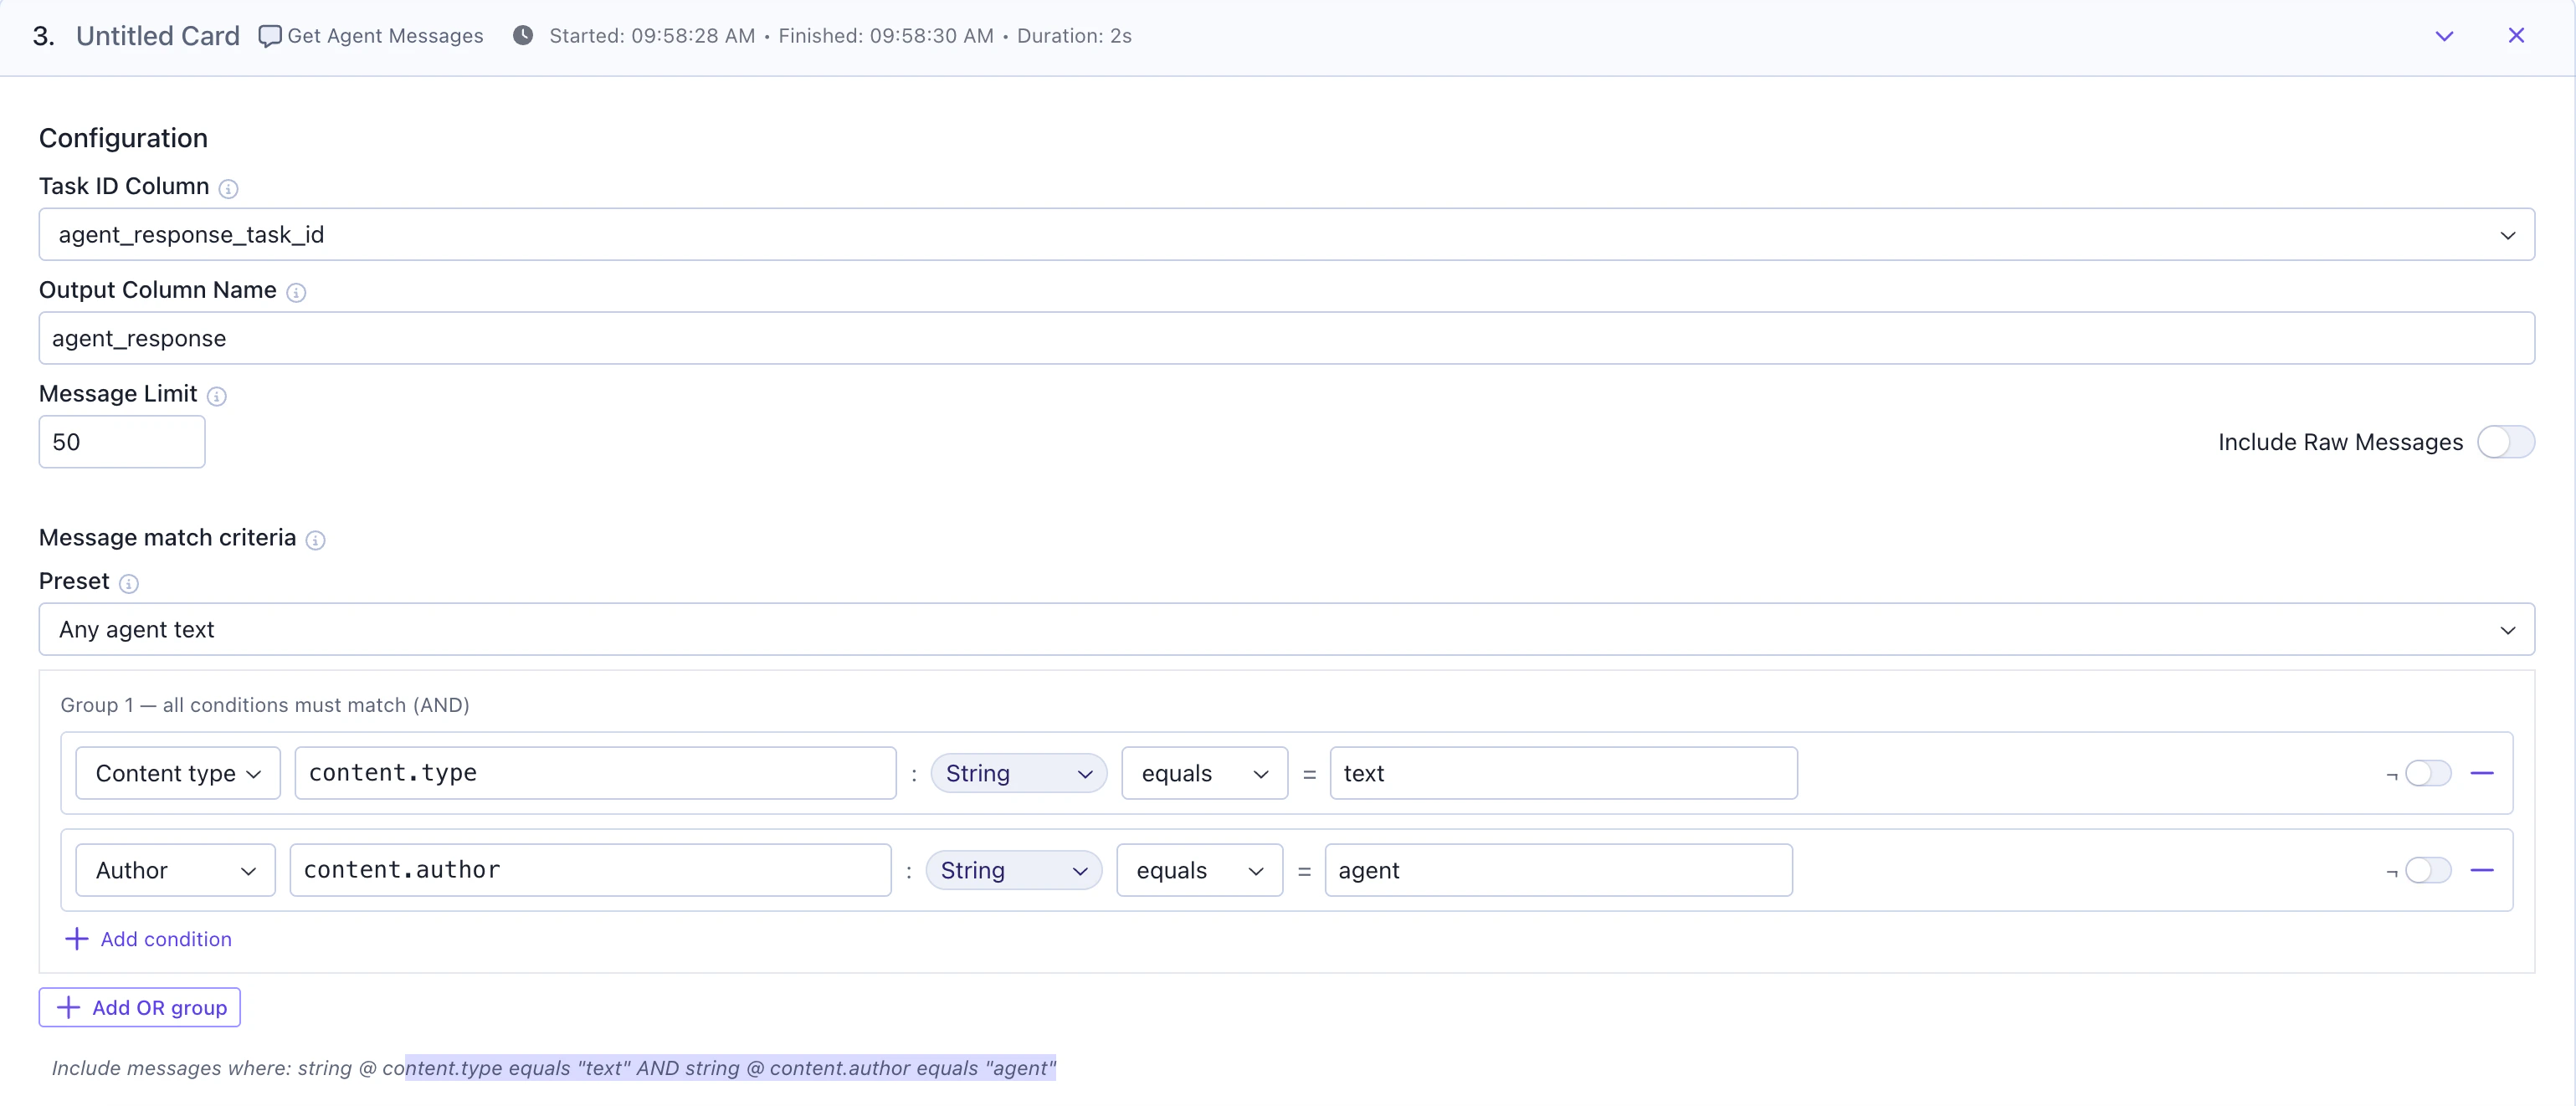 Once you have set up the `Call agent` card, you need to use the `Get agent messages` card right after to get the agent's responses into the dataframe. The `Get agent messages` card takes the `agent task IDs` created in the previous card as input, along with configuration options such as agent `message limits` and `matching criteria`, to receive exactly what you need from the agent response (1st message, last message, tool calls, etc.). The 2-part implementation provides flexibility where you can get the agent response in the 2nd card without having to wait for all the tasks in the 1st card to finish.
### Step 3: Join data from another workflow (ex: Ground Truth)
Use the `Join Workflow` card to bring in data from another Workflows workflow—such as a ground truth dataset for comparison. Here we will compare our agent's categorization against the ground truth categorization for each product.
Once you have set up the `Call agent` card, you need to use the `Get agent messages` card right after to get the agent's responses into the dataframe. The `Get agent messages` card takes the `agent task IDs` created in the previous card as input, along with configuration options such as agent `message limits` and `matching criteria`, to receive exactly what you need from the agent response (1st message, last message, tool calls, etc.). The 2-part implementation provides flexibility where you can get the agent response in the 2nd card without having to wait for all the tasks in the 1st card to finish.
### Step 3: Join data from another workflow (ex: Ground Truth)
Use the `Join Workflow` card to bring in data from another Workflows workflow—such as a ground truth dataset for comparison. Here we will compare our agent's categorization against the ground truth categorization for each product.
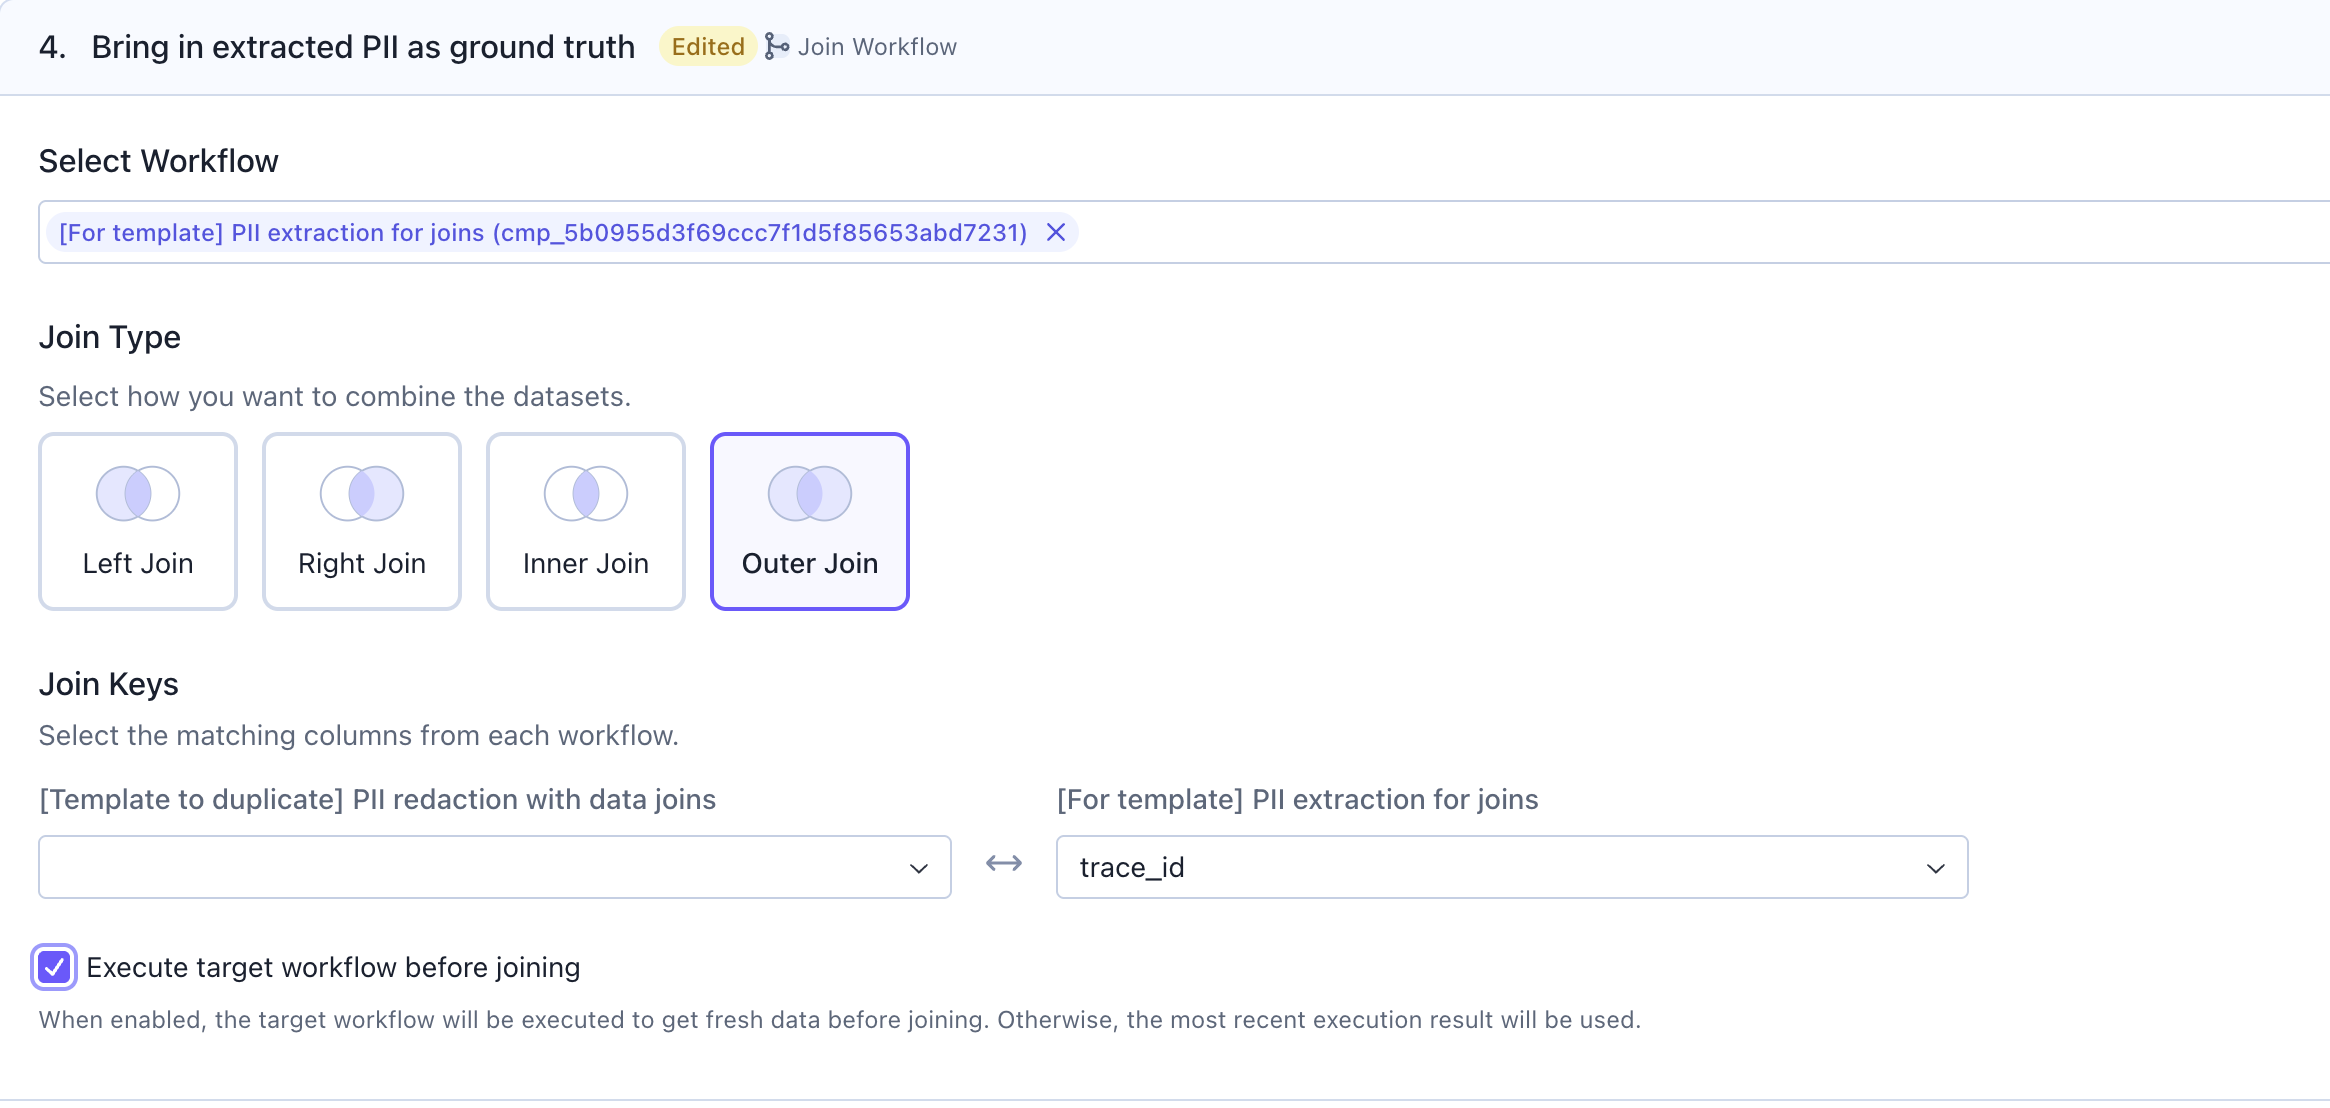 1. `Select Workflow`: Choose the workflow containing your ground truth or reference data
2. `Join Type`: Select how you want to combine the datasets:
* `Left Join`: Keep all rows from the current workflow
* `Right Join`: Keep all rows from the target workflow
* `Inner Join`: Keep only matching rows
* `Outer Join`: Keep all rows from both workflows
3. `Join Keys`: Select the matching columns from each workflow (e.g., `trace_id`)
4. `Execute target workflow before joining`: Enable this to get fresh data from the target workflow; otherwise, the most recent execution result will be used
### Step 4: Use the LLM as Judge card to do evals
Add an `LLM as Judge` card to evaluate your agent's outputs against the ground truth.
1. `Select Workflow`: Choose the workflow containing your ground truth or reference data
2. `Join Type`: Select how you want to combine the datasets:
* `Left Join`: Keep all rows from the current workflow
* `Right Join`: Keep all rows from the target workflow
* `Inner Join`: Keep only matching rows
* `Outer Join`: Keep all rows from both workflows
3. `Join Keys`: Select the matching columns from each workflow (e.g., `trace_id`)
4. `Execute target workflow before joining`: Enable this to get fresh data from the target workflow; otherwise, the most recent execution result will be used
### Step 4: Use the LLM as Judge card to do evals
Add an `LLM as Judge` card to evaluate your agent's outputs against the ground truth.
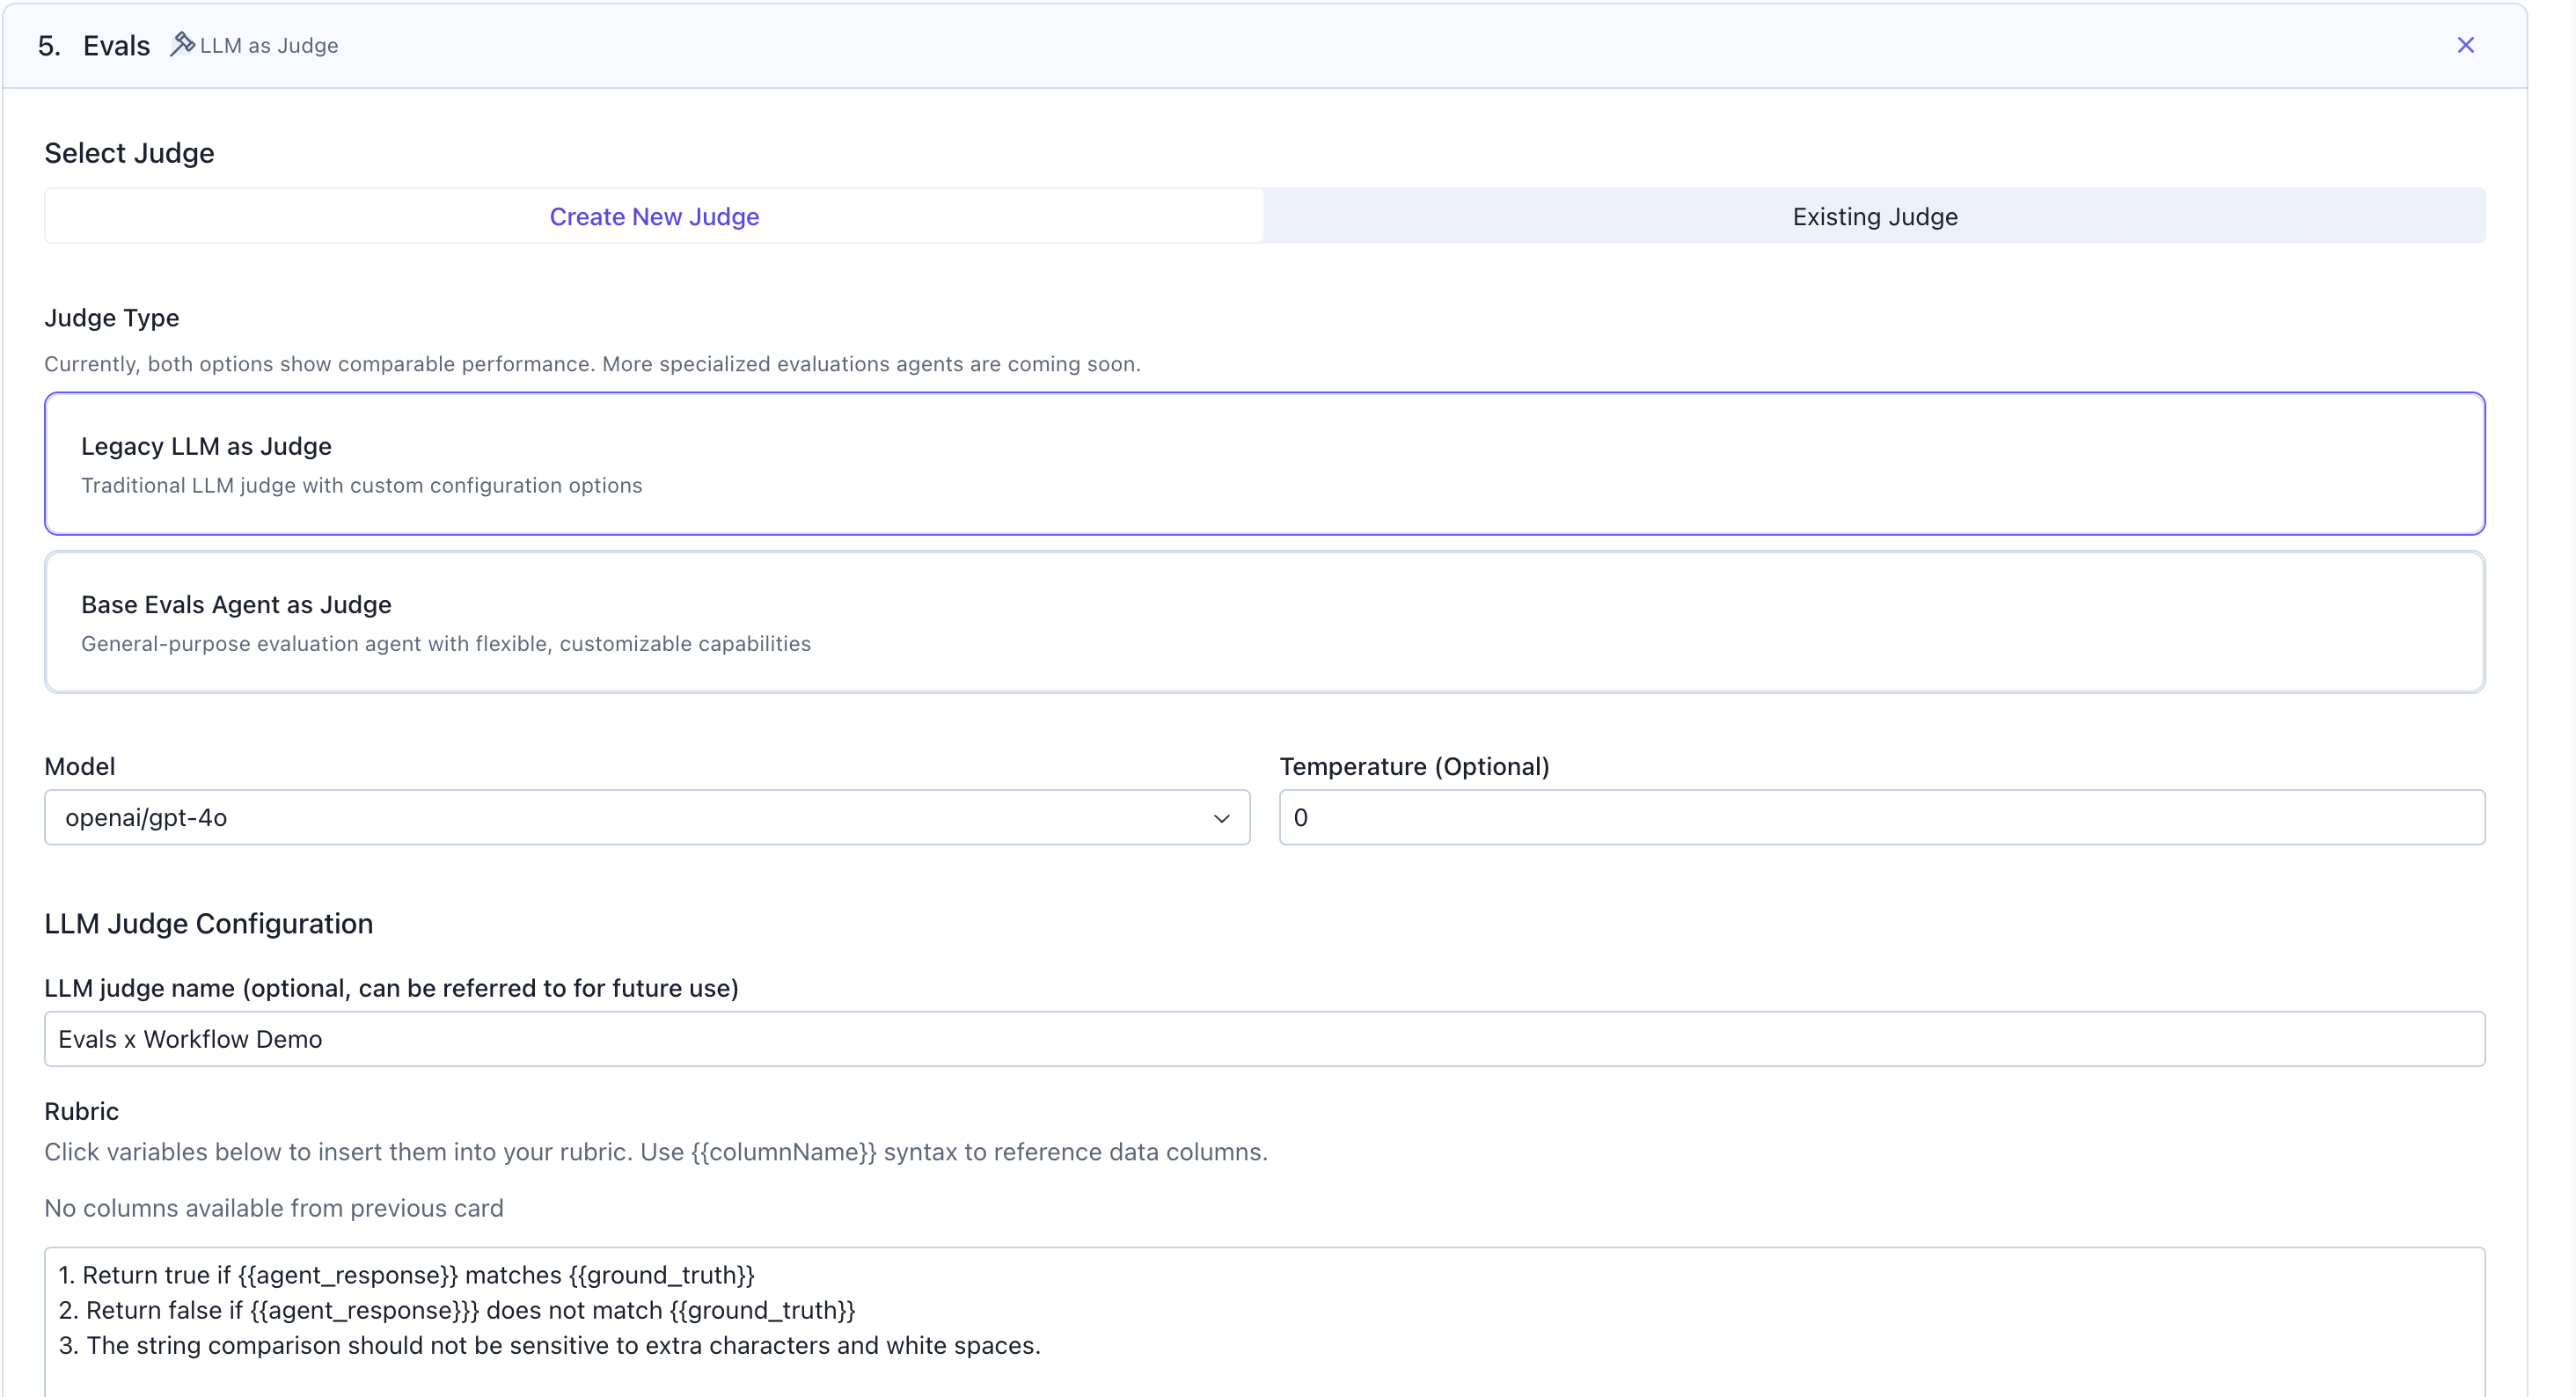 1. `Select Judge`: Choose to create a new judge or use an existing one
2. `Judge Type`: Select from available options like
* `Legacy LLM as Judge (recommended)`: Traditional LLM judge with custom configuration that covers most use cases
* `Base Evals Agent as Judge`: General-purpose evaluation agent with flexible capabilities
3. `Model`: Choose the LLM model to use for judging (e.g., `openai/gpt-4o`)
4. `Temperature`: Set to 0 for deterministic outputs
5. `LLM Judge Name`: Give your judge a name for future usage
6. `Rubric`: Define evaluation criteria. Use `{{columnName}}` to reference data columns
After configuring the judge, scroll down to the `Evaluation Details` section to export your results as an evaluation that can be accessed later anytime, which is helpful if you are running the evaluations on a schedule.
1. `Select Judge`: Choose to create a new judge or use an existing one
2. `Judge Type`: Select from available options like
* `Legacy LLM as Judge (recommended)`: Traditional LLM judge with custom configuration that covers most use cases
* `Base Evals Agent as Judge`: General-purpose evaluation agent with flexible capabilities
3. `Model`: Choose the LLM model to use for judging (e.g., `openai/gpt-4o`)
4. `Temperature`: Set to 0 for deterministic outputs
5. `LLM Judge Name`: Give your judge a name for future usage
6. `Rubric`: Define evaluation criteria. Use `{{columnName}}` to reference data columns
After configuring the judge, scroll down to the `Evaluation Details` section to export your results as an evaluation that can be accessed later anytime, which is helpful if you are running the evaluations on a schedule.
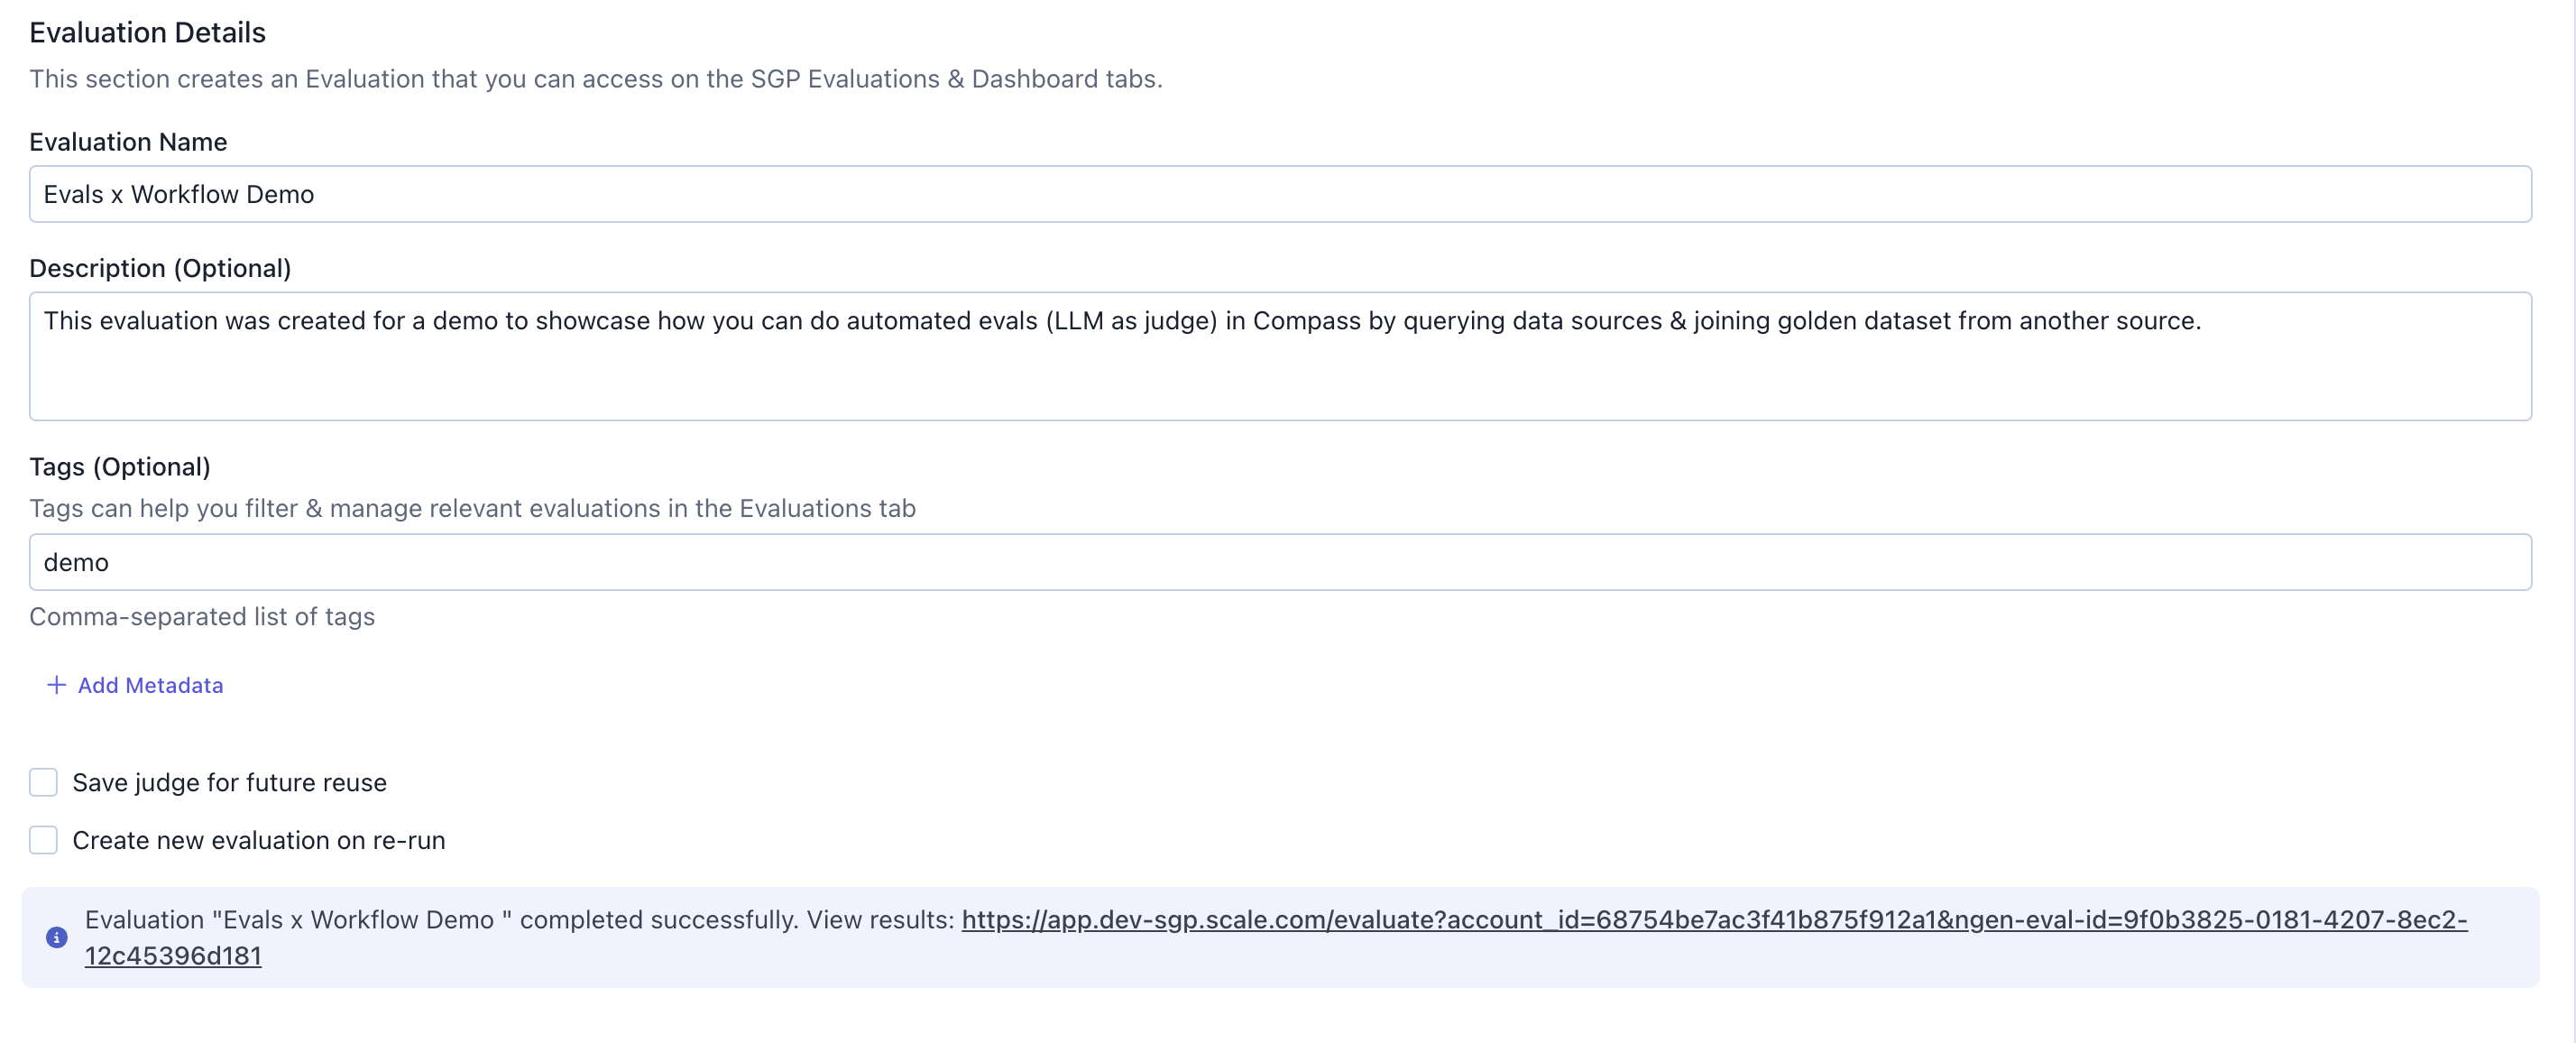 * `Evaluation Name`: A descriptive name for your evaluation
* `Description`: Explain what this evaluation measures
* `Tags`: Add tags to filter and organize evaluations by groups later
* `Save judge for future reuse`: Check to save this judge configuration and use it from the existing judge dropdown in other workflows
* `Create new evaluation on re-run`: Check to create a new evaluation each time the workflow runs
Every time you run this LLM as judge card, you'll see a success message with a direct link to view your evaluation results. Depending on what configurations you selected, a new evaluation will be created or the old one will be replaced. They can be accessed and referenced in the `Evaluations` and `Dashboards` tabs anytime respectively.
### Step 5: Open the evals in Evaluations tab or Dashboard tab
Navigate to the `Evaluations` tab in SGP to view your evaluation results. You can search, filter by date range, and filter by tags to find specific evaluations.
* `Evaluation Name`: A descriptive name for your evaluation
* `Description`: Explain what this evaluation measures
* `Tags`: Add tags to filter and organize evaluations by groups later
* `Save judge for future reuse`: Check to save this judge configuration and use it from the existing judge dropdown in other workflows
* `Create new evaluation on re-run`: Check to create a new evaluation each time the workflow runs
Every time you run this LLM as judge card, you'll see a success message with a direct link to view your evaluation results. Depending on what configurations you selected, a new evaluation will be created or the old one will be replaced. They can be accessed and referenced in the `Evaluations` and `Dashboards` tabs anytime respectively.
### Step 5: Open the evals in Evaluations tab or Dashboard tab
Navigate to the `Evaluations` tab in SGP to view your evaluation results. You can search, filter by date range, and filter by tags to find specific evaluations.
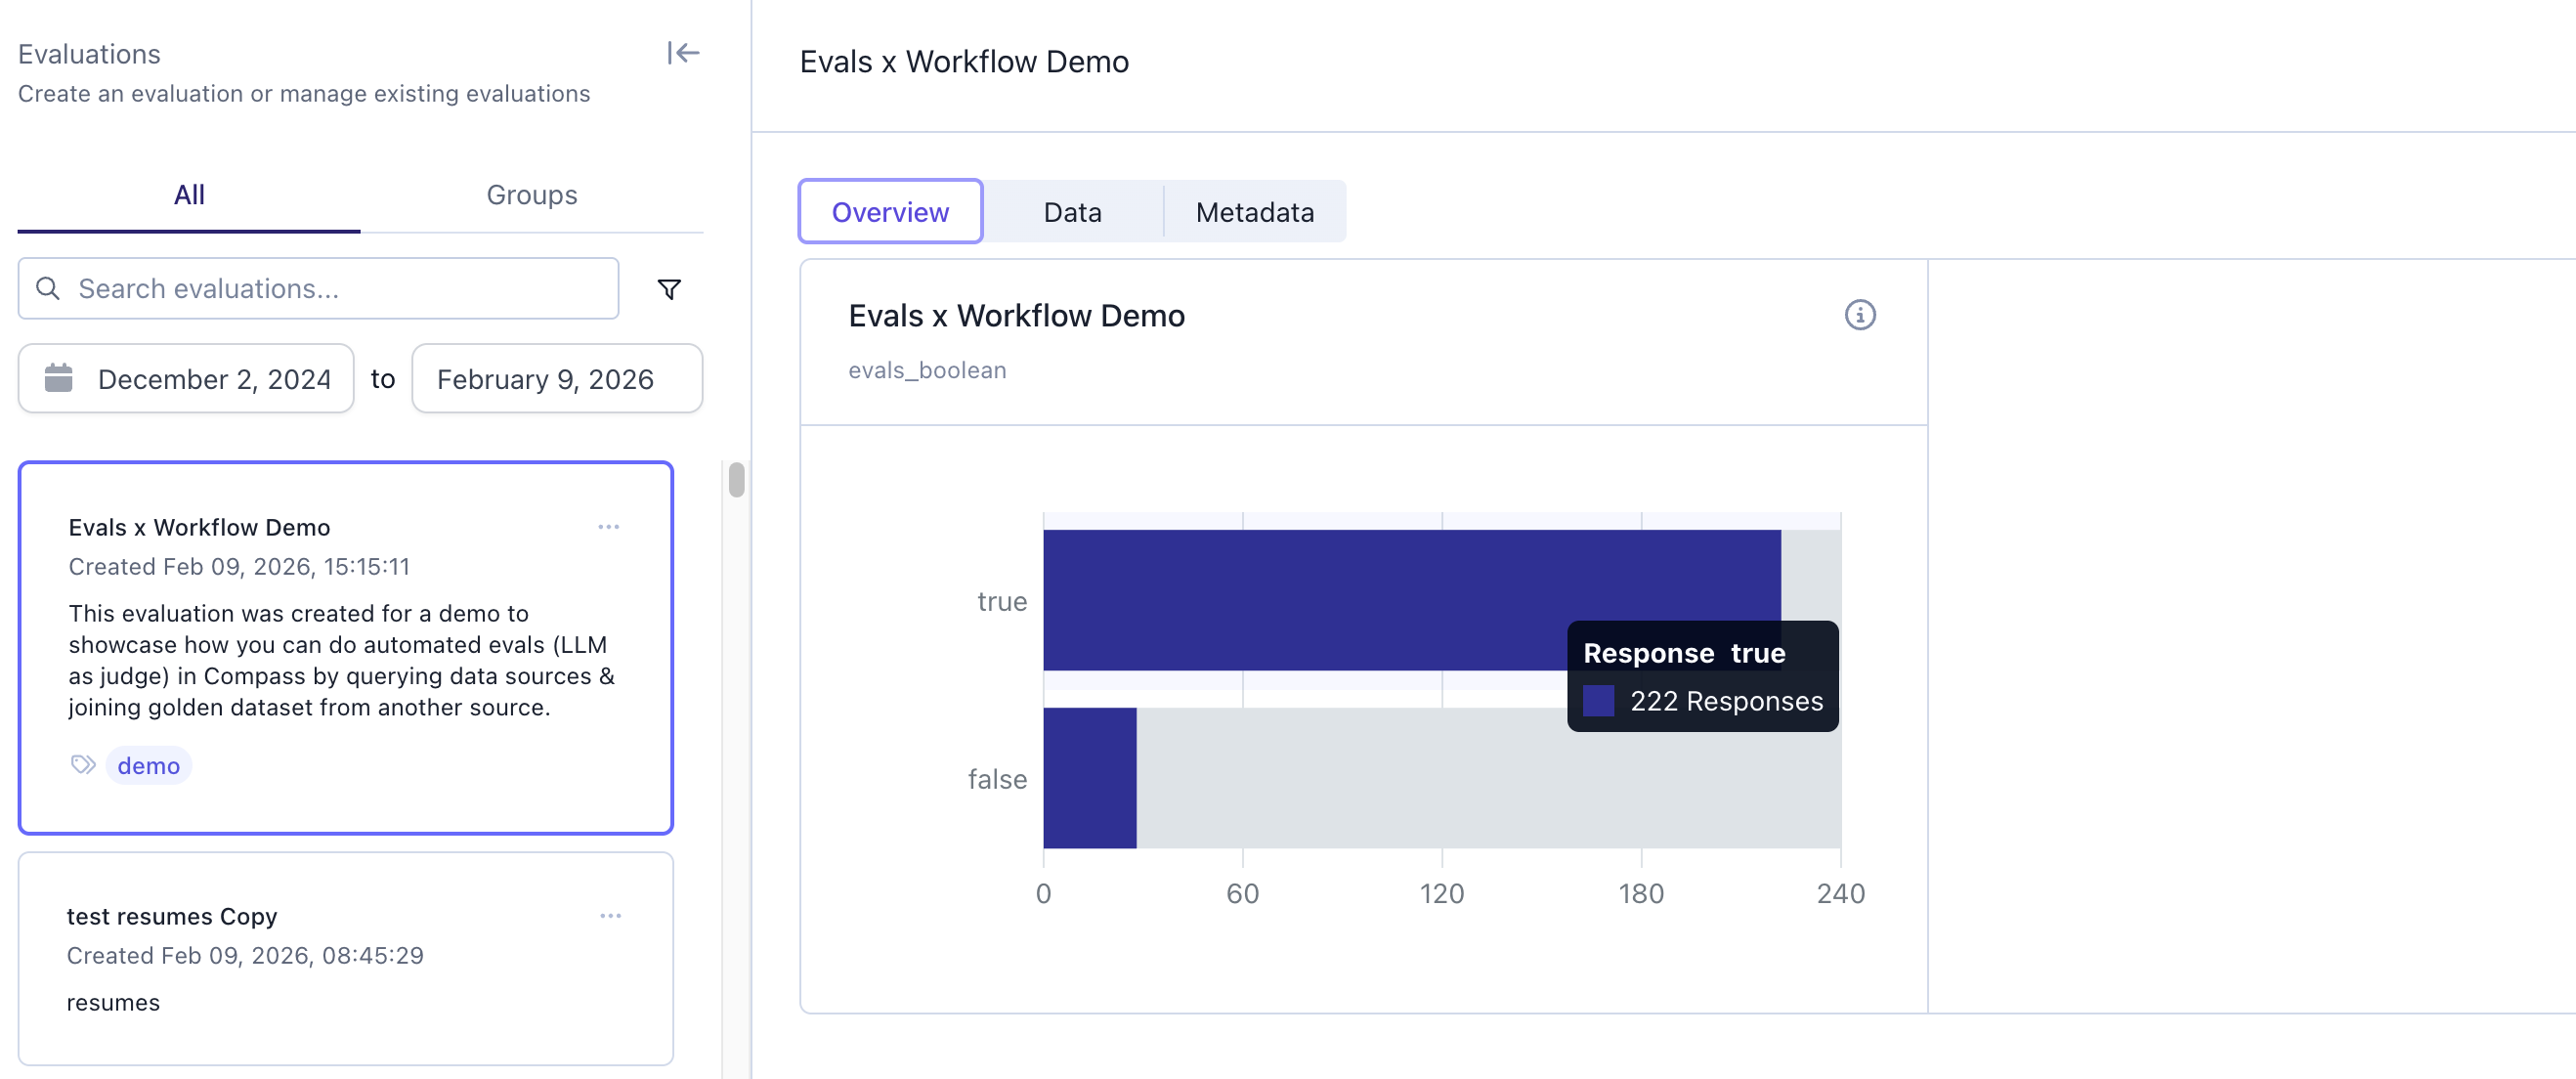 Click on an evaluation to see:
* `Overview`: Visual summary of evaluation metrics and response distributions
* `Data`: Detailed row-by-row results with all columns
* `Metadata`: Information about when and how the evaluation was created
From here, you can also open the evaluation in the `Dashboards` tab for deeper analysis and custom visualizations.
### Step 6: Automate the evals to run on a schedule
To automate your evaluation workflow, click the calendar icon beside the title to set a schedule.
Click on an evaluation to see:
* `Overview`: Visual summary of evaluation metrics and response distributions
* `Data`: Detailed row-by-row results with all columns
* `Metadata`: Information about when and how the evaluation was created
From here, you can also open the evaluation in the `Dashboards` tab for deeper analysis and custom visualizations.
### Step 6: Automate the evals to run on a schedule
To automate your evaluation workflow, click the calendar icon beside the title to set a schedule.
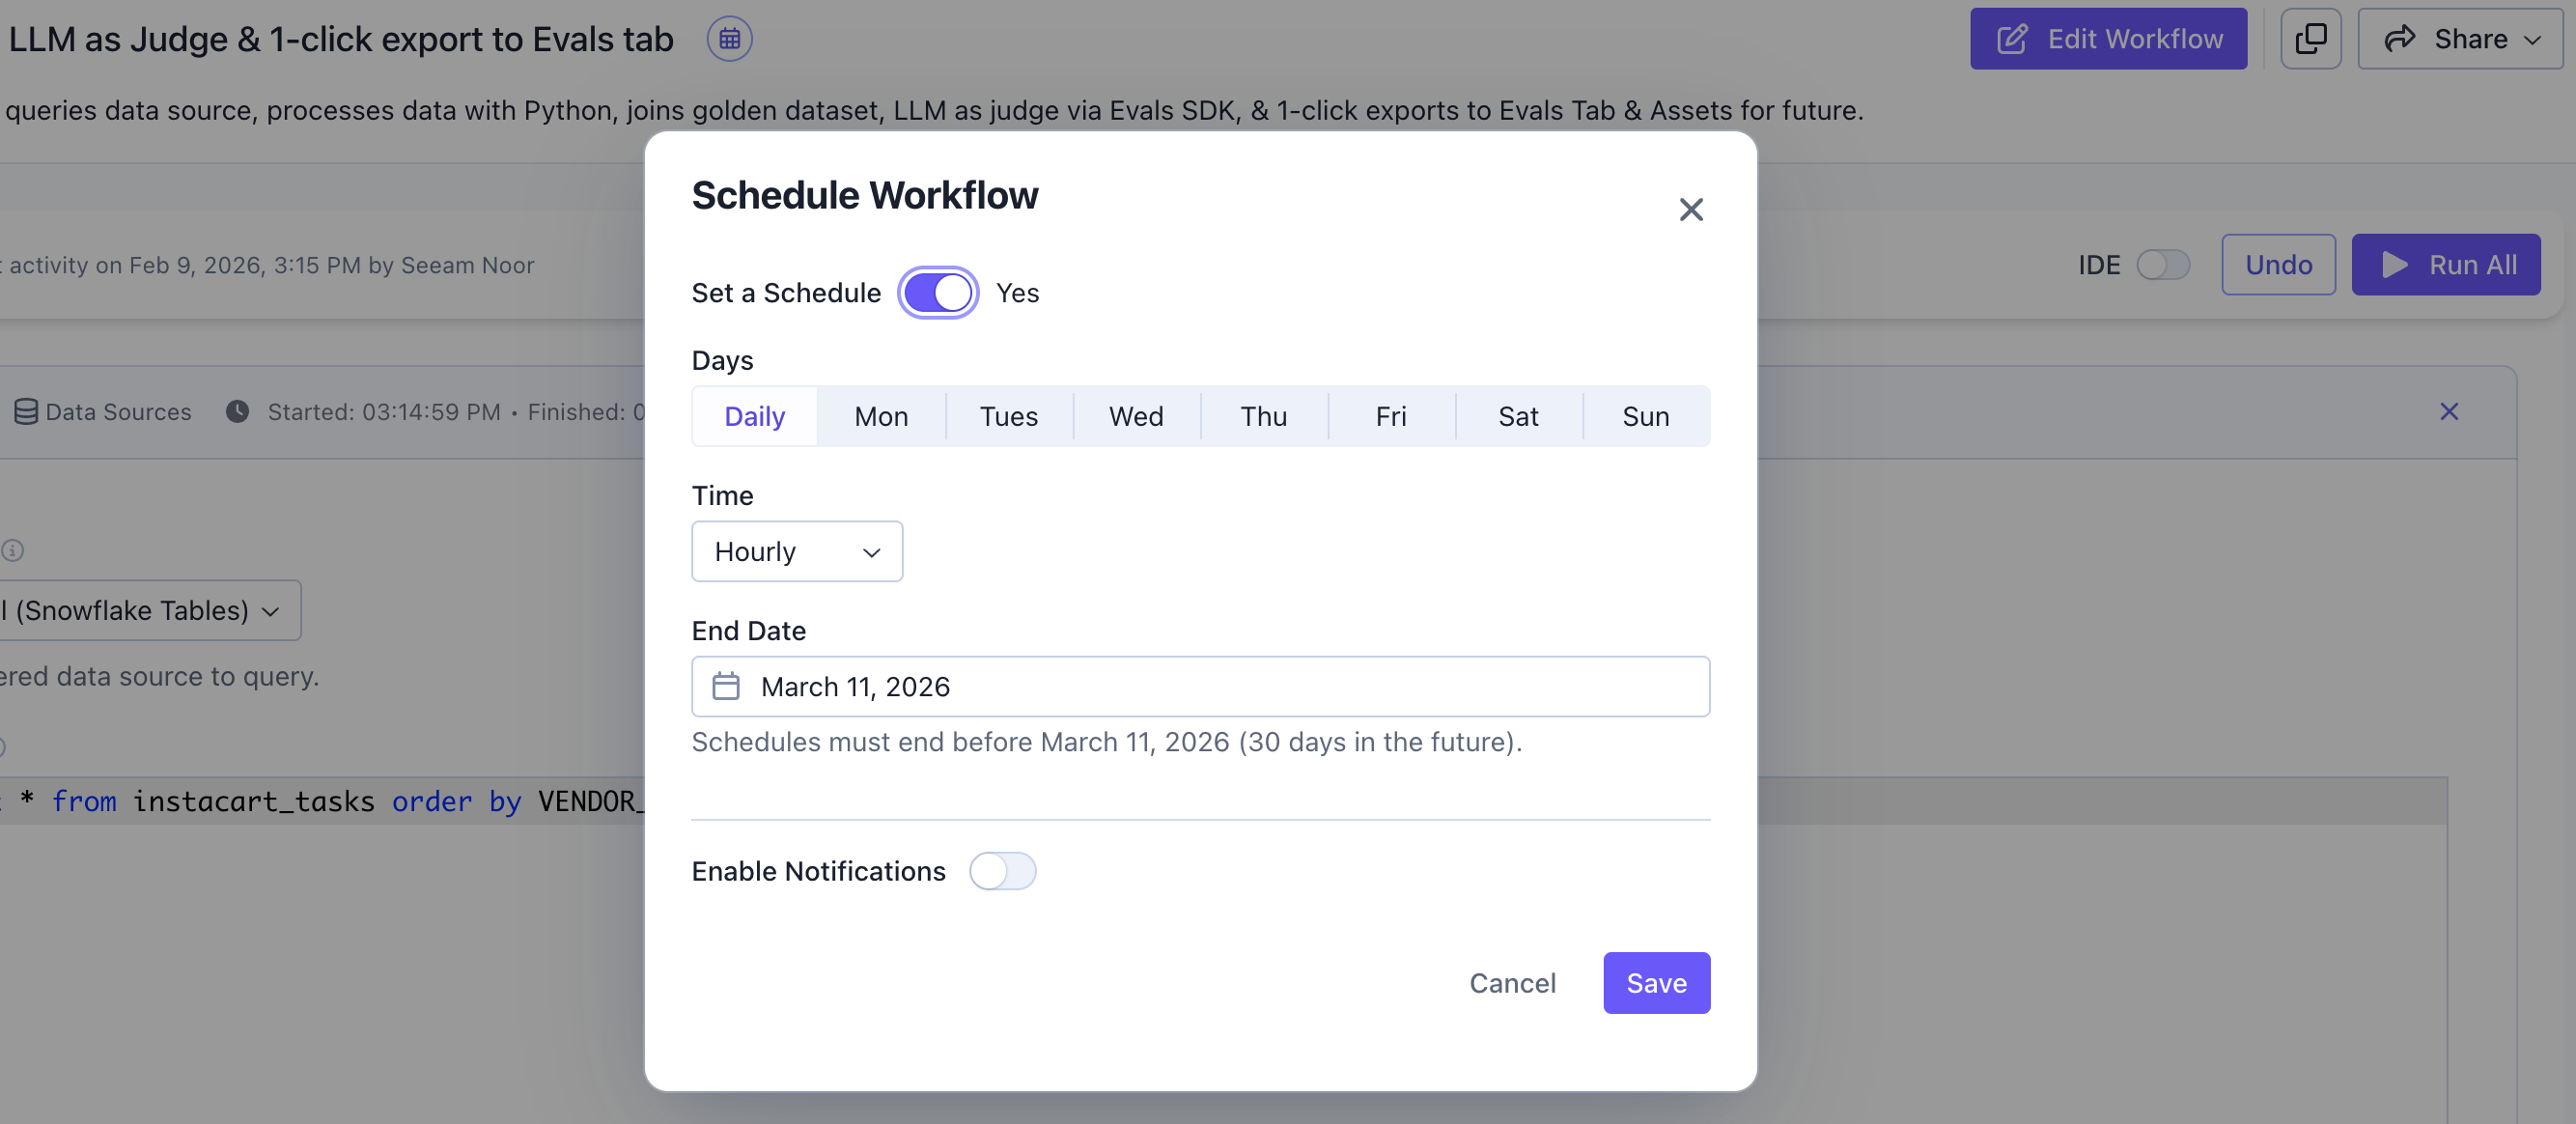 Configure the schedule:
1. `Set a Schedule`: Toggle on to enable scheduling
2. `Days`: Choose `Daily` to run every day, or select specific days of the week
3. `Time`: Set the frequency (e.g., `Hourly`) or a specific time
4. `End Date`: Schedules can run for up to 30 days into the future
5. `Enable Notifications`: Toggle on to receive Slack alerts for failed runs
Click `Save` to activate your scheduled workflow. You can monitor all scheduled runs from the `Execution logs` in the side menu, and view `Workflow history` to track changes across versions.
### Step 7: Create SGP Dashboards to show trends over time
You may export a workflow's output as an evaluation anytime utilizing the `Export as Evaluation` card. You can run that export on a schedule. That workflow can automatically create a new `Evaluation` in the SGP `Evaluations` tab. You can click on the `View Evaluation` button at the bottom of the card to visit that tab anytime.
Configure the schedule:
1. `Set a Schedule`: Toggle on to enable scheduling
2. `Days`: Choose `Daily` to run every day, or select specific days of the week
3. `Time`: Set the frequency (e.g., `Hourly`) or a specific time
4. `End Date`: Schedules can run for up to 30 days into the future
5. `Enable Notifications`: Toggle on to receive Slack alerts for failed runs
Click `Save` to activate your scheduled workflow. You can monitor all scheduled runs from the `Execution logs` in the side menu, and view `Workflow history` to track changes across versions.
### Step 7: Create SGP Dashboards to show trends over time
You may export a workflow's output as an evaluation anytime utilizing the `Export as Evaluation` card. You can run that export on a schedule. That workflow can automatically create a new `Evaluation` in the SGP `Evaluations` tab. You can click on the `View Evaluation` button at the bottom of the card to visit that tab anytime.
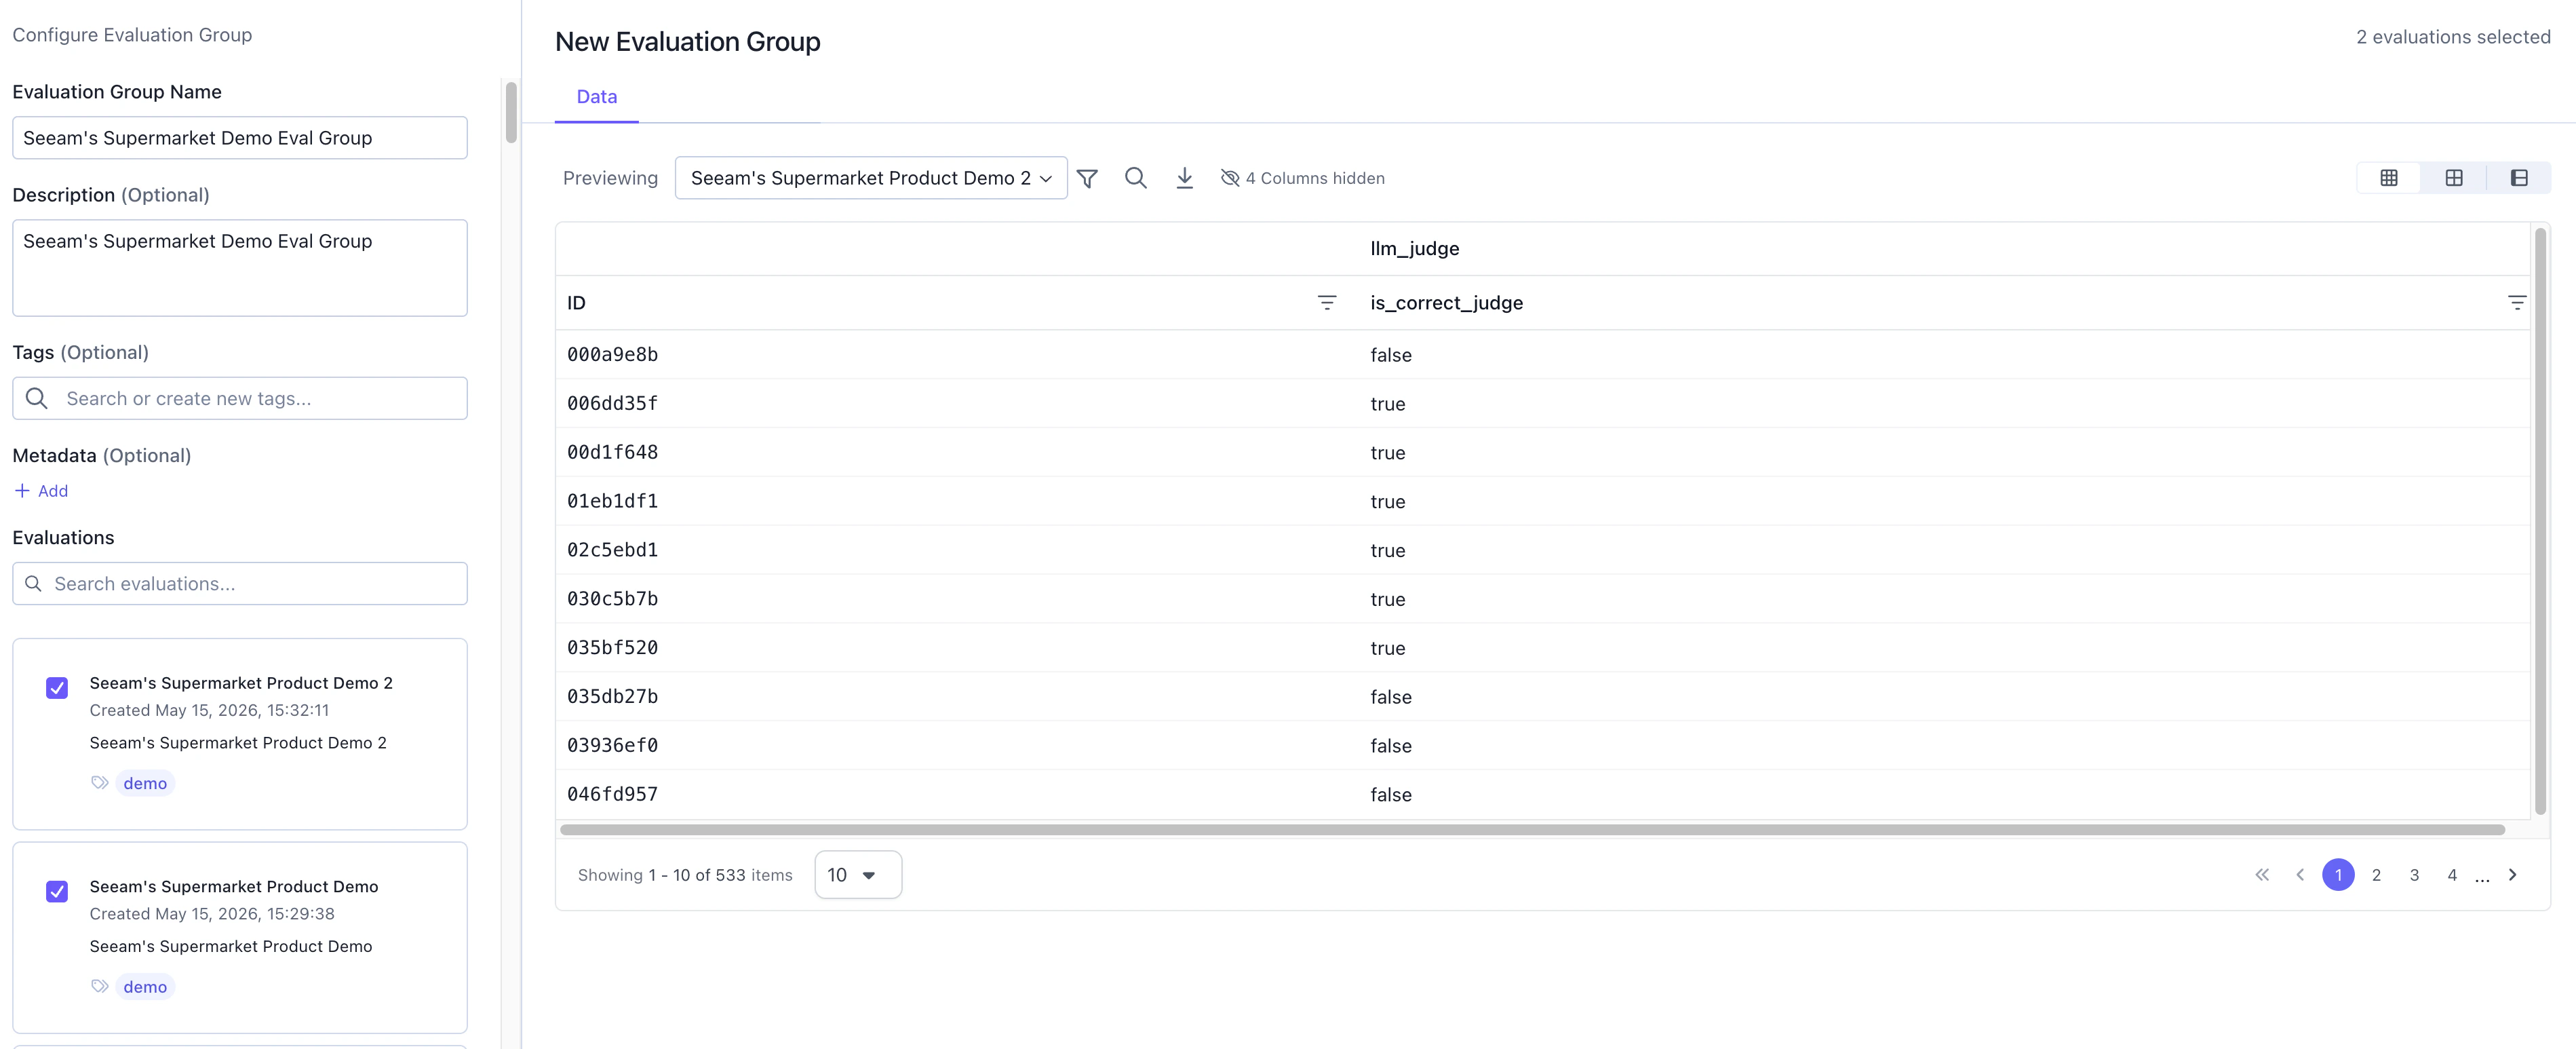
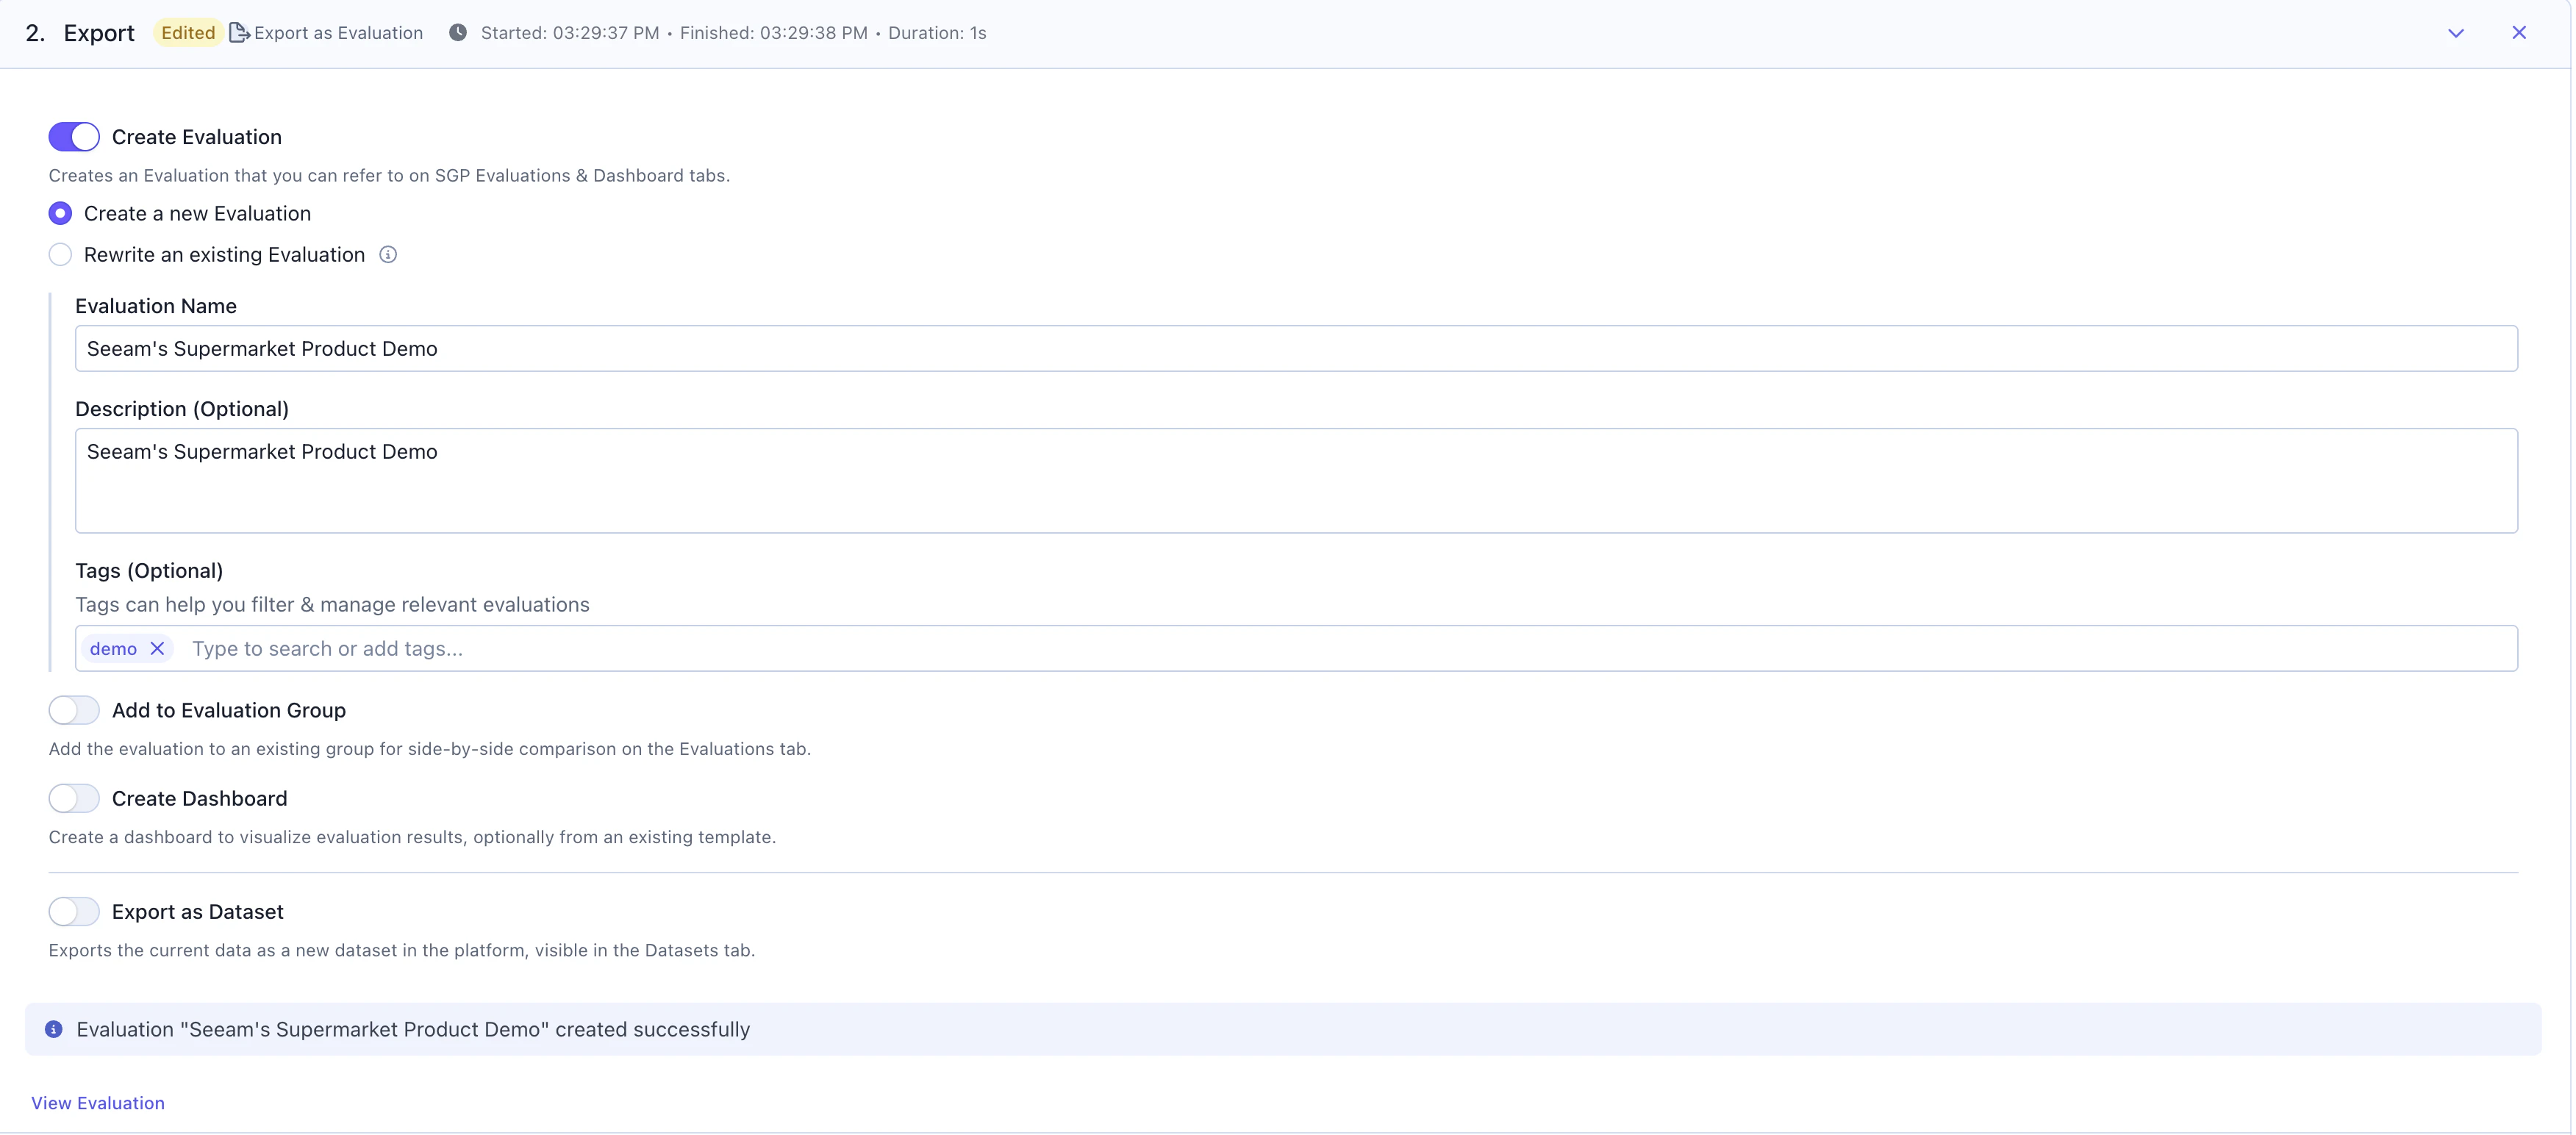 As you run the evaluation workflow on a schedule, you might want to track the trend line of your metrics in a dashboard. To do that, you must add your `Evaluation` to an `Evaluation Group`. To create an `Evaluation Group` you need 1+ Evaluations. Go to the `Evaluations` tab to create an `Evaluation Group`.
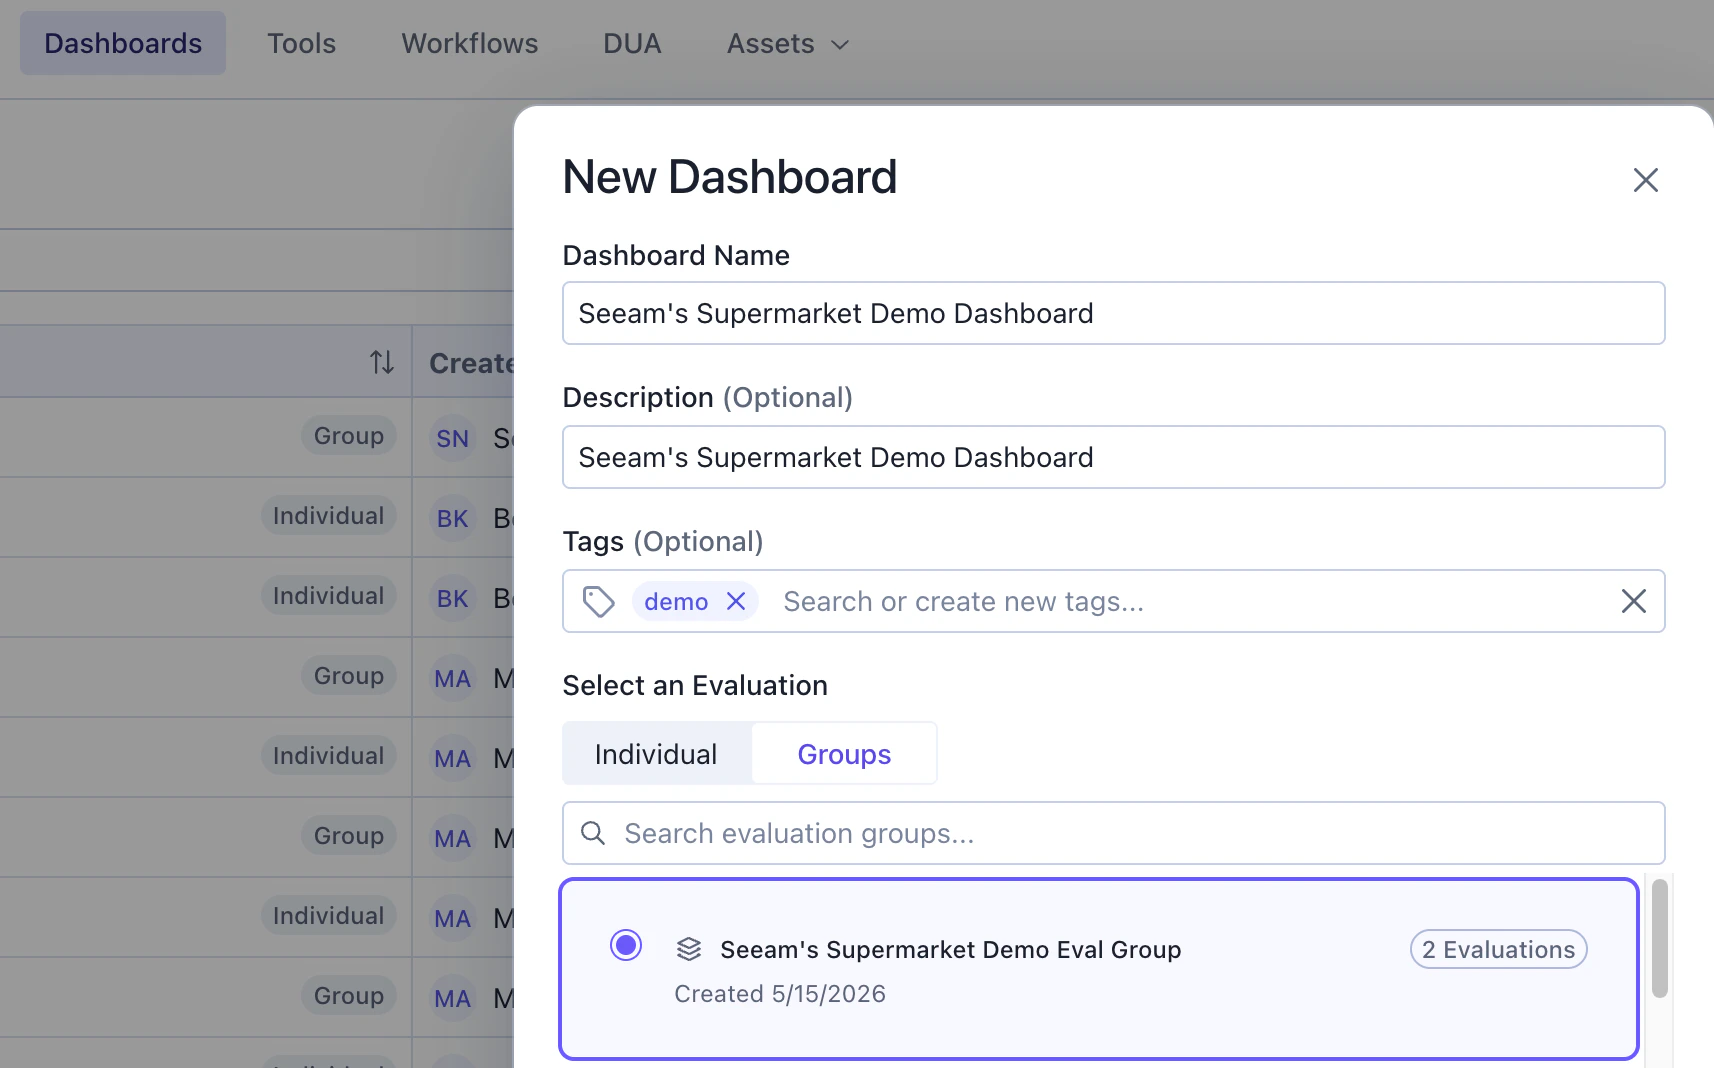
 Next, go to the SGP `Dashboards` tab and create a dashboard using the evaluation group you just created. For your use case, you will want to create a `Timeseries Widget` with the metrics across your evaluations inside the same group. [Learn more about Evaluation Group Dashboards →](/docs/v5/evaluation-dashboards/eval-group-dashboards#what-are-evaluation-group-dashboards)
 After you have set the evaluation group dashboard and the widgets you want, you can update your workflow `Export as Evaluation` card to write every new evaluation run to the `Evaluation Group` you created for this dashboard. Doing so will automatically update the associated dashboard every time you run this workflow. You can visit the updated evaluation group dashboard by clicking on the `Visit Evaluation Group` button at the bottom of the card and then clicking on the `Open in Dashboards` button at the top right in the new window. Congrats! Now, you have an automated evaluation pipeline that updates metrics and visualizations over time.
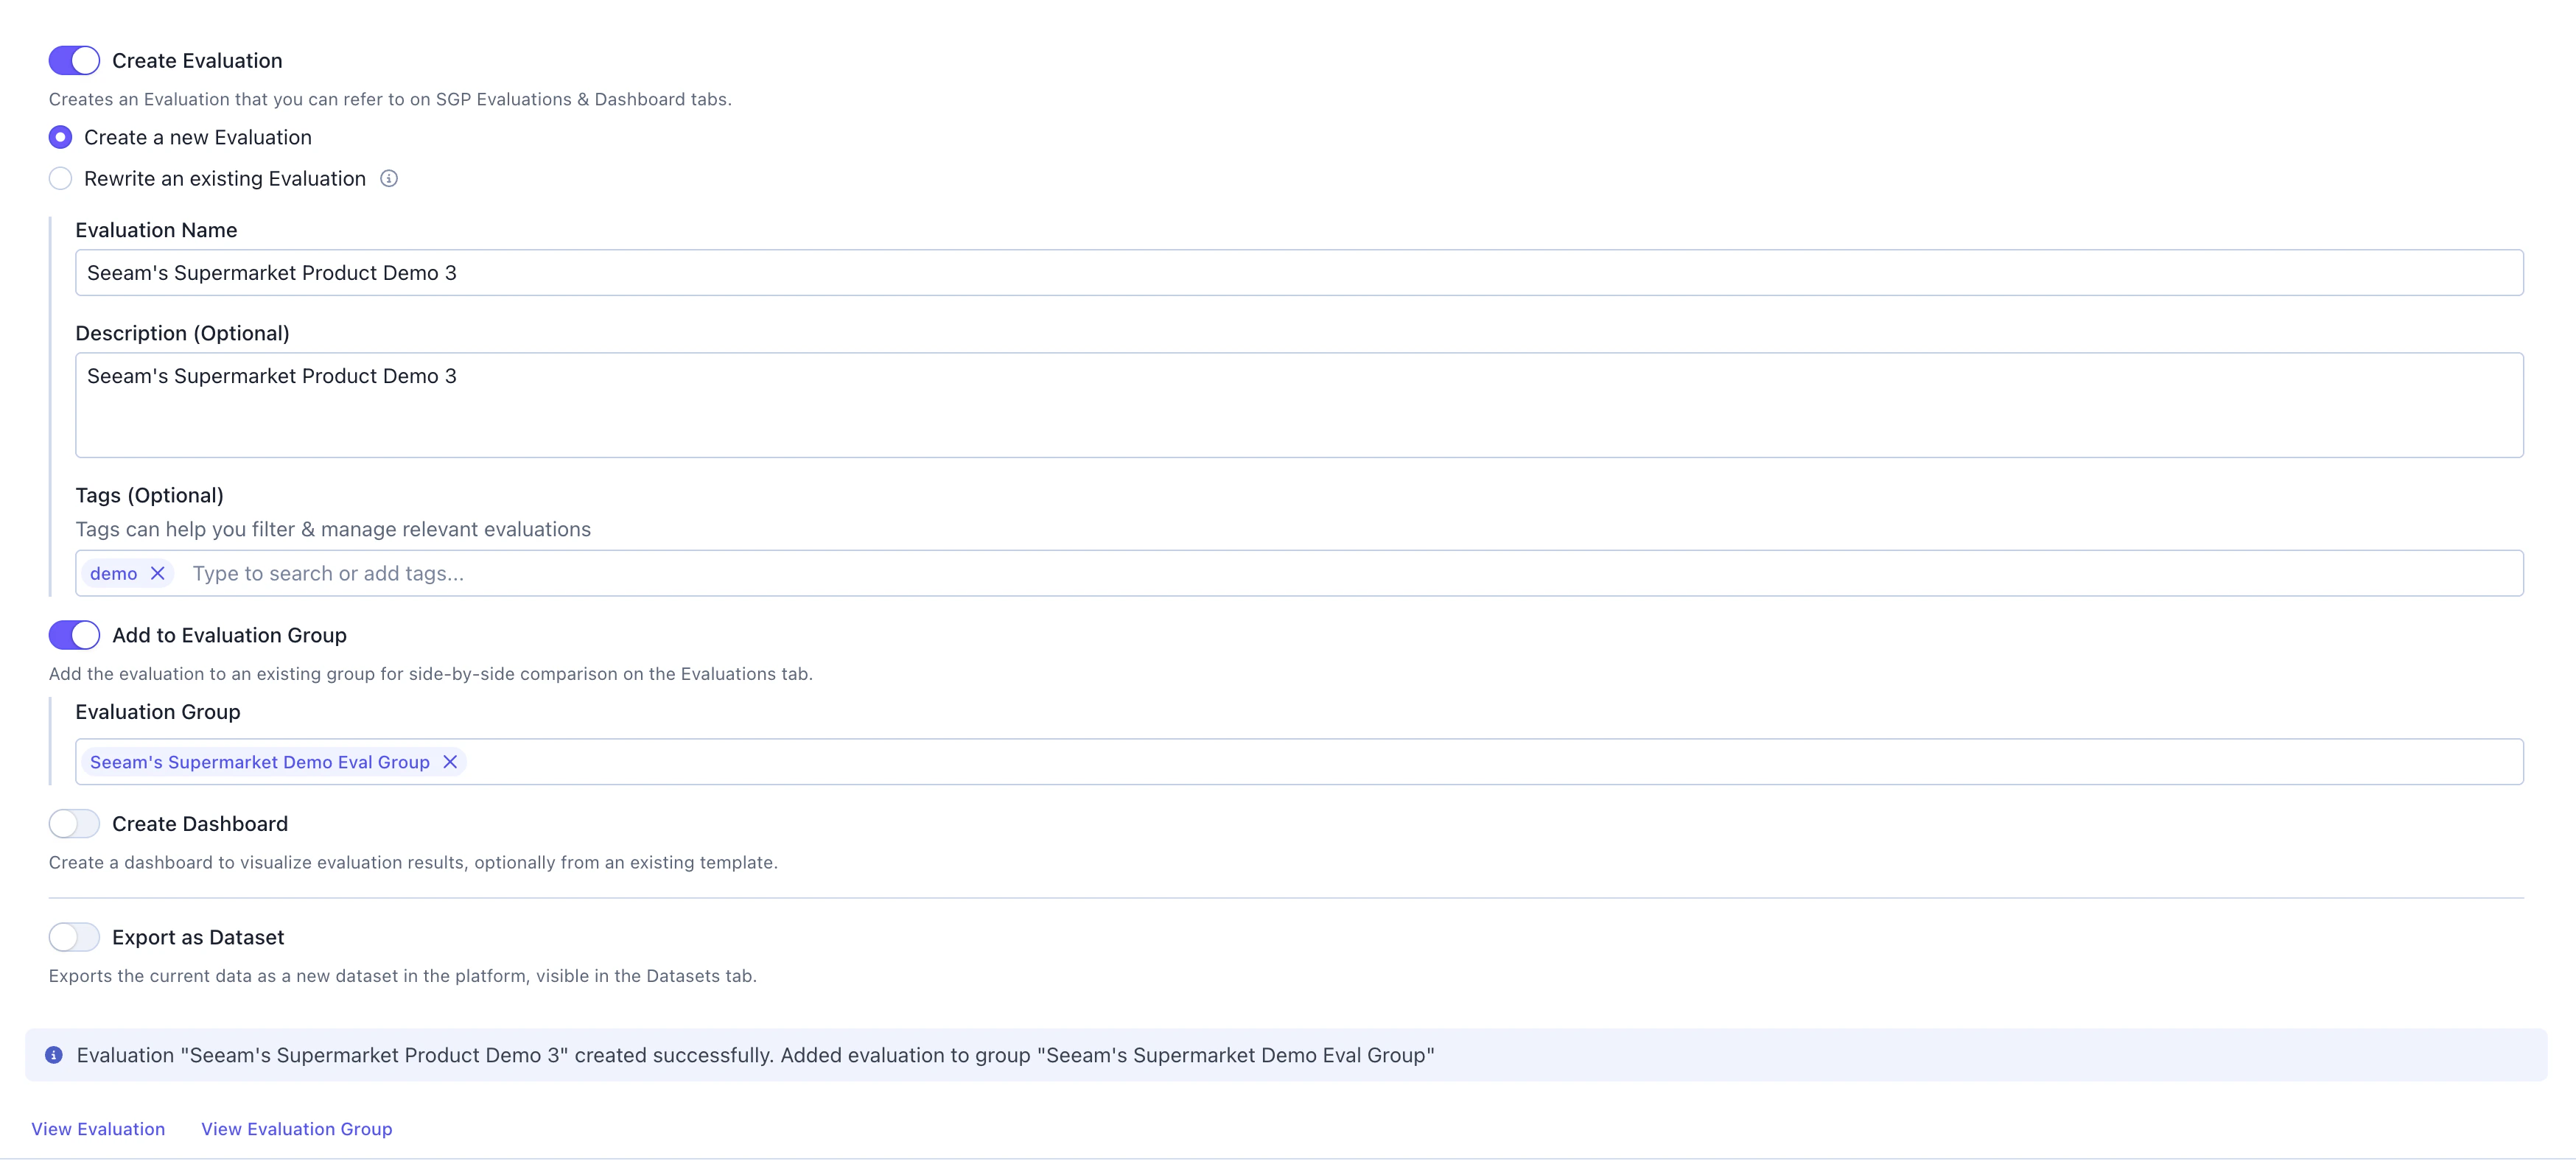 In the future, if you want to create a new dashboard in the same style for another evaluation workflow, when you come to this `Export as Evaluation` step, enable the `Create Dashboard` toggle, and pick your old dashboard as the template such that all the necessary widgets get carried over. You can also create a new empty dashboard with this card directly without any templates.